


Introduction
Acute urinary tract infections (UTIs) are one of the most common clinical syndromes encountered by clinicians. UTIs are mainly caused by uropathogenic Escherichia coli (UPEC) [Reference Foxman and Brown1], which mostly originates from the intestinal flora [Reference Stamm2, Reference Yamamoto3]. In contrast, epidemics of nosocomial UTIs are recognised to be due to UPEC strains and these clusters of infections occasionally present unusual phenotypes with antimicrobial resistance [Reference Lau4]. In community settings, UPEC can be sexually transmitted [Reference Ulleryd5] and may also be shared among household members in the absence of sexual contact [Reference Johnson and Clabots6]. Moreover, community-wide occurrence and outbreaks of UTIs caused by genetically closely related lineages of drug-resistant UPEC strains are reported [Reference O'Neill7]. Interestingly, the pandemic lineages of UPEC have been recognised. These analyses clearly indicate that certain lineages of UPEC are clonally disseminated worldwide, but little is known about the mechanisms and extent of dissemination of UPEC strains in communities. Moreover, cases of community-acquired UTIs have not been characterised collectively according to time, place and person, though such analyses are the first steps of descriptive epidemiology for a transmissible disease [Reference Giesecke8]. Additionally, the majority of clinical studies [Reference Phillips9, Reference Manges10] have focused on antimicrobial resistance, which is not suitable for estimation of the whole population of UPECs including both antibiotic susceptible and resistant strains.
In this context, we conducted a molecular and epidemiological study utilizing genotyping methods to examine the dissemination pattern and population structure of UPEC strains that are responsible for community-acquired UTIs in the Japanese mid-sized city of Takikawa in Hokkaido, Japan. As of 31 January 2012, the city of Takikawa possessed an estimated population of 43 270 with 21 486 households. This permitted us to cover the designated sample area in cooperation with multiple institutions in order to minimise sampling bias. Our results, obtained by using integrating genotyping and fundamental epidemiological analysis, comprehensively characterise acute UTI as a transmissible disease.
Materials and methods
Subjects and ethics
The subjects consisted of women with symptoms of acute UTIs who visited clinics or hospitals in Takikawa and who gave written informed consent to be included in this study. The enrollment period was from 1 April 2011 through 31 March 2012. The study was conducted according to the Declaration of Helsinki, national and institutional standards and STROME-ID guideline [Reference Field11]. Ethical approval for this study was granted by the Ethics Committee of Takikawa Municipal Hospital (24 March 2011; No. 11-04). There are 23 medical service providers in Takikawa. Ten of the 13 general Internists clinics or hospitals, one (the only) urology and one gynaecology clinic participated in the study. The other 10 speciality clinics (e.g., psychiatry) did not participate in the study.
The inclusion criteria for the female patients with acute UTIs in this study were: (i) age 16 years or older; (ii) the presence of at least one of the following symptoms as the chief complaint (painful or uncomfortable urination, suprapubic pain or discomfort, increased urinary frequency, urgency, incomplete emptying feeling and visible hematuria of less than 4 weeks duration); (iii) pyuria demonstrated by urinary sediment, test tape, or flow cytometry; (iv) a significant viable bacterial count in urine. Exclusion criteria were: (i) hospitalised patient or outpatient who have discharged from a hospital within 4 weeks and (ii) those with urinary catheter or urological diseases. Demographic characteristics, such as the date of birth, address (district level), were recorded.
Bacterial isolation, identification and antimicrobial susceptibility testing
Voided-midstream-urine samples were applied to Diaslide urine culture devices [Reference Rosenberg12] (Diaslide Nissui RTM, Nissui Pharmaceutical Co., LTD, Tokyo, Japan) at each institute and sent to the central microbiological laboratory of Takikawa Municipal Hospital. Viable bacterial counts were enumerated with the device and more than 1000 colony-forming units per ml (CFU/ml) for uropathogens [Reference Grabe TEB-J13] was considered significant to avoid underdiagnosis. Identification of bacterial species and determination of antimicrobial susceptibility were performed using the Microscan WalkAway-96 Systems, (Beckman Coulter, Inc., USA), using NBP3J for gram-negative bacteria and PBP3.2J for gram-positive bacteria. The NBP3J panel included the 27 antibacterial agents (ampicillin, piperacillin, cefazolin, cefotiam, cefaclor, cefotaxime, ceftazidime, cefoperazone, cefpodoxime, cefepime, cefpirome, cefozoplan, latamoxef, flomoxef, cefmetazole, aztreonam, imipenem, meropenem, gentamicin, tobramycin, amikacin, isepamicin, minocycline, trimethoprim-sulfamethoxazole, levofloxacin, ciprofloxacin and fosfomycin.) Isolates were defined as resistant, intermediate, or susceptible according to Clinical and Laboratory Standards Institute (CLSI) guidelines [14] and intermediate isolates were classified as susceptible for further analysis. E. coli 25 922 and Pseudomonas aeruginosa 29 853 from the American Type Culture Collection were used as quality control strains. Isolates of E. coli were stored in cryogenic vials (Microbank™, Pro-Lab Diagnostics Inc., Richmond Hill, Canada) at −70 °C until analysis.
O serogrouping and phylotyping
O serogrouping was performed for E. coli isolates using established protocols with antisera both from SSI Diagnostica, Denmark and Denka Seiken Co., Ltd, Japan. E. coli isolates were phylotyped into A, B1, B2 and D groups using a modified triplex polymerase chain reaction (PCR) method [Reference Clermont, Bonacorsi and Bingen15].
Multilocus sequence typing (MLST)
MLST of all E. coli isolates was performed as described elsewhere [Reference Wirth16]. Gene amplification and sequencing were conducted by using the primers specified at the website of the University Warwick, UK (http://enterobase.warwick.ac.uk/species/index/ecoli). The allele sequences of the seven genes were submitted to the website for sequence types (STs). In addition, a MLST alignment was done using the concatenated nucleotide sequences of the seven gene fragments in the order adk, fumC, gyrB, icd, mdh, purA and recA. Aligned 3423-bp sequences were analysed for phylogeny reconstruction with the neighbour joining method utilizing the maximum composite likelihood model on MEGA5.2.2 [Reference Tamura17].
Restriction fragment length polymorphism (RFLP) analysis
RFLP was performed using pulsed-field-gel electrophoresis (PFGE) analysis of XbaI-digested DNA from all E. coli isolates according to the Centers for Disease Control and Prevention (CDC) PulseNet protocols, with modifications, as described previously [Reference Pei18]. Briefly, PFGE was performed with the CHEF DR III system (Bio-Rad Laboratories, Tokyo, Japan) and gel images were captured with the Gel Doc EQ and Quantity One systems (Bio-Rad Laboratories, Inc., Tokyo, Japan). A dendrogram was generated from cluster analysis of the Dice coefficient based on the unweighted pair group method with arithmetic means using the BioNumerics program (Applied Math, Kortrijk, Belgium). Isolates were considered to belong to a closely related group if their Dice similarity index was equal to or greater than 95%.
Statistical methods
To analyse categorical variables (e.g., drug resistance) with multiple groups, the exact multinomial test was performed and, if a result was significant, an exact binomial test for each group vs. the sum of the other groups was additionally performed. The Kruskal–Wallis test was utilised to compare continuous variables (e.g., age) of multiple groups and post hoc P-values of all possible pairs of groups were calculated by Dunn's method as needed. To identify temporal clustering, we tested whether the temporal distribution of strains could be distinguished from theoretical frequencies calculated using the Poisson formula e −μμr/r!, where μ is the mean of frequencies and r is the number of events. All analyses were performed with a P-value threshold for statistical significance of 0.05 using JMP software version 10.0 (SAS Institute), MEGA5.2.2 (Wineskin) and R version 3.5.1 (The R Foundation).
Results
Study subjects
A total of 247 specimens were collected. We checked for redundancies by verification of their identification number, date of birth and address. Consequently, 11 duplicated cases were identified. Only samples from the first visit were included in the analysis. Of the 236 non-duplicate samples, 209 had a significant number of viable bacterial counts. The identified species were E. coli (n = 166; 79.4% of isolates), Staphylococcus saprophyticus (11; 5.3%), Citrobacter freundii (4; 1.9%), Staphylococcus epidermidis (4; 1.9%), Citrobacter amalonaticus (3; 1.4%), Staphylococcus aureus (2; 1.0%), Streptococcus agalactiae (2; 1.0%), Klebsiella pneumoniae (2; 1.0%), and miscellaneous (15; 7.2%). The largest number of cases was from patients in their seventh decade; with a median age of 64 years (Fig. 1).

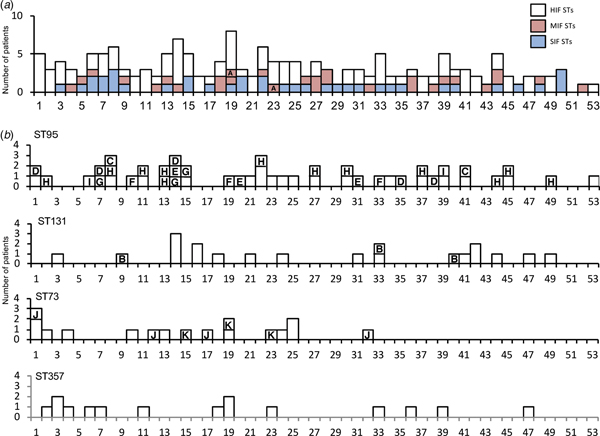
Fig. 1. Age distributions by categories of sequence types and by four high-isolation-frequency sequence types. (a): Age distribution classified by classes of STs. (b): Age distribution classified by four high-isolation-frequency STs: ST95, ST131, ST73 and ST357. Note the two peaks for the 20–30s and 50–70s shown in all categories of sequence types. HIF, high-isolation-frequency ;MIF, middle-isolation-frequency; SIF, single-isolation-frequency; ST, sequence type.
Antibitotic susceptibility testing (AST)
AST was carried out on all 166 E. coli isolates. Of these, 129 (77.7%) were fully susceptible to the tested drugs, 13 (7.8%) were resistant to at least one agent and 24 (14.5%) were resistant to two or more agents (Table 1, For detailed AST results see Supplementary Table S1).
Table 1. Drug-resistance ratea and age of cases according to STs and CRGs

ST, sequence type; HIF, high-isolation-frequency; MIF, middle-isolation-frequency; SIF, single-isolation-frequency; CRG, closely related group.
a Strains that defined resistant to any of tested drugs were regarded as to have drug resistance.
b P = 2.012 × 10⁻⁶, Fisher's exact multinomial test.
c, d, eP = 0.0068, 1.249 × 10⁻⁵, 0.0141, respectively; Fisher's exact binomial test, compared with the sum of the other ST groups.
f P = 0.0407 (χ 2 statistic = 9.986), Kruskal–Wallis test.
g, h, iP = 0.013, 0.021, 0.026, respectively; Dunn's post hoc test.
O serogrouping and phylotyping
Of the166 isolates, 104 isolates reacted to one of the 16 antisera: O1 (n = 25; 15.1% of E. coli isolates), O2 (17; 10.2%), O25 (17; 10.2%), O18 (13; 7.8%), O6 (6; 3.6%), O16 (6; 3.6%), O22 (6; 3.6%), O75 (4; 2.4%), O15 (3; 1.8%). O7, O8, O17, O63, O86a, O115 and O143 were positive for a single isolate (1; 0.6%) each. Therefore, 62 isolates were O-antigen untypeable (OUT). A majority of the E. coli isolates showed phylotype B2 (130 isolates; 78%) followed by D (19; 11%), B1 (10; 6%) and A (7; 4%).
MLST and phylogenetic analysis
The 166 E. coli isolates were analysed by MLST and assigned to 53 STs. Twelve STs (ST3510, ST4005, ST4036 to −40, ST 4042 to −45 and ST4678) from 13 isolates were novel to this study. Six of them contained new alleles (adk349, adk350, fumC603, gyrB249, icd430, icd431); the remaining six STs were composed of new combinations of previously sequenced alleles. The STs were classified into three categories according to their isolation frequencies in order to analyse the determining factors.
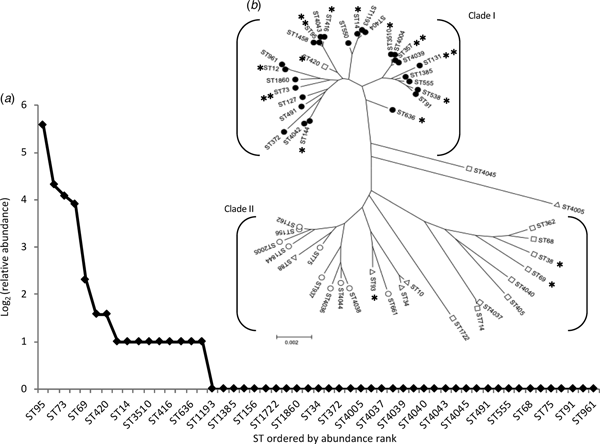
The most frequent STs were ST95 (n = 48; 29% of isolates), ST131 (20; 12%), ST73 (17; 10%) and ST357 (15; 9%). We designated these as high-isolation-frequency (HIF) STs. Thirty-seven STs were single-isolation-frequency (SIF). These were ST34, ST68, ST75, ST88, ST91, ST127, ST156, ST162, ST362, ST372, ST404, ST405, ST491, ST550, ST555, ST661, ST714, ST937, ST961, ST1193, ST1385, ST1458, ST1722, ST1844, ST1860, ST2005, ST4005, ST4036, ST4037, ST4038, ST4039, ST4040, ST4042, ST4043, ST4044, ST4045 and ST4678 The other 12 STs (ST10, ST12, ST14, ST38, ST69, ST144, ST93, ST416, ST420, ST538, ST636, and ST3510) were isolated from two to five patients each and were designated as middle-isolation-frequency (MIF) STs accounting for a total of 29 isolates. The distribution of STs, as a rank abundance diagram, is shown in Figure 2(a), indicating that only a few STs were common and the majority were rare.

Fig. 2. The diversity and population structure of Escherichia coli causing community-acquired acute bacterial cystitis in Takikawa. (a) shows a relative-sequence-types abundance curve. This chart displays the diversity of sequence types. (b) shows a phylogenetic tree of the 53 STs, composed of the two distinct clades. **, high-isolation-frequency STs; *, middle-isolation-frequency STs; filled circles, phylotype B2; open circles, phylotype B1; open triangles, phylotype A; open squares, phylotype D. Of the 3 isolates of ST10, two isolates exhibited phylotype A and the other exhibited phylotype D.
Phylogenetic tree analysis (Fig. 2(b)) revealed that almost all (51 of 53) STs belonged to one of the two major clades, Clade I and II. All HIF STs and 75% (9 of 12) of MIF STs were assigned to the Clade I, most constituents had the B2 phenotype (30 of 31), with a relatively shorter branch length compared with that of the Clade II, which was composed mainly of SIF STs and a few MIF STs, both of which exhibited phylotype A, B1, or D.
PFGE
PFGE was performed using XbaI on 166 isolates of E. coli and 160 patterns were available for analysis. Cluster analysis of Dice similarity indices identified 11 groups of closely related isolates using a 95% cut off value and a total of 42 isolates belonged to one of the 11 closely related groups, which were designated as closely related group A to K (closely related group, CRG, A to K) (Fig. 3). We labelled each CRG with a combination of the O serogroup, phylotype and ST as determined by MLST. The most commonly identified group was O1/OUT-B2-ST95-CRG H (12 isolates), followed by O2/OUT-B2-ST95-CRG D (5 isolates), O22/OUT-B2-ST73-CRG J (4 isolates) and O25-B2-ST131-CRG B (3 isolates).

Fig. 3. XbaI PFGE dendrogram for 160 Escherichia coli isolates collected in Takikawa. Six strains had a smear-like appearance. These were OUT-A-ST10, O15D-ST69, OUT-D-ST69, O115-B1-ST156, OUT-D-ST714, OUT-B1-ST4038, described in the order of the O serogroup, phylotype and MLST sequence type. CRGs determined with ⩾95% similarity are indicated in boxes and the group names are shown in capital letters on the right side. High-isolation-frequency (HIF) STs are indicated in the colored area.
Temporal and geographical patterns
Temporal patterns of cases with isolation of E. coli by week are shown in Figure 4. Fluctuations in the total number of cases and also in the proportion of the STs were observed throughout the study period. We then compared the actual frequencies of isolates by week to the theoretical frequencies (Supplementary Table S2). Our analysis did not find any significant difference (P = 0.523, x 2 = 6.124; χ 2 goodness of fit test).

Fig. 4. Temporal patterns of cases of acute bacterial cystitis with categories of STs and closely related groups of E. coli by week in Takikawa, Japan, April 2011–March 2012. HIF indicates high-isolation-frequency; MIF, middle-isolation-frequency; SIF, single-isolation-frequency; CRG, closely related group. The temporal patterns were classified by HIF, MIF, or SIF STs in Part A. The patterns of four HIF STs are shown separately in Part B. CRGs are identified by letters in columns. CRG H was isolated from the 2nd to 48th week with maximum of 8-week intervals and the interval of the 1st and 2nd isolates of CRG B was 23 weeks.
Of the 166 patients from whom E. coli was isolated, 122 resided in Takikawa and the remaining 44 visited from other municipalities. The ratio of the number of patients enrolled to 1000 females at each district of Takikawa varied widely from 0 to 13.9 with a median of 4.2. When we plotted the population and number of the cases enrolled for each district as shown in Figure 5(a) and (b), an approximately linear relationship was observed. However, six districts had 75% or greater ratio of enrollment. Therefore, we schematically mapped the distributions of the residences of the patients classified by STs and CRGs (Fig. 5(c) and (d)). Overt geographical clustering of a particular ST, or CRG was not identified, even in the six high-enrollment-ratio districts.

Fig. 5. Schematic maps of the City of Takikawa by districts and neighbouring municipalities April 2011–March 2012. (a): Districts classified by population density expressed as the quartiles. (b): Relationship between the registered number of cases and female population of each district. District identification numbers are in accordance with those of Part A. NM denotes neighbouring municipalities. *, The districts where the participated clinics or hospitals are located. Part C: Distributions of STs, classified into four (ST95, ST131, ST73, ST357) high-isolation-frequency, middle-isolation-frequency (MIF) or single-isolation-frequency (SIF) STs. Part D: Distributions of CRGs, which are identified by letters in circles. NM denotes neighbouring municipalities. Members of CRG H were isolated from 11 different districts or neighbouring cities, whereas only one district had only two isolates with an 11-month interval.
Bacteriological properties and case characteristics
To simplify comparisons, we combined the MIF and SIF STs into non-HIF ST (n = 66). There were differences of antibacterial resistance rates among five ST groups, non-HIF ST, ST95, ST131, ST73 and ST357. The rates of antibacterial resistance of ST95 and ST73 were lower than the sum of the other ST groups (Table 1). The isolates of ST131 had higher resistance rates against the tested antibacterial agents than the sum of the other STs (Table 1). In addition, age distributions were different among the ST groups. Importantly, the patients with ST95 were younger than those with non-HIF ST, ST73 and ST357 (Table 1). Patients with non-HIF STs had a peak age in the 70s, but for HIF STs, especially ST95, the peak was found in a younger population in their 50s and 60s (Fig. 1).
Discussion
In this study, we identified 11 genetically closely related groups whose members accounted for 25% (42/166) of the UPEC strains responsible for community-acquired acute UTIs. In the previous reports, a Dice coefficients similarity threshold of 94% was used to resolve unique PFGE types for establishing the evidence of within-household [Reference Johnson and Clabots6] and community transmissions [Reference Owens19]. A consensus on the appropriate cutoff level of similarity to discriminate unique clones in community-acquired infectious diseases by UPEC was not available. However, in this study, CRGs were determined stringently with a similarity index cutoff level of 95%. Thus, the degree of relatedness among each group's constituents appeared sufficiently high to indicate that these CRGs could be considered to represent distinct clones. Although the presence of the genetically similar groups of community-isolated UPEC has been reported [Reference Manges10, Reference Manges20–Reference Blanco22], we believe that the presented PFGE match, shown as CRGs, should be considered as evidence for transmission of UPECs in the community.
We utilised MLST for phylogenic analysis of the population structure because PFGE is more discriminating than MLST, with which phylogenic relationships could be overlooked. Approximately 60% of the UPEC isolates were assigned to only four STs (ST95, ST131, ST73, ST357), whereas a total of 53 STs were identified and three most common STs have been recognised as pandemic lineages [Reference Riley23]. The predominance of pandemic lineages is consistent with previous studies [Reference Manges20–Reference Blanco22, Reference Yamaji24, Reference Vincent25]. However, the most frequently isolated STs were variable (e.g., ST10, 15, 69, 73, 95, 117, 127, 131) suggesting that selection of adaptive lineages could be influenced by regional or local factors. On the other hand, the diversity patterns observed in these studies were similar; relatively few STs were abundant and most STs were rare. To analyse the diversity of UPEC strains, we calculated the relative-sequence-type abundance, a concept that is utilised commonly to describe biodiversity [Reference McGill26]. The relative abundance of STs graphed as a rank-abundance diagram in Figure 2 Part A showed a hollow curve, a universal pattern that is usually observed in species abundance in a variety of ecological communities [Reference McGill26]. We speculate that there is a common mechanism, likely selection pressures including antimicrobial usage and other factors, to determine dominant species and STs. The UPEC isolates were composed of at least two distinct subpopulations. The two phylogenetic clades of UPEC were different from each other in terms of isolation frequency and phylotype. Although this dichotomous population structure is consistent with a previous report [Reference Gibreel21], the correlation between the phylotype and isolation frequency is not always evident. ST10 and ST69, assigned to phylotype A and D respectively, were reported as some of the most frequently isolated STs elsewhere [Reference Manges20–Reference Blanco22]. Ways to identify the regional factors selecting for specific STs that become common within a community are sorely needed.
UPEC strains can be transmitted via water, food [Reference Vincent25], or through person-to-person contact [Reference Ulleryd5, Reference Freeman27, Reference Reeves28]. However, the water supply in Takikawa is monitored strictly according to the Drinking Water Quality Standards of Japan, which includes ‘E. coli, not to be detected.’ Although previous studies [Reference Johnson29, Reference Umene30] reinforced within-household transmission, the absence of geographical case concentration suggested that acute UTIs less frequently occurred in women living together with the patients than expected. This can be explained partly by the growing trend toward living in nuclear families (i.e., small family size) and by a feature of the pathogenesis of acute UTIs. UPEC can colonise the lower intestinal tract innocuously for a prolonged period [Reference Reeves28] and the development of acute UTIs commonly necessitates a risk factor [Reference Foxman and Brown1, Reference Foxman31–Reference Hooton33]. This unique, two-stage mechanism of onset of UTIs can hamper the shaping of an epidemic curve such as that typically seen in an outbreak if it exists. Nevertheless, the absence of overt geo-temporal clustering and the presence of more than one CRG indicate that the dissemination can hardly be explained by a simple point source outbreak. We hypothesise that the transmission of non-HIF STs, especially SIF STs, was limited to within households. This may explain why most of the STs were rare and diverse. Person to person transmissions in communities, especially if accumulated or intertwined with human and non-human reservoirs, may play a key role in the dissemination of non-HIF (MIF) STs. On the other hand, the contact mode of transmission alone cannot explain the global distribution of the pandemic lineages of UPEC. Since a food reservoir, such as poultry [Reference Bergeron34], was reported to be responsible for the dissemination of extraintestinal pathogenic E. coli [Reference Manges and Johnson35] elsewhere, circulation of contaminated retail meat products is a promising factor in this area. However, data to corroborate the involvement of food contamination are not available in this study. Recognizing that a substantial fraction of community-acquired acute UTIs – as the most common bacterial infections – is caused by the pandemic lineages of UPEC appears to be an important public health issue. This may imply that the pandemic lineages of UPEC contribute to the high incidence of acute UTIs.
To date, no single factor has been identified to be essential for the widespread dissemination of UPEC lineages [Reference Riley23]. Antimicrobial resistance is one of the favorable attributes for bacterial success in a community [Reference Gupta36], as, for example, ST131 [Reference Blanco22]; however, there was no significant difference in the antimicrobial-resistance rate between non-HIF STs and HIF STs. Moreover, ST95 and ST73, both HIF STs, had lower resistance rates than non-HIF STs, which indicates that antimicrobial resistance is not always required to become a common ST. This finding is consistent with previous reports [Reference Yamaji24, Reference Umene30], in which ST95 was the most common genotype and the strains of ST95 were mostly susceptible to all tested drugs. The prevalence of drug-susceptible isolates of ST95, ST73 and ST357, which together accounted for 57% (74/129) of all susceptible isolates, appears to have lowered the overall rate of antimicrobial resistance (22.3%) of the UPEC isolates. We next compared the antimicrobial susceptibilities of UPEC isolates in this study with those in a previous Japanese nationwide surveillance [Reference Hayami37] and found that the proportions of resistance against penicillins, cephalosporins, aminoglycosides and fluoroquinolones were similar to each other; therefore, we believe that the antimicrobial resistance rates in this study area are not significantly different from those in other areas of Japan. The patients harbouring UPEC ST95 were significantly younger than those carrying non-HIF UPEC STs. It is possible that there may be unknown biological or epidemiological factors linked to the isolates of ST95 for dissemination in younger patients. In contrast, the majority of UTIs occurred in the elderly in this study. This might be enhanced by the high numbers of elderly persons in Japan, but this may suggest that older age implies a greater risk of being colonised by UPEC in a community. Another study is warranted to identify the factors that facilitate clonal expansion of UPEC.
We acknowledge that our study was not a complete survey and possesses some limitations. The ratio of frequently isolated STs or CRGs might have been over- or underestimated due to unidentified sampling bias. It is also difficult to discriminate between local particulars and more general matters since the study area was limited. However, Takikawa and its surrounding areas are at least similar to other Japanese cities in terms of the population structure and public health status according to the official statistics (http://www.stat.go.jp/english/index.htm). The rationale for selecting 1000 CFU/ml for inclusion criteria is based on an established study [Reference Stamm2] comparing voided urine and suprapubic bladder aspirate specimens in women having cystitis and on the diagnostic accuracy of the Diaslide device [Reference Rosenberg12]. In this study, only 10 of 166 patients with E. coli present in their urine had bacterial densities of 1000 CFU/ml.
Conclusions
Our findings suggest that the genetically closely related groups of UPEC account for a significant percentage of UTIs independent of antimicrobial resistance. These strains are disseminated widely into a community and shared among its inhabitants via unidentified routes of transmissions. The UPEC isolates in this study were determined to be phylogenetically distinct and composed of at least two subpopulations. One included all HIF STs, mostly exhibiting phylotype B2 and the other was heterogeneous, consisting mainly of SIF STs, assigned to phylotypes other than B2. However, our work did not reveal distinguishable clustering in the geo-temporal isolation pattern of CRGs or STs, which suggests complicated mechanisms of the transmissions rather than a-point-source outbreak. Further epidemiological and molecular biology studies are needed to elucidate the routes of transmission and the factors that determine isolation frequencies in communities.
Supplementary material
The supplementary material for this article can be found at https://doi.org/10.1017/S0950268819000426
Author ORCIDs
M. Matsukawa, 0000-0002-3637-8385.
Acknowledgements
We thank the patients for participating in this study, Takashi Abe for his dedicated technical support, Kim Barrymore for careful proofreading the manuscript, and Drs Yuji Ishida, Atsunori Iso, Manabu Bunya, Tsunenori Nishimura, Akiharu Dohchin, Kunihiko Takeda, Kunio Yoshida, Hiroshi Kambe and Shinichi Ozawa for patient enrollment. This work was supported partly by the National Institute of Allergy and Infectious Diseases of the National Institutes of Health under award numbers R01 AI100560 and R01 AI063517 (R. A. B.) and by funds and/or facilities provided by the Cleveland Department of Veterans Affairs, the Veterans Affairs Merit Review Program and the Geriatric Research Education and Clinical Center VISN 10 (R. A. B.). The contents of this work are solely the responsibility of the authors and do not necessarily represent the official views of the funding agencies. The funders of the study had no role in the study design, data collection, data analysis, data interpretation, or writing the report. The corresponding author, at all times, had full access to all the data in the study and had full responsibility for the decision to submit for publication.
Conflict of interest
None.


 Open access