

INTRODUCTION
In the United States, significant resources are devoted to conducting large population-based surveys. These surveys can be health-oriented, such as the National Health and Nutrition Examination Survey (NHANES) and the Nurses’ Health Study, or general surveys such as the Decennial Census [Reference Belanger1, Reference McQuillan, Gunter and Lannom2]. In the interest of maximizing their value, data from such studies are made available to other investigators. These data are often highly desirable, because of the large sample sizes and careful study design. Even for very large studies, however, the amount of information collected is finite, and the number of hypotheses considered in the design must be limited. Moreover, although these large health-oriented surveys give an excellent picture of national trends, they are not always suited for extrapolation down to the local level. For example, NHANES may describe the distribution of body mass index at the national level, but the unique attributes of the population of any particular census tract preclude the direct application of NHANES results to understanding the health status of that tract's population. Recent developments in epidemiological methodology have highlighted the importance of smaller scale, neighbourhood-level factors as health determinants [Reference Borrell3–Reference Winkleby and Cubbin5]. Ordinarily, estimates of the prevalence of risk factors at the local level require direct sampling of that population. This estimation is done at great expense and the results cannot be generalized to other geographic areas. Existing methods for estimating disease prevalence or incidence in small-area units involve interpolation and smoothing and their associated limitations [Reference Kelsall and Wakefield6, Reference Lawson and Clark7].
Here, we describe a method of using the size and strengths of multiple large-scale population-based surveys to address such limitations. This is not an attempt to link individual records across databases, but rather to develop an understanding of disease using one dataset, then apply that knowledge to make inferences using another. Specifically, we used data from NHANES III to develop a model of demographic risk factors for Helicobacter pylori infection, then used data from the U.S. Census Bureau to estimate the prevalence of infection. The initial model was validated using an independent cohort, and the prevalence estimates were compared with the incidence rates of gastric cancer – a malignancy directly attributable to H. pylori infection [8–Reference Uemura11].
MATERIALS AND METHODS
Modelling H. pylori using NHANES III data
NHANES III (1988–1994), was conducted on a nationwide probability sample of about 33994 persons aged ⩾2 months, and was designed to obtain nationally representative information on the health and nutritional status of the population of the United States [Reference McQuillan, Gunter and Lannom2]. Serum samples from 7465 adults were tested for the presence of anti-H. pylori IgG antibodies [Reference Everhart12]. These samples were collected during the first phase of the survey, from 1988 to 1991. The presence of antibodies was tested using a commercial IgG ELISA with a sensitivity of 91% and specificity of 96%. For each individual, numerous demographics and health statistics were also collected, including age, race, ethnicity, country of birth and annual household income. A total of 6769 participants had complete data for these variables and were included in the analysis (Table 1).
Demographics of study populations
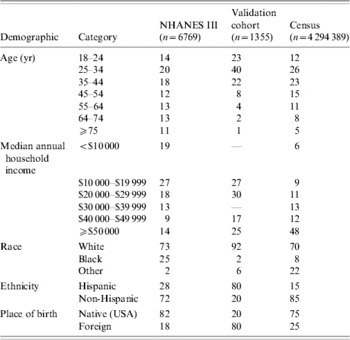
NHANES III, Third National Health and Nutrition Examination Survey.
Values are percentages.
Logistic regression was used to model the relationship between H. pylori infection status and demographic predictor variables. An individual was defined as H. pylori-infected if seropositive for H. pylori using a commercial IgG ELISA as described in the NHANES protocol [Reference Everhart12]. Testing of this assay against biopsy samples from 268 biopsy-confirmed patients with H. pylori and 105 patients without H. pylori revealed a sensitivity of 91% and a specificity of 96%. The logistic model used the five demographic risk factors of age, income, race, ethnicity and place of birth from the NHANES dataset, and also included two interaction terms: race×income and race×ethnicity. The five risk factors were selected a priori, being well-established risk factors for H. pylori infection. Interaction terms were added during the logistic modelling process. Marginal odds ratios for specific levels of each demographic predictor were calculated together with associated 95% confidence intervals (CI). Calculations were performed with SAS version 9 (SAS Institute, Cary, NC, USA).
Validation of the infection model
To validate the infection model, we predicted the infection status of members of a 1355-person cohort. As part of an ongoing community-based survey, individuals presenting at one of 17 medical clinics in the Silicon Valley (Southern part of San Francisco Bay Area, CA, USA) for acute gastroenteritis and members of their households completed a questionnaire and underwent IgG serological testing for H. pylori [Reference Perry13]. This essay was 91% sensitive and 98% specific for infection in adults [Reference Replogle14]. Acute gastroenteritis was clinically defined as loose or watery stool occurring ⩾5 times/day in a child aged <2 years or ⩾3 times/day in a person aged 2 years or at least one instance of vomiting in a person of any age. Demographic data collected included age, race/ethnicity, country of birth and annual household income. A probability of H. pylori infection was calculated for each individual using the model parameters derived from the NHANES III data. The model parameters were held fixed, and the logistic model was used in a predictive manner with cohort data as input. The expected number of infections for this cohort was calculated as the sum of these probabilities for the cohort and a receiver operating characteristic (ROC) curve was generated.
Applying census data to the infection model to estimate infection prevalence
To estimate the prevalence of infection, we first obtained a special tabulation of the 1990 U.S. Decennial Census. This dataset consisted of aggregate statistics for each county in the Silicon Valley area, stratified by age (seven categories), household income (six categories), race (three categories), ethnicity (Hispanic or non-Hispanic), and country of birth (United States or other). Categories were selected to match available NHANES III data. Only individuals aged ⩾18 years were included.
The aggregate census data were converted to individual profiles based on the categories used. As the census data was stratified in five dimensions, each cell was converted into the appropriate number of individuals with the five-dimensional profile of the cell. For example, aggregate data for San Francisco county might report a total of 500 for the stratification: native-born, non-Hispanic whites between ages 55–64 with income of $10 000–$19 999. Although this is an aggregate statistic, it can be converted into 500 individuals with the specified demographic profile. The nine counties in our study area yielded 4 294 389 individual profiles (Table 1).
In the same process as the validation cohort, a probability of H. pylori infection was calculated for each individual profile using the model parameters derived from the NHANES III data. The predicted prevalence of infection for a given county was calculated as the average of the infection probabilities for the region's population.
Correlation of estimated H. pylori prevalence and observed cancer incidence
In an ecological manner, the estimated prevalence of H. pylori was correlated with the incidence of several malignancies. Using the above methods, the prevalence of H. pylori was estimated for the nine counties that comprise the catchment's area of the Northern California Cancer Center's (NCCC) Greater Bay Area Cancer Registry (San Francisco, San Mateo, Marin, Alameda, Contra Costa, Santa Clara, Santa Cruz, Monterey and San Benito). From the NCCC, we obtained age-adjusted rates and case counts of leukaemia, gastric and oesophageal cancers for each county for the period 1988–1997. For gastric cancer, only non-cardia cases were included in the analyses. For oesophageal cancer, adenocarcinoma and squamous cell carcinoma were analysed separately. For each county, age-adjusted rates were calculated for the 10-year period using the 1990 Standard Million. This incidence rate of each cancer was used as the dependent factor in an ordinary least-squares regression, with the predicted prevalence of H. pylori infection as the independent factor.
RESULTS
The logistic regression using NHANES III data on H. pylori infection and demographic factors yielded odds ratios consistent with previous studies (Table 2). Increasing age, decreasing income, non-White race, Hispanic ethnicity and non-US place of birth were all associated with increased risk of infection. Everhart et al. [Reference Everhart12] previously described H. pylori prevalence and demographic risk factors in this cohort.
Odds ratios from logistic regression using NHANES III data with the outcome of H. pylori infection. (The model included two interaction terms: ethnicity×race and income×race.)

NHANES III, Third National Health and Nutrition Examination Survey.
OR, Odds ratio; CI, confidence interval.
* Denotes variables with interaction terms in the model.
When the NHANES III-derived logistic model was used to predict the infection status of a 1355-member cohort, the total number of infections predicted was 737·5, compared to an observed 736 infections, as determined by serology. This corresponds to a predicted prevalence of 54·4% vs. an observed prevalence of 54·3%. Subgroup analysis showed that the model tended to slightly overestimate the number of infections in subgroups associated with high risk of infection and slightly underestimate the number of infections in subgroups associated with low risk of infection (Table 3).
The area under the ROC curve was 0·69 (Fig. 1). The cutpoint with the best balance between sensitivity and specificity was 0·57. This cutpoint corresponded to a sensitivity of 0·62, specificity of 0·66, positive predictive value of 0·68 and a negative predictive value of 0·59.
ROC curve for validation dataset. Sensitivity and specificity refer to the prediction of H. pylori infection using demographic risk factors with serology as the reference standard. The black dot (●) represents the greatest balance between sensitivity and specificity. The area under the curve is 0·69.

When the NHANES III-derived logistic model was used in conjunction with 1990 census data, the predicted prevalence of H. pylori infection for the nine counties in the study area was about 36% on average (Fig. 2). Prevalence rates for the nine counties were normally distributed.
Map of study area. Percentages indicate the predicted prevalence of H. pylori infection in that county.

Using age-adjusted cancer incidence rates for each county derived from the registry of the NCCC, aggregated for the period 1988–1997, predicted H. pylori prevalence showed a positive correlation with gastric cancer incidence (P<0·001, R 2=0·87, Fig. 3). We observed a negative association with esophageal adenocarcinoma incidence, and a positive association with esophageal squamous cell carcinoma incidence, although neither were statistically significant (P=0·063 and P=0·051, respectively). There was no association between the predicted H. pylori prevalence and leukaemia incidence (P=0·56).
Regression plots of H. pylori and age-adjusted gastric cancer rates. Each open symbol (○) represents a county, with the size of the symbol proportional to the population of the county. The regression was weighted by population and has the equation: gastric cancer rate=−11·76+63·172×H. pylori prevalence.

We also compared gastric cancer incidence to H. pylori prevalence modelled using a subset of the risk factors included in the final model. While some models showed a stronger correlation (age, race, and Hispanic ethnicity, R 2=0·89), these models were less accurate at predicting the infection prevalence of the validation cohort (predicted 52·7%, observed 54·3%). The final model made the most accurate estimate of prevalence in the validation cohort and had one of the highest correlations with gastric cancer incidence. The simplest model with both a high R 2 and accurate estimate of prevalence included the two risk factors age and place of birth, with an R 2 of 0·52 and predicted prevalence of 56·5%.
Comparison of the predicted and observed numbers of infections using the NHANES III-derived infection parameter estimates and the validation dataset. Displayed are the predicted number of infections for each category and the observed number of infections with associated standard error (s.e.)

NHANES III, Third National Health and Nutrition Examination Survey.
DISCUSSION
The results of this study illustrate the capability of these methods to use large datasets to make prevalence estimates for small-area units. They were relatively simple to implement and provided excellent results, especially when considering the minimal investment required in obtaining them. We were able to replicate the results of previous studies using a small fraction of the resources they required. These methods offer the potential to use existing data sources to conduct novel epidemiological studies.
H. pylori has been designated a Group 1 carcinogen by IARC for its role in the development of gastric cancer, in part because of ecological studies demonstrating an association between the infection and cancer [15]. Our study replicated the results of previous work describing this ecological correlation [Reference Forman16, Reference Lin17]. Our methods, however, appear much more robust. These studies relied on using limited samples of individuals to represent very large areas. In one case, samples of fewer than 200 individuals represented entire countries [Reference Lin17]. In prior studies, the correlation between H. pylori and gastric cancer was modest, with an R 2 range of 0·12–0·34. In contrast, our analysis showed a far stronger correlation between H. pylori prevalence and gastric cancer incidence (R 2=0·87).
The model created using the NHANES III data was qualitatively consistent with previous studies, and was extremely accurate at predicting the prevalence of infection in the cohort. Given that this cohort was completely independent of the population used to derive the model parameters, as well as some stark demographic differences between the two groups (Table 1), the NHANES III-derived model can be considered highly effective for use in predictive analyses. Although our final model was the most accurate in predicting the prevalence of the validation cohort, it is worth noting that a model consisting of just age and place of birth was quite accurate in its prevalence estimates (56·5% predicted, 54·3% observed) and had a relatively strong correlation with gastric cancer (R 2=0·52).
We also found a negative correlation between H. pylori and incidence of oesophageal adenocarcinoma – a phenomenon reported in other studies [Reference de Martel18, Reference Ye19] – although this finding was not statistically significant. Similarly, there is some evidence that H. pylori (particularly CagA-positive strains) is positively associated with oesophageal squamous cell carcinoma [Reference Ye19]. We observed this association, but as with adenocarcinomas, the observed correlation did not meet the 0·05 standard for statistical significance. There is no compelling evidence that H. pylori is associated with leukaemia, and as expected, this study found no statistically significant association. Thus, our findings were specific and could not be construed to reflect factors related to carcinogenesis more generally. We found that although we could create models that yielded a higher R 2, their estimates of the infection prevalence in the validation cohort were not nearly as accurate as the final model.
Using existing data exclusively, we were able to estimate the prevalence of H. pylori infection and find a positive correlation with gastric cancer incidence. By structuring our model to match categories and risk factors available in the U.S. Census, it is possible to accurately estimate the prevalence of disease at any level of geography for which census data are available. These regions can be as large as states or counties, or as small as a census block group. Conducting a traditional epidemiological survey of disease prevalence at a scale as fine as a census block group for an area the size of even one county would be prohibitively expensive. Using a pre-fit risk model not only precludes the need to collect samples, but also should permit geographic portability – for example, the same study could easily be done with populations in New York, Texas or Iowa.
To develop our predictive model, we obtained risk parameters using a large national dataset. While many such studies are collecting an increasingly large set of variables, specific risk factors may not be present in these datasets, particularly those that do not have a well-established association with disease. Although we used a national dataset to maximize generalizability, it is not a strict requirement of the methodology – risk parameters can be fit using a dataset of any size.
Unlike some methods of applying national data to the local level, we are able to avoid the ‘ecological fallacy’ [Reference Piantadosi, Byar and Green20] – the potential for incorrect conclusions when extrapolating aggregate data to a more specific level (e.g. using national data to make inferences about counties). Although the census data was provided to us in aggregated form, the tables were stratified, allowing us to build individual profiles. The NHANES model was derived from individual-level data, and we applied individual profiles from census data, thus avoiding this concern.
With further development and validation, these methods could be used to conduct low-cost pilot studies, the results of which, although not definitive proof, would serve as evidence to justify more rigorous studies using traditional epidemiological methods. Once our estimates of infection prevalence were made for each county, it was relatively simple to compare prevalence with several different malignancies. The marginal effort to add additional analyses was negligible. While the association between H. pylori and gastric cancer is well-established, by using existing data, we could have conducted this study de novo and highlighted gastric cancer above all others as worthy of further investigation.
Although these methods offer quick estimates of prevalence, the results cannot be definitively confirmed without more detailed studies. The obligation to subsequently conduct these studies would eliminate the advantage of using this methodology. To inspire confidence in the results, the risk parameters of the predictive model should be extensively validated, as we did with an independent dataset. If surprising results do emerge, they may serve to justify more detailed studies. This type of analysis is not intended to supplant observational or experimental studies.
In addition to research, these small-area estimates of disease prevalence and incidence have applications in health services. The potential for a high level of geographic resolution could allow for improved targeting of outreach or service delivery programmes. The use of existing data would eliminate survey costs, leaving more resources available for interventions. This could be particularly beneficial for rural areas, which due to their geographic size and low population density are difficult to survey efficiently.
This methodology is not limited to analysis of H. pylori prevalence, although H. pylori may be particularly well-suited for this method, as it has well-established demographic risk factors. Any disease or condition that has strong demographic predictors could be modelled in this way. Other likely candidates include smoking and cardiovascular disease, and preliminary studies have shown that smoking may be particularly amenable to these methods. These results provide quantitative evidence that demographics can be used to predict disease, and we have demonstrated that existing datasets provide the information needed to estimate the prevalence of disease in a population.
DECLARATION OF INTEREST
None.


