Introduction
Criticism of the use of disease models to inform control policies during an outbreak is not uncommon. Several reports highlight the problems associated with using non-validated models to direct disease control during the outbreak of foot-and-mouth disease (FMD) that occurred in the UK in 2001 [Reference Kitching, Thrusfield and Taylor1, Reference Mansley2]. This experience serves as a salutary warning and reinforces the importance of careful model evaluation and active demonstration of model validity [Reference Kitching, Thrusfield and Taylor1]. Decision makers must have confidence in the reliability of model predictions if they are to be used to inform disease control policy. Confidence and clarity are particularly important during an animal disease emergency response when political pressures and scrutiny are highest [Reference Mansley2]. Recognising these issues, members of the Quadrilateral (Quads) Group of countries (Australia, Canada, New Zealand and the USA) together with other collaborators (UK, Ireland and The Netherlands) have engaged in joint studies comparing FMD simulation models. In the absence of detailed and accurate data from a range of epidemics that would allow external validation of model predictions, a process of multi-model comparison has been developed. This approach has been useful as a means of comparing models to not only ensure their internal validity, but also to assess model predictions for consistency and to provide confidence in outputs through a process termed ‘relative validation’ [Reference Dubé3–Reference Roche5].
Various modelling studies have shown that certain vaccination strategies may offer a benefit over standard stamping out (SO) approaches for FMD control and eradication in non-endemic countries [Reference Roche5–Reference Probert9]. Analyses of the recent, large-scale epidemics of FMD that occurred in Korea [Reference Sakamoto10] and Japan [Reference Akashi11] concluded that early adoption of vaccination enhanced the speed of disease control and eradication attempts.
Much of the recent FMD modelling work has focused on the use of vaccination in individual countries where farm demographics, movement patterns, response management and resources were fixed. Recent work by Porphyre et al. [Reference Porphyre12] showed that in Scotland there could be variability in the effectiveness of disease control strategies in different areas of the country, with vaccination being most effective in the southern counties where the risk of severe outbreaks is highest.
Despite indirect evidence of its potential value, the use of vaccination as a strategy for controlling FMD epidemics in non-endemic countries remains a contentious issue, with little consensus on when vaccination should be used, what factors might trigger its implementation and how resource availability (for example, constraints on the number of vaccine doses available and/or constraints on the number of personnel available to carry out a vaccination program) might impact on how quickly an FMD outbreak is brought under control. Decision makers also need to balance economic and socio-cultural factors, including economic effects, public opinion and the implications that vaccination use has on international market access. The outbreaks of FMD that occurred in Europe in 2001 provide a good example of this lack of consensus where, in the UK, farmer groups opposed vaccination, while on mainland Europe, The Netherlands showed little hesitation in employing a suppressive vaccination strategy [Reference Mansley2]. Lack of established precedents in individual countries around FMD control and eradication will inevitably result in delays in decision-making, which could potentially affect the utilisation and effectiveness of vaccination as an outbreak control option [Reference Mansley2, Reference Porphyre12].
Previous studies have demonstrated that key measures of the magnitude of an FMD epidemic (the total number of infected places (IPs), outbreak duration and geographical extent of the infected area) simulated with different modelling platforms were comparable when the models were parameterised to represent a defined FMD outbreak scenario [Reference Dubé3–Reference Roche5, Reference Probert9] In studies by Roche and et al. [Reference Roche5] and Probert and et al. [Reference Probert9], the relative effectiveness of specific vaccination strategies were assessed and similarities were identified when tested on a standardised FMD outbreak scenario set in the UK. Before general conclusions on the effectiveness of vaccination can be drawn, however, it is important to test whether the findings were specific to a given outbreak scenario or are consistent across a range of outbreaks in a range of countries.
The objective of this study was to use FMD simulation modelling to assess the relative gain in epidemic control afforded by augmenting SO with selected vaccination strategies, under different livestock demographics, production systems and movement patterns and country-specific policies and resourcing for control. Strategies were designed to quantify the impact of specific aspects of vaccine use in FMD outbreak management, including: the onset of the vaccination programme (timing), the types of farms vaccinated (all farms with susceptible species or cattle farms only), limiting vaccination to high-risk zones and the effect of constraints on vaccine resources.
Materials and methods
Outbreak scenarios
FMD modelling groups participating in the Quads collaboration as well as the UK were asked to select a study area within each of their respective countries with high farm and livestock densities. The rationale for this was that if vaccination was not effective under conditions most expected to favour the spread of FMD, it would be unlikely to be effective in other circumstances. Each of the modelling groups was then asked to define a plausible incursion scenario. Infection, with a Pan Asia O-type FMD virus, was introduced onto a single farm in each country's defined study area and an FMD outbreak scenario was selected as follows. Australia, the UK and the USA simulated a series of uncontrolled outbreaks (n = 100) in their chosen study area. Outbreaks were simulated for 21 days following the date on which the first farm was infected, to produce a 21-day ‘silent spread’ phase of an outbreak. Using the results of this set of simulations, an iteration at or above the 90th percentile for the number of infected farms at the end of the silent spread phase was selected. New Zealand ran 100 iterations of their model for 21 days with standard detection and SO controls and selected an iteration using the 90th percentile of the number of infected farms at the end of the 21-day period. For Canada, 100 iterations were run to eradication using a standard SO approach and an iteration close to the 90th percentile in terms of the total number of infected premises was selected (Table 1).
Table 1. Model platform, details of outbreak scenario and details of transmission pathways used for simulated outbreaks of foot-and-mouth disease in each country

a Transfer of disease from one location to another via humans, contaminated products, non-susceptible animals and equipment, vehicles and other fomites.
b Transfer of disease to locations within 3 kms of an infected farm, where the actual source of the infection is not known.
The selected ‘silent spread’ iteration for each country was then used to generate a standardised starting situation for the subsequent vaccination scenario simulations. This approach fixed the silent spread phase to a single (severe) outbreak scenario for each country and therefore removed the variability associated with disease transmission during the pre-detection phase. All subsequent modelling began by simulating forward from the day of first detection (Table 1). For each country, disease control measures started on the day of detection.
Each of the modelling teams used details of their own farm and livestock populations (Table 2) and their own estimates of FMD spread parameters that would apply in the respective study areas (Table 1). Control measures were modelled according to each country's FMD contingency plans (Table 3). Response capacity and resource limitations were country-specific (Table 3).
Table 2. Livestock population and production systems and the number of farms by farm type (mean number of FMD susceptible animals per farm) used in each of the simulated outbreaks of FMD in each country
a NZ dairy farms category includes milking and grazing dairy farm categories.
b UK dairy farms category may have beef cattle present.
c US dairy farms category includes small dairy and large dairy categories.
d US beef farms includes cow-calf (large), cow-calf (small) and stockers farm categories.
e UK sheep farms category is split into upland and lowland sheep farm types and may have pigs present.
f US sheep farm category includes both sheep and goat farms.
g New Zealand pig farm category includes pig breeder and pig finisher production types.
h US pig farms includes swine (large) and swine (small) categories.
i UK mixed farms category is split into lowland dairy mixed, lowland beef mixed, upland dairy mixed, upland beef mixed.
j US feedlot farm type includes company feedlot, stockholder feedlot, custom feedlot and yearling-pasture feedlot.
Table 3. Stamping out control measures, response capacity and resource limitations for simulated outbreaks of foot-and-mouth disease in each country
a DCP: Dangerous contact premises. A premises identified as high risk of having been exposed to infection through tracing of a direct or high-risk indirect movement.
Disease spread models
The FMD modelling platforms used were, AusSpread (AS) [Reference Garner and Beckett13–Reference Beckett and Garner15], InterSpread Plus (IS+) [Reference Stevenson16], Exodis FMD [17] and the North American Animal Disease Spread Model (NAADSM [Reference Harvey18]). InterSpread Plus was used by both Canada and New Zealand. The modelling platforms are all stochastic, spatial, state-transition simulation models which have been developed to simulate FMD transmission and control. Descriptions and operational details of these models are available in each of the references cited above. Roche et al. [Reference Roche5] provides a comparison of each of the four models.
Control strategies
Six control strategies were compared: a baseline SO strategy and five strategies where vaccination was used in addition to SO (VS1-5). Details of each of the control strategies are provided in Table 4.
Table 4. Details of the five vaccination control strategies for the simulated outbreaks of FMD in each country
a USA: no sheep or goat vaccination for any strategies.
b Vaccination applied outside in for all strategies.
c Vaccination team resource limits specific to each country as defined in materials and methods.
d This is a country-specific definition as defined in materials and methods.
e Number of vaccination doses and vaccination teams unlimited.
Suppressive vaccination was applied outside-in, in 3 km radii rings around new IPs and those IPs identified up to 5 days before the start of vaccination. For Australia, the UK and the USA, vaccination was also applied around farms identified as dangerous contact premises.Footnote 1 Vaccination commenced either 10 days (VS1, VS5) or 17 days (VS2, VS3, VS4) into the control program. All species (cattle, deer, small ruminants and pigs) on all farms were vaccinated, except for the VS3 strategy in which farms classified as predominantly cattle were targeted, although all species were vaccinated on these farms if other species were present. In the USA no small ruminant vaccination was carried out for any of the strategies. Resource estimates for vaccination are listed in Table 3. These applied to all scenarios except for VS5 which had an unlimited number of vaccination teams. Vaccine doses were unlimited except for strategies VS1-4 of the Canadian model where the available doses were constrained at 250 000 based on realistic estimates given vaccine bank arrangements at the time of the study.
Vaccination was used in all infected areas except for VS4 in which vaccination was applied to high-risk areas only. The high-risk areas selected for vaccination were specified by each country and were defined as follows:
• Australia: High-risk areas were based on tertiary administrative areas representing the high density, dairying areas in the state of Victoria (R. Paskin personal communication). Three separate high-risk areas in the south-east, south-west and north of Victoria were selected (Fig. 1).
• Canada: The locations of all livestock farms in the province of Alberta were used to create a point location map. The area with the highest density area of livestock farms was identified and used as a zone for vaccination in the model (Fig. 1).
• New Zealand: The point locations of all dairy farms derived from the national farm database AgriBase [Reference Sanson and Pearson19] were used to create a kernel smoothed density map of dairy farms. Two high-density areas were identified within the Waikato and Taranaki regions as having ⩾0.4 dairy farms per km2 (Fig. 1).
• The UK: High-risk areas were selected on the population density of susceptible species. The smallest spatial unit of resolution used was the county. Counties containing the highest density of cattle, sheep or pigs were selected as high risk. The data used to calculate the density of animals were based on agricultural census figures for June 2010 (Fig. 1).
• The USA: High-risk areas were based on counties representing the intensive dairying areas. The number of dairies (large and small) per 15 km2 was calculated for each county, and counties at or above the 90th percentile were designated as high-risk areas (Fig. 1).
Fig. 1. Map of each country and study area enlargement where applicable. The study area for Australia was the State of Victoria, for Canada the Province of Alberta, for New Zealand and UK the study area was the entire country and for the USA the study area included the states of Colorado, Kansas, New Mexico, Oklahoma, Arkansas, Texas and Louisiana. Grey shading identifies the high-risk areas within the study areas selected for vaccination under VS4. In each map the location of the primary case farm is indicated by a black star.
For each strategy, 100 iterations of each model were run. Each iteration was run until FMD was eradicated. The following outputs from each iteration of each model were recorded: the total number of IPs, the spatial distribution of IPs (that is, the easting and northing coordinate of each IP) and outbreak duration. Outbreak duration was defined as the number of days from the start of the control programme until the last case was detected plus 21 days, as it was assumed it would take 21 days following the last case to complete all depopulation, disposal and decontamination activities. The numbers of animals and farms vaccinated for each iteration were also recorded.
Parameters associated with disease spread and the implementation of baseline SO control measures for each country are provided in Tables 2 and 3, respectively.
Statistical analyses
Descriptive analyses
The predicted total number of IPs, outbreak duration and vaccine usage for each iteration for each scenario for each country were tabulated (Tables 5 and 6). For each country, the predicted total numbers of IPs and outbreak durations for all of the vaccination strategies were pooled and compared with the same measures for the SO strategy alone using the Wilcoxon (Mann–Whitney) rank-sum test [Reference Wilcoxon26, Reference Mann and Whitney27].
Table 5. Descriptive statistics of the predicted number of infected premises and outbreak duration for the stamping out strategy and each of the five vaccination control strategies, by country
a A positive percentage indicates deterioration in outbreak measure relative to baseline (SO).
Table 6. Results of the predicted number of farms vaccinated and animals vaccinated for the vaccination control strategies used in a simulated outbreak of foot-and-mouth disease in five countries
a Vaccine doses were artificially constrained at 250 000 for VS1-4 for each of the Canadian models.
To generate the graphical outputs (Fig. 2), the median number of IPs for each vaccination strategy for each country was calculated and then rescaled to a number between 0 and 1 by subtracting the value for the lowest median number of IPs and dividing the result by the difference between the largest and smallest medians across the strategies for that country [Reference Probert9]. With rescaling, the best performing control strategy within each country (i.e. the control strategy with the smallest number of IPs) had a score of 0 and the worst had a score of 1. The median outbreak duration and the median number of animals vaccinated for each scenario from each country were scaled using a similar procedure. The scaled median number of IPs for each strategy from each country was then plotted against the scaled median duration and scaled median number of animals vaccinated. This allowed the performance of each control strategy to be compared across a range of response objectives, independent of the raw numerical output of the simulations (Fig. 2).
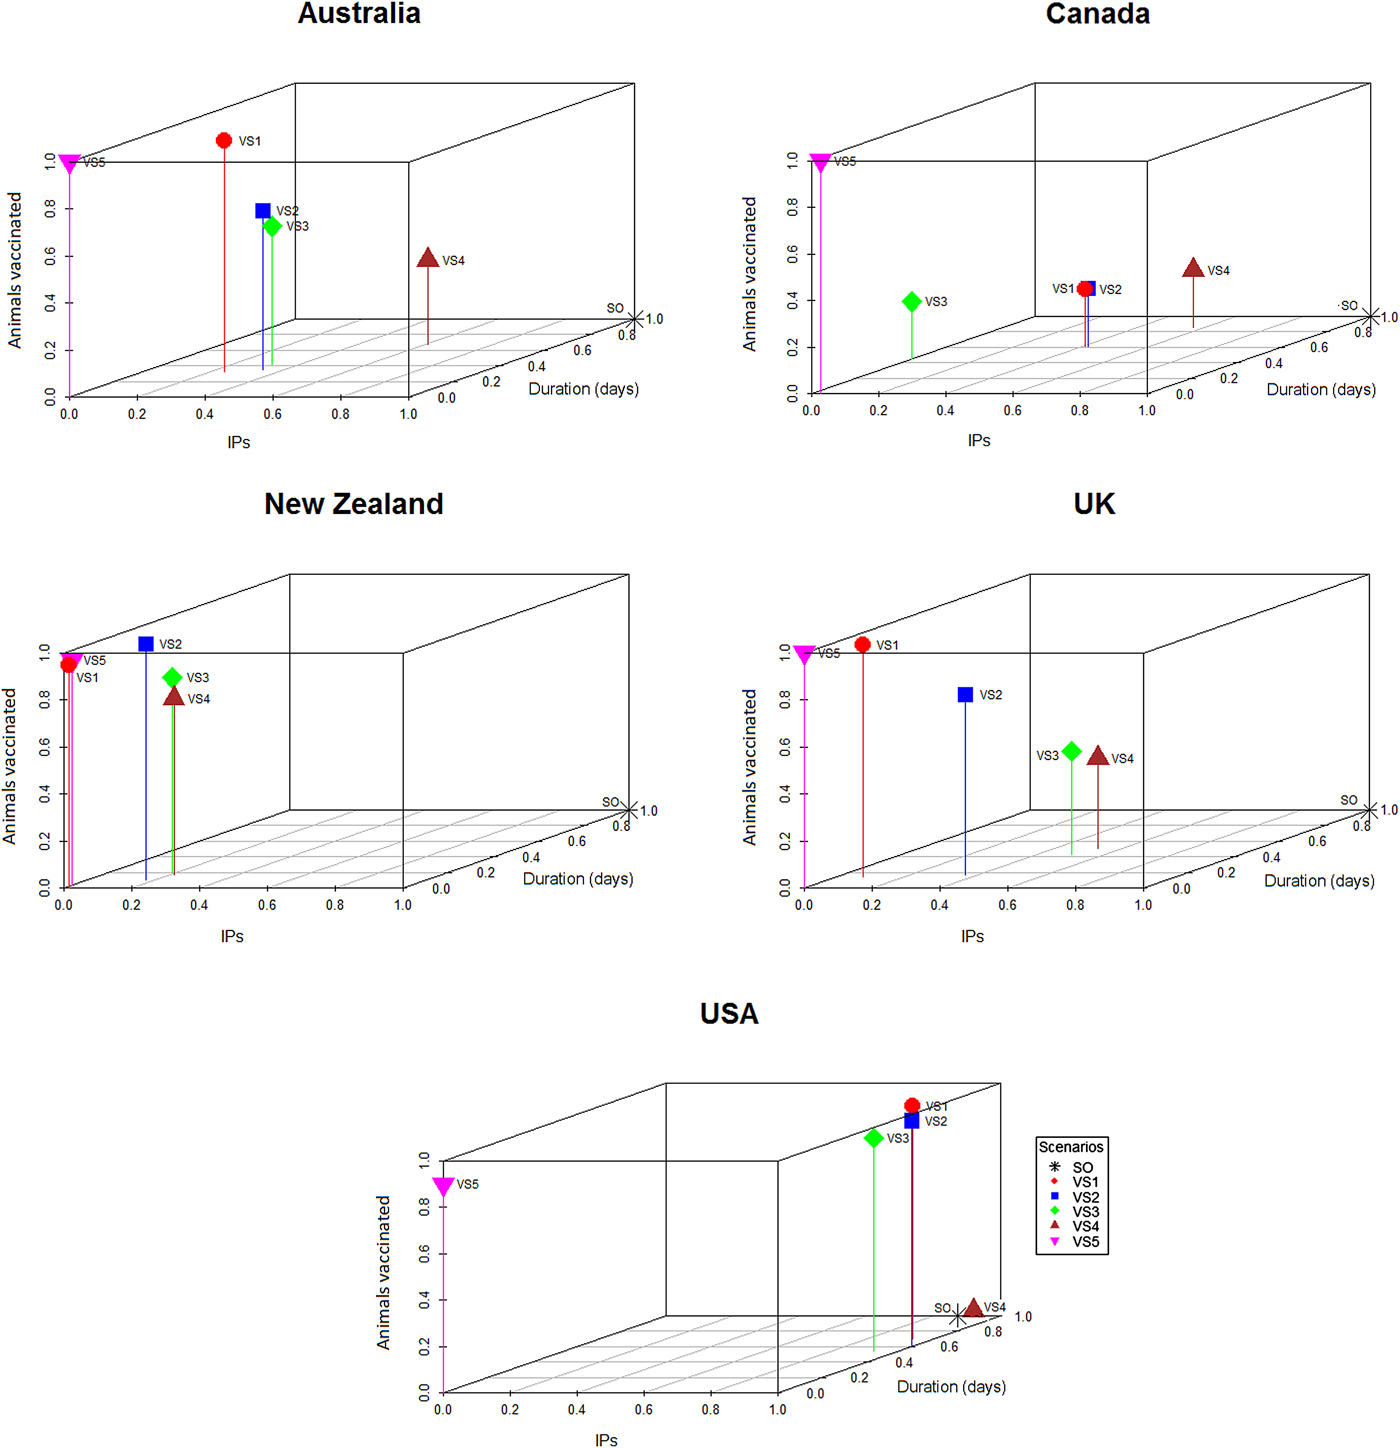
Fig. 2. Three-dimensional scatter plots showing the median number of IPs and median outbreak durations generated by the stamping out and vaccination strategies (Table 4) against the median number of doses used for the respective strategy within each country. The medians were scaled to lie between 0 and 1 within each country, so that the worst control strategy has a score of 1 and the best a score of 0 within each country.
Multivariable analyses
Frequency histograms were plotted to confirm the total number of IPs and outbreak duration data were consistent with the Poisson distribution. For each country-scenario combination, the variance of the outcome was greater than the mean, indicative of overdispersion and justifying a decision to use a negative binomial model for the data. We defined y i as the outcome variable (the predicted total number of IPs for the ith iteration) and set the mean and variance of y i for the negative binomial as E(y i) = μ i and  ${\rm var}(y_i) = \; \mu _i + \; \kappa \mu _i^2 \; $ where κ is a dispersion parameter. The mean of the negative binomial regression model is given by:
 $$\mu _i = {\rm exp}(\beta _0 + {\rm \;} \beta _1x_{1i} + \cdots + \; \beta _mx_{mi}\; + \; \epsilon _i)$$
In Equation 1, β 0 represents the intercept term and β 1 · · · β m the estimated regression coefficients for the m explanatory variables included in the model. The explanatory variables included in each model were: (1) timing of vaccination (a categorical variable with two levels: vaccination start at 10 days and vaccination start at 17 days), (2) species (a categorical variable with two levels: farms with cattle and farms with any susceptible species), (3) area (a categorical variable with two levels, high risk areas and all areas) and (4) resources (a categorical variable with two levels: standard resources and unlimited resources). Country (a categorical variable with five levels) was included in each model as a fixed effect. To start, all explanatory variables were included in the model. Explanatory variables that were not statistically significant were removed from the model one at a time, beginning with the least significant, until the estimated regression coefficients for all explanatory variables retained were significant at an alpha level of less than 0.05. Model fit was assessed by likelihood ratio tests between successive models as each variable was removed and between the final model and an intercept-only model.
A multiple linear regression model was developed to quantify the association between each of the explanatory variables that varied in the different vaccination strategies and outbreak duration, with the country as a fixed effect. Similar to the approach described above, a backwards stepwise elimination approach was used to identify explanatory variables significantly associated with outbreak duration. Model fit was assessed using the R 2 value and the overall F-statistic. All statistical analyses were conducted in R version 3.3 [28].
Results
Descriptive statistics of the predicted number of IPs, predicted outbreak duration (in days) and the predicted number of farms and animals vaccinated by strategy and country are shown in Tables 5 and 6, respectively. The proportional reduction in the median outbreak measure, relative to the median for that country's SO strategy are provided in Table 5. Figure 2 is a three-dimensional line plot showing the relationship between the scaled median number of IPs, scaled median outbreak duration and the scaled median number of animals vaccinated for each of the vaccination strategies from each country.
In all countries vaccination significantly reduced the predicted number of IPs (Z = 2.045–12.745, P = 0.041 to <0.01) and outbreak duration (Z = 4.201 to 13.614, P < 0.01) compared with SO alone. The reduction in the mean predicted number of IPs for the most effective vaccination strategy in each country, relative to the mean predicted IPs for SO alone varied between 20 and 64%. Similar figures for outbreak duration ranged between 13 and 49% (Table 5).
All models predicted larger numbers of IPs when vaccination started at 17 days post-detection (VS2), compared with vaccination starting at 10 days (VS1), Table 5. The reduction in the mean predicted number of IPs for vaccination start at 10 days (VS1) in each country relative to the mean predicted IPs for delayed vaccination (VS2) varied between 0.4 and 14% (Table 5). The timing of vaccination was retained in the final negative binomial regression model for the predicted total number of IPs (Table 7). In this model, starting vaccination at day 17 increased the predicted total number of IPs by a factor of 1.11 (95% CI 1.07–1.14) compared with starting vaccination at day 10 (Table 7). Differences in outbreak duration for day 10 and day 17 vaccination start were less consistent and of lower magnitude (Table 5). Day of vaccination start was not retained in the final multiple linear regression model for outbreak duration (Table 8).
Table 7. Estimated regression coefficients and their standard errors from a negative binomial regression model of variables associated with the predicted number of infected places from four FMD simulation models
a Interpretation: compared with a vaccination start at 10 days after the date of first detection and after controlling for the effect of other variables included in the model, vaccination start at 17 days after the date of first detection was associated with a 1.11 (95% CI 1.07–1.14) times increase in the predicted number of infected places.
Table 8. Estimated regression coefficients and their standard errors from a multiple linear regression models of variables associated with predicted outbreak duration (in days) from four FMD simulation models
a Interpretation: compared with a vaccination of all areas and after controlling for the effect of other variables included in the model, vaccination of high risk areas only was associated with a 8 (95% CI 5–10) day increase in outbreak duration.
When vaccination was restricted to cattle farms (VS3), the predicted median number of IPs and outbreak duration were similar to the correspondingly timed all farm vaccination strategy (17-day vaccination start, VS2; Table 5). Species vaccinated was not retained in either of the two regression models (Tables 7 and 8). Limiting vaccination to high-risk areas within each country (VS4) had a consistent negative impact on the total number of IPs or outbreak duration compared with the comparably timed strategy (17-day vaccination start, VS2) applied to all areas (Table 5). The predicted median number of IPs and outbreak duration for VS4 were higher for four of the five countries. Area vaccinated was retained in each of the two regression models (Tables 7 and 8). Vaccinating high-risk areas only increased the total number of IPs by a factor of 1.06 (95% CI 1.03–1.10) and outbreak duration by 7.6 days (95% CI 5–10 days), compared with vaccination of susceptible species in all areas.
For most countries, the best performing vaccination strategy was VS5 in which there were no constraints on vaccine deployment (Fig. 2). Unconstrained resources for vaccination was significantly associated with a reduction in total IPs in the negative binomial regression model (Table 7). In the final negative binomial model, unrestricted vaccination resource decreased the total number of IPs by a factor of 0.90 (95% CI 0.87–0.94) compared to a standard vaccination resource strategy. Similar findings were identified for outbreak duration, with resource availability retained in the final multivariable linear regression model (Table 8). The range in reduction in the mean predicted number of IPs and outbreak duration for unrestricted vaccination in each country relative to the comparably timed resource restricted strategy (VS1, 10-day vaccination) was −5 to +21% and −3 to +16%, respectively (Table 5).
The majority of countries predicted the smallest numbers of farms and animals vaccinated for the risk-targeted strategies (VS3 cattle farms only, VS4 high-risk areas only). For Australia, New Zealand and UK, VS3 achieved a reduction in the predicted median number of farms and animals vaccinated of between +20 to +54% and +13 to +55%, respectively. The USA reported a marginal increase in the number of farms and animals vaccinated of +1% and +2%, respectively (Table 6). We note that Canada has been excluded from these comparisons because the number of vaccine doses was constrained at 250 000 cattle doses for VS1-4.
Discussion
This study builds on findings from earlier research using FMD outbreak scenarios in the UK [Reference Roche5] to assess the effect of vaccination on large outbreaks of FMD using five simulation models. Previously, various vaccination strategies were tested within the framework of a multi-model comparison study, with findings providing confidence in both the internal validity and consistency of predictions generated by different modelling platforms [Reference Dubé3–Reference Roche5]. Other researchers have demonstrated the importance of different startup conditions, particularly location-specific factors such as animal density, contact networks and farm-level reproductive number to achieve success using vaccination as a means for controlling an outbreak of FMD [Reference Porphyre12]. On the strict assumption that each of the simulation models in this study provide valid estimates of the likely outcomes arising from an incursion of FMD into the respective countries in which they are deployed, the findings from this study will assist decision makers by highlighting consistent patterns in the relative effect of vaccination approaches that outperform SO alone. The findings provide direction regarding key decisions faced by response managers, including the timing of vaccination, application of risk-targeted strategies and vaccine resource requirements.
This study assessed control strategies for large outbreaks representing a 90th or 95th percentile incursion into an area with relatively high livestock densities. Hence, they represent relatively severe outbreak scenarios, only relevant to the consideration of risk associated with large FMD outbreaks. A number of other studies have failed to show a benefit of vaccination over stamping-out alone for FMD control [Reference Backer6, Reference Tomassen29, Reference Durr30]. A notable feature of these studies was that the outbreaks that were simulated were relatively small and/or involved low-density livestock populations. Similarly, other researchers [Reference Backer6, Reference Porphyre12, Reference Traulsen31] have demonstrated variability in the effectiveness of vaccination strategies associated with the geographic region in which the outbreak occurred and the characteristics of the index farm. Also, Roche et al. [Reference Roche14] found that using current estimates of human resource capacity for surveillance and infected premises operations in Australia, FMD outbreaks were effectively controlled using a SO strategy. However, under more constrained resource allocations, ring vaccination was likely to achieve eradication faster than SO alone or pre-emptive culling.
Consistent with other studies [Reference Roche5, Reference Porphyre12, Reference Traulsen31, Reference Sanson32], early vaccination was associated with a significant reduction in the total number of IPs, although the relative reduction was small for most countries except the UK and New Zealand. The relative reduction in outbreak duration followed a similar pattern, although this was less marked across all countries. This was not unexpected given the short time period differential (a 10-day vaccination start vs. 17-day vaccination start) chosen for this study. Nevertheless, our results support previous studies and outbreak findings [Reference Sakamoto10, Reference Akashi11] that highlight the gains to be achieved from an early decision to vaccinate. Further studies to help understand the early predictors of large-scale outbreaks would assist decision makers when considering additional disease management strategies such as vaccination [Reference Garner33, Reference Willeberg34].
We tested two risk-based vaccination strategies, the first compared vaccination of all farms vs. carrying out vaccination only on those farms with cattle (with all FMD susceptible species vaccinated on those farms). Vaccinating cattle farms (alongside SO) out-performed SO alone in all countries. The reductions in the predicted number of IPs and outbreak durations achieved were generally of a lower magnitude compared to vaccinating all farms. However, cattle farm only vaccination was not retained in either of the multivariable models and our inference is that vaccinating animals on farms with cattle was not inferior to vaccinating all farm types. Other studies [Reference Roche5, Reference Porphyre12, Reference Keeling35] have identified the effectiveness of cattle-only compared with all species vaccination, although these studies are not directly comparable with the study described in this paper. The second risk-based vaccination strategy limited vaccination to high-risk areas. High-risk areas were specified by each country, being pre-determined by the veterinary authorities based on expert knowledge and regional attributes such as the density and species of livestock present. Although limiting vaccination to high-risk areas out-performed SO alone, the impact was significantly lower compared with vaccination strategies that included all areas.
In this study, high-risk zones were chosen based on local knowledge of regional attributes including farm types and animal density. Other researchers have determined that although livestock density is an important characteristic affecting FMD spread, simply identifying areas of high livestock density does not capture the required complexity to inform decision making around control strategies. Porphyre et al. [Reference Porphyre12] found that the intrinsic characteristics of the virus strain is likely to have an important influence on local spread and thereby the farm-level reproduction number and shape of the transmission kernel function. Hence, identifying high-risk zones for targeted vaccination requires knowledge of how the characteristics of the incursion virus strain interact with the underlying population of animals at risk and contact networks to produce a defined transmission kernel [Reference Jewell, Keeling and Roberts36, Reference Morelli37]. Risk-based vaccination strategies are clearly an important area for future study.
If risk-based vaccination programmes, such as cattle-only or high-risk area vaccination, can be shown to be equally effective as all species or all area vaccination, there could be substantial benefits as less vaccine is required, less resource is required to carry out the vaccination strategy, fewer animals are vaccinated and post-outbreak surveillance effort is reduced. The ability of cattle only vaccination to reduce the number of animals vaccinated will, however, depend on the production systems and livestock demographics of the outbreak area.
The capacity to implement vaccination was variable between countries. Not surprisingly, we found that the strategy in which vaccination teams and vaccine supply were unlimited out-performed all other strategies in the majority of country settings (Fig. 2, Tables 7 and 8). In reality, resources are always finite and the effectiveness of any control strategy will depend greatly on the availability of adequate resources required to implement it. The benefits of carrying out rapid and effective vaccination are demonstrated here, consistent with other FMD vaccination modelling studies [Reference Traulsen31, Reference Sanson38]. Equally important is maintaining high SO efficacy, to minimise the interference of vaccination resource requirements with other response activities, including surveillance, tracing, depopulation and disposal [Reference Sanson38]. When comparing resource requirements for the risk-based vaccination strategies (cattle farms only, high-risk area vaccination), considerable savings in the number of farms and animals vaccinated were achieved (Table 6), which is an important finding in the context of a sometimes comparable performance in bringing the outbreak under control. Assessing the influence of vaccination personnel resources on vaccination efficacy across a variety of incursion scenarios and determining the optimal personnel resource availability, are important focus areas for outbreak preparedness [Reference Roche14].
A decision to deploy vaccination poses significant challenges during the early stages of an outbreak given the considerable uncertainty and often competing objectives. Techniques such as adaptive management, which apply structured decision-making processes to include uncertainty when solving dynamic problems [Reference Shea39] create a rational basis for evaluating different disease intervention strategies. Assisting decision making by clearly defining the objectives of a disease control programme is also fundamental to success [Reference Probert9]. Hence, the objectives along with the metrics used to measure these objectives, need to be clearly understood and decided from the outset. In the context of an FMD outbreak, the decision to vaccinate early is complex given the uncertainty of success and the challenge of defining appropriate objectives. The decision is multidimensional, incorporating the direct benefits associated with bringing the epidemic under control, but must also consider the economic, social, cultural and political implications, across a spectrum of stakeholder groups. The macro-economic benefits of reduced outbreak sizes and earlier eradication also need to be understood in the context of important policy decisions regarding how vaccinated animals will be managed at the end of the outbreak.
Currently, under the OIE guidelines, requirements to regain free status after emergency vaccination differ. Under a ‘vaccinate-to-retain’ policy a country can only regain FMD-freedom 6 months after the last case and after surveillance on all vaccinated animals has been completed and confirmed no evidence of circulating FMD virus. This strategy also adds considerable logistical complexity to the post-outbreak phase, including the management of vaccinated animals and surveillance for substantiating freedom from virus circulation. On the other hand, ‘vaccinate-to-remove’ is considered lower risk, so countries can regain disease-freedom 3 months after culling all vaccinated animals [40]. The macro-economic benefits of vaccination may increase significantly if proposals to align the time requirement for regaining FMD-freedom after vaccination, are achieved. Although this study focused on two key measures (objectives) of outbreak success, it is important to recognise the trade-offs incurred by the choice of either a vaccinate-to-retain or vaccinate-to-remove policy. Estimating the number of livestock that would be vaccinated (which equates to the extra animals required to be culled under a ‘vaccinate-to-remove’ policy), in the context of the competing objectives around minimising outbreak duration or the total number of IPs is illustrated in Figure 2.
As animal health authorities give serious consideration to vaccination as a tool to support FMD control and eradication in non-endemic countries, interest in testing vaccination strategies in a modelling environment has grown. With this study, we compared strategies in multiple country settings to provide insights around key decisions, including the timing of vaccination, risk-targeted approaches and resource requirements. It is reassuring that despite differences in production systems, livestock demographics and control measures between countries and the use of different modelling platforms, there was consistency in the relative effectiveness of the vaccination strategies tested here. An indication of vaccination strategies that outperform SO alone and are robust to different startup conditions, are extremely useful to support response policy development.
It is important, however, to appreciate that model outputs are not standalone. When informing disease management, findings must be evaluated along with relevant veterinary and livestock sector expertise. It is also important to appreciate that while vaccination may have benefits in terms of achieving disease control objectives, keeping vaccinated animals in the population will delay the period until FMD-free status is regained under OIE guidelines [40] and adds logistical complexity to the post-outbreak management phase. Thus, vaccination carries with it additional operational demands and uncertainty around the period to return to international trade.
Acknowledgements
We thank Neil Harvey (Cardboard Robot Software Inc.), Andre van Halderen (New Zealand Ministry for Primary Industries) and Sam Hamilton (Australian Department of Agriculture and Water Resources) and numerous personnel from Alberta Agriculture and Forestry, for their valuable technical advice and input on modelling and disease control policy throughout this project.
Financial support
This research received no specific grant from any funding agency, commercial or not-for-profit sectors. Each of the five countries participation was made possible by core government-funded activities to facilitate and improve emergency animal disease outbreak preparedness and response.
Conflict of interest
None.