


Introduction
Since 1950, there has been a decline in the number of tuberculosis (TB) notifications in Ireland. The rates have steadily decreased since 1991 from 18.2 to 6.6 per 100 000 population in 2015 [1]. The highest rates have been noticed in the Health Service Executive (HSE) areas in the east (HSE-E) and south (HSE-S) [1]. Males and persons aged 65 years and older have higher rates [1]. Migration patterns have affected TB rates in Ireland as foreign-born cases in 2015 accounted for 42.6% of notifications [1]. Two large TB outbreaks were reported in 2007 and 2011 [2, 3].
The World Health Organization (WHO) has set a goal to eliminate TB by 2050, which is defined as a TB incidence rate of less than one sputum smear-positive case per 1 000 000 population [4]. In Ireland, this would correspond to four to five new sputum smear-positive cases per year [4]. To assist in achieving that, an effective TB surveillance system and a good TB control programme should be in place.
In Ireland, enhanced TB surveillance data have been collected since 1998. In 2000, an Epi Info™/MS-Access-based national TB surveillance system was developed at the Health Protection Surveillance Centre (HPSC). This system was operated regionally and data were collected in paper format, entered into an Epi Info™ database. Electronic files were sent quarterly to HPSC where they were collated and validated in MS-Access. This system was called the National TB Surveillance System (NTBSS) [Reference Smith5]. Since 2011, the TB-enhanced surveillance system has been incorporated into the Computerised Infectious Disease Reporting System (CIDR), a web-based system on a secure network, which is available nationwide to the departments of public health, public hospital laboratories and HPSC and which aims to improve the surveillance of all notifiable diseases [6]. CIDR holds all case-based infectious diseases and integrated clinical and laboratory data [7, 8].
CIDR was used for TB surveillance to help improve data completeness, timeliness and flexibility for users but it was never evaluated. In addition, a comparison between NTBSS and CIDR has never been measured. There is very limited literature on the comparison between integrated electronic and non-centralised paper-based surveillance systems and most are not recent [Reference Ward9–Reference Panackal11].
The aim of the current evaluation was to assess the Irish national electronic TB surveillance system in terms of completeness, timeliness, simplicity, flexibility and usefulness and compare it with the old non-centralised system (NTBSS) in order to identify the areas of improvement that would support interventions ultimately aimed at TB elimination in 2050.
Methods
We followed the guidelines for evaluating public health surveillance systems developed by the European Centre for Disease Prevention and Control and the US Centre for Disease Control and Prevention [12, 13]. For the current evaluation, only variables existing in both systems were compared in terms of completeness and timeliness. Data were available for the years 2002–2015, and the statistical analysis was conducted in STATA 14.1® [14].
The completeness of key variables was assessed by examining field completion (percentage of blank responses). We exported the 2002–2010 data from the MS-Access database and 2011–2015 data from CIDR. We assessed data completion for both core (basic data collected on all notifiable diseases) and enhanced variables. The χ 2 test was used to determine the significance of proportions of completed data fields in each system.
To assess the timeliness of the systems, we calculated the time interval between the date of diagnosis and the date of notification to the system. Median time intervals for completed records were calculated and expressed with an interquartile range (IQR). The distribution of time intervals between both systems was compared using the Wilcoxon rank-sum test after being tested for normality with the Shapiro–Wilk W test.
All data exported from NTBSS were imported into the MS-Access database where they were validated and stored. The validation process was manual and included logical checks based on completed data that helped to fill missing values. For that reason, only validated NTBSS data were available for this evaluation. The CIDR data were also imported into the same MS-Access database and validated on an annual basis; for our analysis, we used the crude data exported from CIDR. In an effort to cross-validate our results, we also conducted the same analysis using the MS-Access validated data for both systems and compared the results with the initial analysis.
The attributes of simplicity, flexibility and usefulness were evaluated by creating an online questionnaire (on Demographix®). The questionnaire included multiple choice questions with responses measured using a Likert scale. We sent the questionnaire to all public health staff in Ireland who enter or use TB data in CIDR, some of whom had also used the NTBSS. A descriptive analysis of the results was conducted.
Results
There were 4007 TB notifications before and 1776 after the introduction of CIDR. Completeness of core questions was higher in the NTBSS system but variable for enhanced questions (Table 1). There was no significant difference in completeness for most core demographic variables. The variable ‘organism’ was more complete in CIDR but date variables were more complete in NTBSS. The completeness of the variable indicating the cause of death was very low in CIDR compared with NTBSS. When comparing the validated data at both systems in MS Access, the completeness of this variable significantly improved but did not change for the remainder variables (Table 2).
Table 1. Completenessa of core and enhanced variables in NTBSS (2002–2010) and CIDR (2011–2015)
a The highest percentage of completeness is highlighted in bold for each variable.
Table 2. Completenessa of core and enhanced variables of the validated MS-Access data before (2002–2010) and after (2011–2015) the introduction of CIDR and significance of their differences
a The highest percentage of completeness is highlighted in bold for each variable.
The completeness of enhanced demographic variables was higher in NTBSS compared with CIDR (Table 1). Variables on risk factors and vaccination were significantly more complete in NTBSS, but the completeness of the variable on HIV status was better in CIDR. The variables on the chest x-ray results and on diagnosis were more complete in NTBSS but completeness of diagnosis improved in CIDR after the data validation (Table 2). Variables for histology and culture were more complete in NTBSS. On the other hand, all variables related to drug sensitivity and laboratory testing after treatment initiation (follow-up) were significantly more complete in CIDR (Table 1).
The time interval between diagnosis and notification to the system significantly increased after the introduction of CIDR from a median of 3 days (IQR: 0–11) to 4 days (IQR: 1–12) (Wilcoxon rank-sum rest P < 0.001) indicating more delayed notification time. Figure 1 shows the medians and IQRs of the time interval between diagnosis and notification of TB by HSE area for both NTBSS and CIDR. For most areas, the median time from diagnosis to notification seemed to increase after the introduction of CIDR.
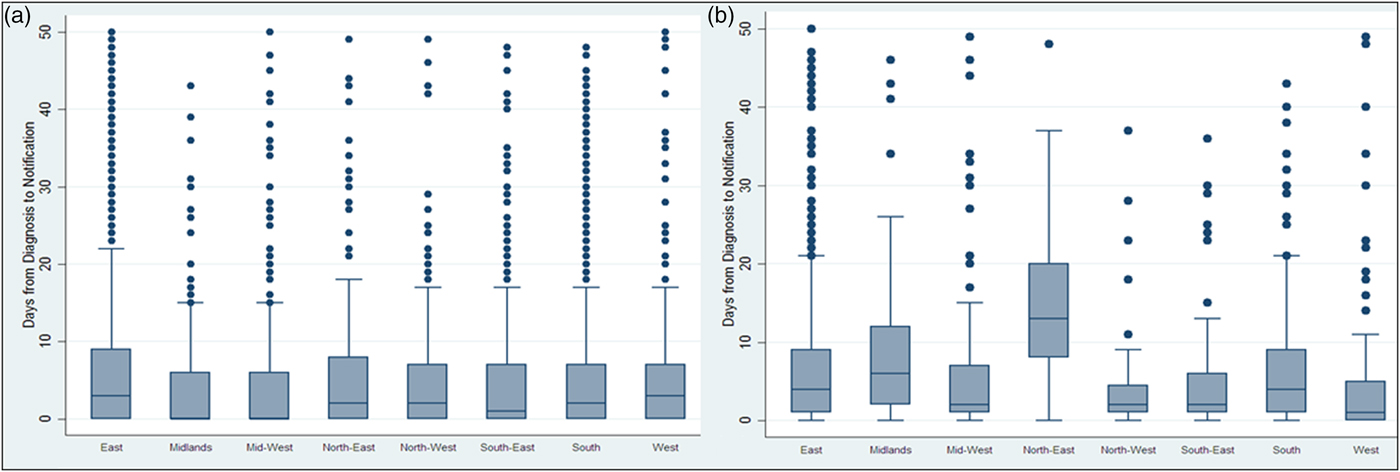
Fig. 1. Days* between diagnosis and notification of TB on NTBSS between 2002 and 2010 (a) and CIDR between 2011 and 2015 (b) by health authority area. *Extreme values above 50 days were removed to allow the medians and interquartile ranges to be visible in the graph.
Twenty-four out of 27 people responded to the online questionnaire regarding simplicity, usefulness and flexibility of the systems (89% response). Most respondents were surveillance scientists (n = 9), followed by senior medical officers (n = 6), specialists in public health medicine (n = 6), infection control nurses (n = 2) and administration staff (n = 1). Twenty out of the 24 respondents had used both CIDR and NTBSS. Table 3 shows that based on a Likert scale, more people found that CIDR was easy to use (20–40%) and user-friendly (33%), while less people thought that it is difficult to use (4–17%) and not user-friendly (21%). Respondents agreed that the system (54%), the necessary variables (63%) and reports (29%) were available for the effective surveillance of TB. One third rated the ability of CIDR to describe TB on a weekly basis as good but were less happy with its ability to detect outbreaks. On the other hand, users thought that the system is not very flexible in terms of adding new variables (25%) and producing or modifying existing reports (33%). When people were asked to compare the two systems, the highest percentage thought that CIDR is simpler than NTBSS (38% vs. 25%), more useful (41% vs. 13%) and more flexible (29% vs. 25%).
Table 3. Results from the online questionnaire on simplicity, usefulness and flexibility of CIDR, N = 24a
In bold, highlighted the response with the highest percentage for each question.
a The table presents only the questions related to CIDR and not those on the comparison between CIDR and NTBSS.
Discussion
This is the first study that assesses the completeness, timeliness, simplicity, flexibility and usefulness of the NTBSS after the introduction of CIDR and also compares these attributes to the NTBSS. The WHO TB elimination plan highlights the need for having precise and timely clinical and microbiological data to monitor the disease effectively [4].
In our study, we compared the completeness of the most important core and enhanced variables between CIDR and NTBSS. The core demographic variables were well completed in both systems, while the enhanced demographic variables were more complete in NTBSS. A better knowledge of these variables (employment, living status, ethnic group, refugee/asylum seeker) will allow us to better evaluate the trends of the disease among vulnerable populations and identify public health actions targeted to specific groups [15–19]. The core dates were more complete in NTBSS even when compared with the validated CIDR data, which highlights that not all variables for notified cases are entered consistently.
Variables related to risk factors and vaccination have better completion in NTBSS apart from the HIV status for which the completion improved after the introduction of CIDR; that could be a result of either the integration of clinical and laboratory data in CIDR or of the fact that HIV became a notifiable disease in 2011 [20]. Having good quality data on the HIV status of the TB patients can support collaborative TB/HIV activities [21].
The completeness of all variables related to drug sensitivity has significantly improved in CIDR. That may be a function of both awareness of multidrug-resistant-TB among public health professionals and the integration of clinical and laboratory data within CIDR. TB surveillance requires data on levels of TB drug resistance in the country and routine testing of all TB patients helps us better understand and monitor the trends [22]. All variables related to the outcome of treatment are better completed in CIDR, although the completion still remains low. Follow-up questions after treatment initiation can be better captured using a centralised electronic system that can be accessed by any person and updated at any time.
The time interval evaluated as an indicator of the timeliness of the surveillance system was the time between diagnosis of the disease and notification to the system. The 2010 Irish guidelines on the prevention and control of TB state that, ideally, TB cases should be notified not later than 1 working day following diagnosis but this is very hard to achieve in reality [23]. From our evaluation, the median time from diagnosis to notification was more than 1 day and it increased after the introduction of CIDR. This increase was observed in all HSE regions irrespective of their TB incidence. The difference in the timeliness of notifications observed between regions could be a function of human resource capacity for entering data both in laboratories and departments of public health. Although the NTBSS data appear more timely, it should be noted that the NTBSS date of notification may not reflect the date the case was entered onto the local database and it was also not the date that was available nationally. As CIDR is intended to be a ‘real-time’ surveillance system, the provision of timely data should be a priority and this needs to be further explored with users.
A weakness of the current system is that all data from CIDR are imported into an MS-Access database at HPSC that contains all national validated TB surveillance data since 2002. This database is used to facilitate report production and statistical analysis (the same also happens for other diseases) due to the limited capabilities of the reporting tool within CIDR. This additional validation is a consequence of having the data offline where a natural step is then to spot gaps or inaccuracies and augment the data as the analysis is in progress. This results in increased completeness of certain variables (e.g. cause of death). A centralised national electronic system though should have better business intelligence and reporting tools and should not require this process, which increases the workload.
The results of the stakeholder survey showed that many respondents rated CIDR as ‘user-friendly’ and ‘easy’ to use. When comparing the simplicity between the two systems, almost half of the respondents thought that CIDR was simpler to use. The usefulness of CIDR was also rated higher. Having a centralised surveillance system makes it simpler and faster to view and update data. In addition, CIDR keeps free-text fields to a minimum and uses standardised drop-down menus, which minimises errors and creates a dataset in consistent format that is easier to analyse [Reference Panackal11]. A high percentage though did not rate highly the ability of CIDR to detect outbreaks but CIDR is a retrospective surveillance tool and was not designed to detect outbreaks (although if outbreaks are detected, they are reported to CIDR). Despite the fact that CIDR was considered to be more flexible than NTBSS, its flexibility alone was not rated very highly and that is an area that should be improved.
In conclusion, this study demonstrated that centralised electronic surveillance did not improve completeness of data and reduced the timeliness of the notification procedure. Simplicity, usefulness and flexibility were improved but qualitative methods should be applied to further explore these results. HPSC needs to explore ways with CIDR users to ensure optimal use of the system in order to improve its levels of completeness and timeliness.
Acknowledgements
We would like to acknowledge all regional departments of public health who responded to the evaluation survey. In addition, we would like to thank those who provided data to the national TB surveillance system (both NTBSS and CIDR), including notifying physicians, public health doctors, surveillance scientists, microbiologists, nurses, laboratory staff and administrative staff.
Conflict of interest
None.


