


INTRODUCTION
Influenza respiratory infection in humans is an important global cause of hospital admissions and mortality [Reference Thompson1, 2]. While attack rates are highest in children, mortality rates are typically highest in elderly populations and in persons with underlying chronic health conditions [Reference Nair3, Reference Reber4]. In the Northern Hemisphere, seasonal influenza epidemics usually occur during the autumn and winter months. The onset, duration, intensity and geographical spread of influenza activity are difficult to predict [Reference Lofgren5, Reference Moorthy6], meaning timely and effective detection of the start of the seasonal epidemic is essential to alert health services and mitigate morbidity, mortality and economic costs.
The general objective of the influenza surveillance system is to describe and assess the effects of influenza epidemics each winter season in order to reduce the impact on the population. To achieve this goal, rapid detection of the start of the epidemic as well as monitoring the intensity of the activity is necessary to improve timely mobilization of influenza control measures and health system resources at the regional level.
The WHO Regional Office for Europe (WHO/Europe) and the European Centre for Disease Prevention and Control (ECDC) jointly collect weekly data on quantitative and qualitative indicators for influenza from more than 50 Member States [7]. Qualitative indicators of influenza activity defined by the European Influenza Surveillance Network (EISN) include intensity levels, geographical spread and trend. Despite these guidelines, comparing influenza activity between regions remains a challenge, since comparisons are based on qualitative characterization of the epidemic by comparing with historical data of influenza-like illness (ILI) rates (usually seen in previous seasons, higher than usual, exceptionally high compared with previous seasons) [Reference Vega8]. Standardization of surveillance activities guarantees availability and easier comparison of data and must be a priority at regional, national and international levels.
The Spanish Influenza Sentinel Surveillance System (SISSS) currently covers the 17 Autonomous Regions of Spain supported by a network of sentinel physicians (general practitioners and paediatricians) and network-affiliated laboratories including the National Influenza Reference Laboratory [National Centre for Microbiology, World Health Organization National Influenza Centre (NIC) in Madrid], the NIC of Hospital Clínic in Barcelona and the NIC of Hospital Clínico Universitario in Valladolid. These sentinel physicians report cases of ILI to regional and central levels on a weekly basis [Reference Larrauri and de Mateo9] using the EISN guidelines to determine their respective influenza activity indicators [10].
Recently, the Moving Epidemic Method (MEM) has been proposed as an alternative to determine the epidemic threshold, intensity and trend of seasonal influenza [Reference Vega8]. The MEM has been piloted by the WHO, ECDC and the Influenza Research Group of Castilla y León, Spain, to monitor the intensity level in 19 European countries [Reference Vega11] based on historical weekly influenza incidence rates. Results from the study showed the usefulness of this method for comparisons at national and international levels. The MEM approach has been piloted recently in the UK [Reference Green12] and adopted for reporting by each country of the UK.
To investigate the potential value of using MEM in the standardization of influenza reporting of indicators in the different regions in Spain, we applied the MEM method to the 2014–2015 influenza season at regional and national levels within the SISSS. Specifically, we compared the start and intensity of the influenza epidemic using the EISN indicators reported to SISSS, with those obtained from MEM using historical ILI rates.
METHODS
Data
Weekly crude influenza incidence rates (ILI cases/100000 population) were obtained from each of the 17 Spanish sentinel networks included in SISSS and at the national level [13]. For each network we used the maximum number of available influenza seasons up to ten prior to the 2014–2015 season, excluding the pandemic season of 2009–2010. In this study, weekly ILI rates of ten influenza seasons were used for 10/17 sentinel networks (Andalucía, Aragón, Baleares, Canarias, Castilla–La Mancha, Castilla y León, Comunidad Valenciana, Extremadura, Madrid, País Vasco) and at the national level; nine seasons for Cantabria, Asturias, Navarra and La Rioja; eight seasons for Cataluña and Ceuta, and four seasons for Melilla.
MEM approach
We modelled the influenza epidemics at national and regional levels applying MEM to the historical influenza incidence rates. Four thresholds (pre-epidemic and three intensity epidemic thresholds) were calculated for the 2014–2015 influenza season as described previously [Reference Vega8] using R statistical software and the MEM package (package ‘mem’: https://cran.r-project.org/web/packages/mem/). Briefly, the pre-epidemic threshold (baseline) is calculated as the upper limit of the 95% confidence interval of the arithmetic mean of the 30 highest pre-epidemic weekly incidence rates within the last ten (or the available number) influenza seasons, excluding the pandemic season (2009–2010). In addition, the medium, high and very high intensity thresholds are calculated as the upper limits of the 40%, 90% and 97·5% confidence intervals of the geometric mean of the 30 highest epidemic weekly incidence rates from the same historical time period [Reference Vega8]. These four cut-off points define the ‘baseline level’ (under the epidemic threshold) and four influenza intensity levels classified as ‘low’, ‘medium’, ‘high’ and ‘very high’ (Table 1).
Table 1. Definitions and comparison of intensity levels with EISN and MEM criteria

ILI, Influenza-like illness; CI, confidence interval.
* Baseline influenza activity is the level that clinical influenza activity remains throughout the summer and most of winter.
† 95% CI of the arithmetic mean of the 30 highest pre-epidemic weekly ILI rates within the last ten (or the available number) influenza seasons.
‡ 40% CI of the geometric mean of the 30 highest epidemic weekly ILI rates from the same historical period of time.
§ 90% CI of the geometric mean of the 30 highest epidemic weekly ILI rates from the same historical period of time.
|| 97·5% CI of the geometric mean of the 30 highest epidemic weekly ILI rates from the same historical period of time.
Note that medium intensity level according to the criteria of EISN includes the low and medium intensity levels calculated with MEM criteria.
The SISSS sentinel networks reported their own pre-epidemic threshold at the beginning of the season. Pre-epidemic thresholds are generally calculated as the average of weekly rates of the last five influenza seasons, weighted by the population under surveillance each week. In addition, weekly intensity level (‘low’, ‘medium’, ‘high’ and ‘very high’) according to the four EISN criteria intensity levels were reported (Table 1). While EISN indicators qualitatively characterize the influenza intensity level (‘usually seen’, ‘higher than usual’, ‘exceptionally high’) compared to previous seasons, MEM provides a mathematical range to define the influenza intensity levels. As ‘low’ is defined by EISN as no or baseline activity, it was compared to ‘baseline activity’ defined by MEM and ‘medium’ defined by EISN to ‘low and medium’ levels defined by MEM. The intensity level reported by each network to SISSS at the peak of the epidemic curve was compared to the level calculated by MEM. Statistical differences between intensity levels, after assigning a numerical value to the intensity levels (1 = low/baseline; 2 = medium/low-medium; 3 = high; 4 = very high), were determined using the Wilcoxon signed-rank test. A P value <0·05 was considered statistically significant.
In addition, we compared the presence of ‘false alerts’ in the reported and MEM-calculated intensity levels. A ‘false alert’ is defined as an intensity level higher than baseline level (or ‘low’ for EISN) prior to the actual start of the epidemic curve.
RESULTS
Comparison of reported and MEM-calculated intensity levels
The reported (left) and MEM (right) intensity levels throughout season 2014–2015 for each sentinel network and for national data were compared (Supplementary Fig. S1). In some regions the reported intensity levels gave inconsistences in the notification. For example, with the same influenza rate (around 100 ILI cases/100 000 population) Baleares reported medium and high intensity levels at weeks 3 and 8 of the epidemic, respectively. In the same weeks, Cataluña reported high and medium intensity levels respectively, with an influenza rate (~260 ILI cases/100 000). In contrast, the MEM method gave similar intensity levels within a specific region for similar influenza rates.
Comparison of reported and MEM-calculated pre-epidemic thresholds
In four sentinel networks (Asturias, Extremadura, Madrid, Melilla), as well as at the national level, MEM pre-epidemic thresholds had already been calculated at the beginning of the 2014–2015 season and therefore were identical to those reported (Table 2). In Castilla y León the MEM-calculated threshold was higher than the reported threshold, which had been calculated with MEM but using age-adjusted rates for the Castilla y León population. The MEM-calculated threshold was also higher than those reported in Canarias and Cantabria; lower in Andalucía, Aragón, Baleares, Castilla–La Mancha, Cataluña, Comunidad Valenciana, País Vasco, La Rioja and Ceuta; and had a similar value in Navarra (Table 2).
Table 2. Epidemic threshold* reported and calculated with MEM
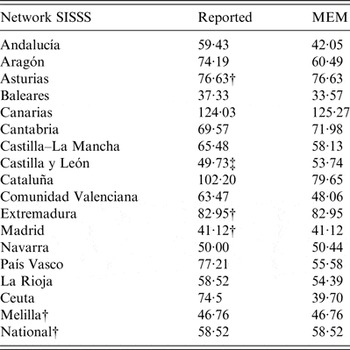
SISSS, Spanish Influenza Sentinel Surveillance System; ILI, Influenza-like illness; MEM, moving epidemic method.
* ILI per 100 000.
† MEM epidemic threshold was reported in 2014–2015.
‡ MEM epidemic threshold calculated with sex- and age-adjusted weekly rates was reported in 2014–2015.
Intensity levels at the peak of epidemic season
National data show the same intensity level at the peak (‘high’) with both methods, as well as in eight of the sentinel networks: ‘very high’ in Melilla, ‘high’ in Cataluña and Madrid, and ‘medium’ in Andalucía, Asturias, Canarias, Comunidad Valenciana and La Rioja. Lower MEM intensity levels than those reported were found in five sentinel networks (Aragón, Baleares, Cantabria, Extremadura, Navarra) (Table 3). In contrast, higher MEM levels than those reported were found in Castilla–La Mancha, Castilla y León, País Vasco and Ceuta (Table 3). The differences observed between the reported intensity levels at the epidemic peak and those calculated with MEM were not statistically significant (P = 0·74) (Wilcoxon signed-rank test).
Table 3. Intensity levels at the epidemic peak and false alerts to identify the epidemic start according to the method used

SISSS, Spanish Influenza Sentinel Surveillance System; ILI, Influenza-like illness; MEM, moving epidemic method.
* Epidemiological week in which false alert occurred.
Presence of false alerts
Andalucía and Ceuta presented a false alert to detect the start of the epidemic in two and three weeks, respectively, when using MEM thresholds, while only one false alert in Ceuta was identified with the reported threshold (Table 3, Supplementary Fig. S1).
DISCUSSION
In this study we compared pre-epidemic thresholds and intensity influenza levels historically reported to those calculated using the recently proposed MEM method, in order to standardize influenza reporting of indicators at national and regional levels in Spain.
Information on the start and the intensity of the influenza epidemic is especially important at the regional level, because it will be used by local authorities to reinforce the healthcare system and inform healthcare professionals on the evolution of the epidemic, and what can help in reducing the impact of influenza on morbidity and mortality in the population.
The qualitative EISN intensity indicators are subjective and prone to personal interpretation. In fact, during the 2014–2015 influenza epidemic, similar ILI rates in several regions corresponded to different intensity levels. In this sense, MEM determines the levels of influenza activity mathematically rather than using a qualitative assessment, thereby avoiding frequent inconsistencies in surveillance reporting. As such, implementation of MEM allows objective and homogenous reporting of the intensity of influenza activity in the different networks within SISSS. This enables more effective evaluation of any public health measures implemented at regional or national levels as well as at the European level.
Intensity levels reported and those obtained with MEM at the epidemic peak of the influenza wave, at national and regional levels, did not show statistical differences. Since the EISN and MEM thresholds did not show many differences in season 2014–2015, we believe that the implementation of MEM would have had limited disrupting effects on the manner of notification to the surveillance system. That is, with the EISN method, notification of an intensity classification such as ‘medium’ would result in a public health response based on historical experience of healthcare pressure for that intensity level. When implementing MEM, the intensity levels reported would therefore result in the same public health response and not disrupt the established method of surveillance notification and communication regarding the evolution of influenza activity.
Taking in account that the start of the influenza epidemic differed by almost in 4 weeks between different regions, this information is considered crucial for adjustment of control measures on time in each Spanish region. In most of the regions the MEM epidemic thresholds were similar or lower than those reported, which would be beneficial for detection of the start of an influenza epidemic in a timely manner, and therefore avoid delays in implementing preventative measures. However, this feature also has the potential to increase the number of ‘false alerts’ observed prior the real start of the influenza epidemic. In our pilot study, considering the weekly ILI rates observed in 17 regional sentinel networks as well as at the national level over the 2014–2015 season, the MEM epidemic thresholds only produced two false alerts compared to one false alert observed when the reported baseline was used.
Another advantage of the MEM methodology is that it provides a more precise categorization of the influenza intensity levels, as the EISN ‘medium’ level is divided into two intensity levels with MEM, i.e. ‘low’ and ‘medium’. This added precision allows differentiation between influenza epidemics that were previously characterized as ‘medium’ at the maximum influenza intensity, and can help in deciding whether to implement different control measures. At the same time, this change of nomenclature may result in some discrepancies by clinical and public health professionals during the first seasons following introduction. However, we believe that this can be overcome with an initial effort during the first season of implementation by timely communication of influenza surveillance data to the members of the network.
Compared to other existing methods, the advantages of MEM are its simplicity, flexibility and intuitive concept. Other methods aiming to detect the start of influenza activity rely on relatively complex mathematical models [Reference Closas, Coma and Mendez14–Reference Tillett and Spencer17] that require specialist programs which limits their implementation. As the MEM method is developed on open-source software, implementation of MEM is a user-friendly option.
A limitation of MEM is the requirement of up to 10 years of consistent historical influenza data to accurately calculate values. Although the number of seasons included in the calculation remains a point of discussion, the minimum accepted number of seasons to obtain stable thresholds is five. In our study, this limitation had limited impact, since 95% of sentinel networks assessed had the required information, while one network (Melilla) had information available only for four seasons. However, as a result of this pilot study, the MEM method has been adopted at the national level from season 2015–2016, and from 2016–2017 by sentinel networks in SISSS, including Melilla; therefore the number of seasons used in this network was five.
Our study confirms the utility of adopting MEM in the standardization of some parameters, such as the start of the epidemic wave, the epidemic thresholds and the intensity of peaks. We are aware that the analysis of the evolution of influenza activity using both methods at regional level, has been performed on one influenza season alone. However, MEM has been used at the national level for the three previous seasons and has also been successfully piloted in 19 European countries [Reference Vega11]. In addition, the ECDC has adopted this method for monitoring the start and the intensity level of influenza in countries reporting to The European Surveillance System (TESSy).
With the exception of the UK-wide assessment of the start of influenza activity [Reference Green12], this is the first time that MEM methodology has been applied at the regional level in a country with as many as 19 regions, as in Spain. While the influenza surveillance and healthcare systems are similar at the regional level in Spain, the subjective interpretations of the influenza indicators were not always analogous. The MEM method eliminates subjectivity in reporting and allows adequate comparisons of the start and the intensity of influenza epidemics at regional and national levels with sensible results obtained. As a result of this pilot study, the MEM method has been adopted at the national level and by almost all sentinel networks in SISSS, starting from season 2015–2016, thereby harmonizing the reporting of the start of epidemic and intensity levels of influenza activity in Spain.
APPENDIX. Members of the Epidemiology Working Group of the Spanish Influenza Sentinel Surveillance System
Jose María Mayoral, Virtudes Gallardo, Esteban Pérez (Servicio de Epidemiología, Consejería de Salud de la Junta de Andalucía); Elisa Marco, Juan Pablo Alonso (Servicio de Vigilancia en Salud Pública, Dirección General de Salud Pública, Aragón); Ismael Huerta (Dirección General de Salud Pública y Planificación, Consejería de Salud y Servicios Sanitarios, Asturias); Antonio Nicolau, Jaume Gimenez, Juana María Vanrell (Servicio de Epidemiología, Dirección General de Salut Pública, Baleares); Lucas González (Servicio de Epidemiología y Prevención, Consejería de Sanidad de Canarias); Luis J. Viloria (Sección de Epidemiología, Consejería de Sanidad, Trabajo y Servicios Sociales de Cantabria); Gonzalo Gutiérrez, Mª Victoria García (Servicio de Epidemiología, Consejería de Sanidad de Castilla–La Mancha); Tomás Vega, José E. Lozano (Dirección General de Salud Pública e Investigación, Desarrollo e Innovación, Consejería de Sanidad de Castilla y León); Ana Martínez, Nuria Torner (Servicio de Vigilancia Epidemiológica, DGSP, Departament de Salut, Generalitat Catalunya); Aurora López, Maite Miralles, Carmen Alberich (Subdirección General de Epidemiologia y Vigilancia de la Salud, Conselleria de Sanitat, Comunitat Valenciana); Julián Mauro Ramos, Carmen Serrano (Sub-dirección de Epidemiología, Dirección de Salud Pública, Servicio Extremeño de Salud, Extremadura); María Jesús Purriños (Dirección Xeral de Innovación e Xestión da Saúde Pública de Galicia*); Luis García, María Ordobás (Dirección General de Atención Primaria de la Comunidad de Madrid); Ana García, Rocío García (Servicio de Epidemiología. Consejería de Sanidad de la Región de Murcia*); Jesús Castilla (Sección de Vigilancia de Enfermedades Transmisibles del Instituto de Salud Pública de Navarra); José María Arteagoitia, Fernando González-Carril (Servicio de Vigilancia Epidemiológica, Consejería de Sanidad del País Vasco); Carmen Quiñones, Eva Martínez (Servicio de Epidemiología y Prevención Sanitaria, Dirección General de Salud Pública y Consumo del gobierno de La Rioja); Ana Rivas (Sección de Vigilancia Epidemiológica, Consejería de Sanidad y Bienestar Social de Ceuta); Daniel Castrillejo (Servicio de Epidemiología, Consejería de Bienestar Social y Sanidad de Melilla); Concha Delgado, Jesús Oliva, Alin Gherasim, Salvador de Mateo, Inmaculada León, Diana Gómez, Amparo Larrauri (Área de Vigilancia de la Salud Pública, Centro Nacional de Epidemiología).
(* Although no sentinel influenza surveillance network is implemented, levels of influenza intensity using the MEM method are used.)
SUPPLEMENTARY MATERIAL
For supplementary material accompanying this paper visit https://doi.org/10.1017/S0950268816002727
ACKNOWLEDGEMENTS
We acknowledge the long-standing contribution of all participating sentinel physicians and epidemiologists of influenza sentinel surveillance networks in: Andalucía, Aragón, Asturias, Baleares, Canarias, Cantabria, Castilla–La Mancha, Castilla y León, Cataluña, Comunidad Valenciana, Extremadura, Madrid, Navarra, País Vasco, La Rioja, Ceuta and Melilla. We also thank the virologists belonging to the Spanish Influenza Surveillance System, especially Francisco Pozo and Inmaculada Casas from the National Influenza Reference Laboratory at the National Centre for Microbiology, Institute of Health Carlos III, who have been involved in the Project Proposal for Influenza Surveillance in the EUPHEM programme 2015. We also thank Androulla Efstratiou, Public Health England, for reviewing this manuscript. Finally, we thank all professionals involved in the Spanish Influenza Surveillance System.
This study received no financial support.
DECLARATION OF INTEREST
None.


