

INTRODUCTION
Dengue fever (DF), is the most widespread mosquito-borne viral disease globally, with a distribution that includes much of the tropics and subtropics [1]. The increasing geographical expansion and incidence rates of DF constitute a serious global economic, social and public health issue [Reference Guzman and Harris2, Reference Simmons3]. DF has spread rapidly over the last 50 years as a factor of increased global trade, international travel, climate change, urbanization and limited vector control strategies [Reference Jones4, Reference Schwartz5]. Although the first DF vaccine was licensed in Mexico in December 2015, it will require a lengthy period before it is used worldwide as the effect estimation of the vaccine, where and how to use the vaccine should be considered. As such, DF remains a major public health issue worldwide and a better understanding of the potential risk factors for DF transmission are required to facilitate the development of more effective control strategies and early warning systems.
DF transmission intensity is determined by multifarious risk factors. Many studies focusing on the relationships between DF incidence rates and weather variables are based solely on mean temperature, relative humidity or mean precipitation [Reference Huang6, Reference Banu7]. It is, however, still unclear which specific weather elements facilitate the spread of DF across different geographical locations and various climatic regions [Reference Johansson, Dominici and Glass8]. Conditions including socioeconomic factors, environmental factors, and human behaviour, could potentially interact with meteorological factors to explain regional differences [Reference Horta9, Reference Hu10]. Climatic variation has often been cited as being responsible for differences in the geographical distribution of DF vectors, the reproduction rates of dengue virus (DENV), the extrinsic incubation period (EIP) and mosquito survival [Reference Delatte11]. However, findings from recent studies indicate that short-term temperature fluctuations could substantially alter the incubation period for parasites [Reference Paaijmans, Read and Thomas12, Reference Lambrechts13]. Quantitative interpretations of the relationship between meteorological factors and DF incidence rates are scarce.
In 1978, DF re-emerged in Foshan city after a 32-year hiatus in China. It subsequently spread widely throughout Guangdong, Guangxi, Hainan Island and Fujian provinces, affecting hundreds of thousands of people in the southeast coastal regions of China [Reference Fan, Yu and Cosgriff14]. Eighty per cent of reported cases occurred in Guangdong province, including Guangzhou, Zhongshan, Foshan, and the adjacent cities during the past decades. The serotypes of DENV-1–4 have appeared alternately since the outbreak in China in 1978. However, over the past 15 years, DENV-1 has predominated in China [Reference Lai15]. Since the re-emergence of DF, prevention and control have been regarded as a top priority by the Guangdong provincial government. The increasing range of Aedes albopictus has spurred public health concerns as it may further expand the global distribution of DF [Reference Lambrechts, Scott and Gubler16]. While Aedes aegypti is the main vector of DF worldwide, DENV transmission in China is primarily due to A. albopictus.
Confirmation of DF cases in China is based on clinical diagnosis and laboratory diagnosis. Early notification of DF cases identified in primary and secondary care is crucial for identifying outbreaks and initiating an early response. Early diagnosis of DF is challenging [Reference Tang and Ooi17]. The incubation period of patients infected with DENV for transmission via mosquitoes is 4–5 days (maximum 12 days), and the average time interval between symptom onset and laboratory confirmation of DF patients is 6 days in China [Reference Bisset18]. Timely diagnosis and early treatment of patients are essential, especially for severe cases. Furthermore, cases that remain undetected or are not identified in a timely manner represent a potentially important risk factor in the spread of DF virus. Few studies have quantitatively assessed the timeliness of diagnosis of autochthonous DF. The aim of the current study is to identify the hierarchical relationship between timeliness of DF surveillance systems, mosquito density, imported cases, meteorological factors and autochthonous DF incidence rates, and to estimate the threshold effects of high-order interactions among these risk factors on the incidence rates of autochthonous DF. This information will be beneficial in guiding future approaches for the control of DF in Guangdong province and beyond.
MATERIALS AND METHODS
Study site
The study site was located in Zhongshan city (latitude 22·515847° N, longitude 113·392207° E), which is in south-central Guangdong province in the port of the Pearl River Delta. Zhongshan is close to Guangzhou (the capital city of Guangdong), Hong Kong and Macau. In 2012 the population of Zhongshan was 3 155 078 [19]; there is, however, substantial movement of people between Zhongshan and adjacent cities which may facilitate the spread of disease. Zhongshan city has a subtropical monsoonal climate with hot, humid summers and mild, dry sunny winters. The annual mean temperature is between 21 °C and 23 °C, and the annual total precipitation is 2010 mm (Fig. 1).
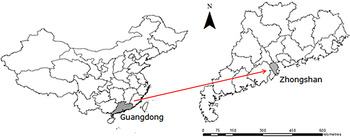
Fig. 1. Location of Zhongshan, Guangdong, China.
Data collection and case definitions
Notification of DF is a legally mandated in in China, and cases are diagnosed according to the national diagnostic criteria of DF [20, 21]. Data on both autochthonous and imported cases were obtained from the Notifiable Infectious Disease Reporting System (NIDRS) at Zhongshan Center for Disease Control and Prevention (CDC) for the period 1 January 2001 to 31 December 2013. The DF diagnosis criteria included epidemiological exposure history, clinical manifestations, and laboratory tests. Since DF is a notifiable disease, positive test results need to be reported by hospitals to China CDC. DF was clinically diagnosed according to the following symptoms: presenting fever 39–40 °C and with one of the following symptoms: rash, headache, retro-orbital pain, myalgia, arthralgia, rash and conjunctival congestion. The serum samples of suspected patients were then sent to the local CDC laboratory for confirmation based on the following different laboratory tools: the detection of the virus isolation and identification, viral nucleic acid positive by PCR test, detection of antigens or antibodies, a fourfold increase in specific IgG antibody titre in the paired serum specimens in the acute and convalescent phase or the combination of these methods [22]. The laboratory-test tools for DF serum are combined on the basis of the days of illness phases. The sensitivity of each approach is influenced by the duration of the patient's course of illness. The ratio IgM/IgG is used to identify primary and secondary DENV infections [22]. Autochthonous DF cases were defined as the confirmed cases in a patient with no history of travel to endemic areas outside China or other cities in China in the preceding 14 days. Conversely, at the city level, imported DF cases were defined as the patients with DF who had traveled to dengue-endemic areas (as specified by WHO) outside China or other cities in China in 14 days prior to the development of symptoms [23].
The symptoms of DF are non-specific and may mimic other febrile illnesses. As such, clinical diagnoses lack specificity and laboratory confirmation is generally sought. For every notified DF case, the date of symptom onset and the date of laboratory diagnosis were recorded. The timeliness of diagnosis was defined as the monthly median time interval between symptom onset date and laboratory diagnosis date (MTIOD).
The population statistics data were obtained from Zhongshan Statistical Bureau [19]. Previous studies have reported that meteorological factors such as temperature, rainfall, relative humidity, and diurnal temperature range (DTR) are related to DF incidence rates [Reference Huang6, Reference Lambrechts13]. DTR is defined as the difference between the maximum and the minimum daily temperature. In this study, monthly meteorological data were provided by Zhongshan Meteorological Bureau [24]. Meteorological variables used in the study included: monthly maximum temperature (MaxT) (°C), monthly minimum temperature (MinT) (°C), monthly mean temperature (MeanT) (°C), monthly maximum diurnal temperature range (MaxDTR) (°C), monthly mean diurnal temperature range (MeanDTR) (°C), monthly minimum diurnal temperature range (MinDTR) (°C), monthly mean rainfall (MeanRF) (mm), monthly maximum relative humidity (MaxRH) (%), monthly minimum relative humidity (MinRH) (%), and monthly mean relative humidity (MeanRH) (%).
A. albopictus is the sole vector for the transmission of DENV in Zhongshan, China [Reference Liu25]. Mosquito surveillance, especially larval density surveillance is routinely performed in Zhongshan. Larval density surveillance is routinely performed in the 24 administrative districts of Zhongshan. Breteau index (BI) was defined as the number of positive containers containing larvae per 100 houses inspected by monthly door-to-door interview [22]. BI is considered as the most informative index for A. albopictus density due to inclusion of the information of positive containers and houses [22]. The surveillance was conducted at monthly intervals over the study period.
Statistical analysis and modelling
Time-series cross-correlation analysis
As the relationship between DF incidence rates and other factors for the current month or previous months require exploration, cross-correlations were used to compute correlations between meteorological factors and the DF incidence over a range of time lags (a time lag was defined as the timespan between the risk factors and incidence rates of DF fever). The cross-correlation function was performed to quantify the linear correlation between the monthly autochthonous DF cases and risk factors, including the monthly imported cases, meteorological variables, mosquito density and monthly MTIOD over a lag time of 7 months. In this study, we used the lagged moving average (MA) value to calculate the lagged effect on the series of the factors. The significant time lags of the risk factors were chosen for the calculation of lagged MA. The MA value is applied in a time-series model which is defined as the mean value of the previous numbers of lagged periods [Reference Bowerman and O'Connell26]. The lagged MA could be better for explaining the lagged effects of the factors.
Time-series classification and regression tree
The classification and regression tree (CART) model is a flexible, robust and non-parametric statistical method which is useful for the analysis of complex ecological applications. Exploring and constructing the decision-tree model in the ensemble method can express the nonlinear relationships, high-order interactions, and missing values.
CART is suitable for predicting the relationships between dependent variables and exploratory variables [Reference De'ath27]. It can interpret the variation of a single response variable by recursive partitioning of the the ecological data into more homogeneous subsets, using combinations of explanatory variables. The response variable can be a categorical variable (a classification tree) or a continuous variable (a regression tree) [Reference Elith, Leathwick and Hastie28]. A time-series regression tree model was used to determine the threshold effects of the risk factors in the monthly incidence rates of autochthonous DF. In this study, we used meteorological variables, mosquito density, timeliness of diagnosis and the seasonality factor [harmonic factors: sin(2pt/52) and cos(2pt/52)] as the independent variables for analysis in the CART model. The tenfold cross-validation was performed to identify the hypothesis in the analysis.
The tree was grown by the recursive binary splitting of variables, including meteorological variability, mosquito density, and timeliness of diagnosis. Each split formed on the basis of a single explanatory variable and two nodes, which was selected to maximize homogeneity (minimize impurity) of the resulting two nodes. Homogeneity was assessed with several impurity functions, and two measures were used for regression trees: least squares (Gini splitting rules) and least absolute deviations (two splitting rules). During the process of modelling, a preferred method is to produce an overly large tree and then prune and test using independent data. Pruning is used to reduce the tree to an optimal size, which is determined using cross-validation or independent tests. Cross-validation is used to choose the best tree on the basis of the misclassification error and the complexity of the tree. The task is achieved through cost-complexity function: $R_C (T) = R(T) + c(\tilde{T}) \rightarrow \min T$
, where R(T) is the residual estimate of error, misclassification error of the tree
$R_C (T) = R(T) + c(\tilde{T}) \rightarrow \min T$
, where R(T) is the residual estimate of error, misclassification error of the tree $T, c (\tilde{T})$
is the complexity measure which depends on
$T, c (\tilde{T})$
is the complexity measure which depends on $\tilde{T}$
, which is the number of terminal nodes in the tree, c is the parameter which is used to build the tree through learning sample and testing sample [Reference Breiman29]. The procedure of tenfold cross-validation is performed to prune the overly large trees and to select the best-trimmed tree through a training data subgroup and a testing data subgroup. The process of cross-validation is performed as follows: the data are randomly split into ten subsets, training the model on nine subsets and calculating the estimated error rates on the tenth subset. The best optional tree is the one with the smallest estimated error rates [Reference De'ath27].
$\tilde{T}$
, which is the number of terminal nodes in the tree, c is the parameter which is used to build the tree through learning sample and testing sample [Reference Breiman29]. The procedure of tenfold cross-validation is performed to prune the overly large trees and to select the best-trimmed tree through a training data subgroup and a testing data subgroup. The process of cross-validation is performed as follows: the data are randomly split into ten subsets, training the model on nine subsets and calculating the estimated error rates on the tenth subset. The best optional tree is the one with the smallest estimated error rates [Reference De'ath27].
Monthly DF incidence was considered a continuous response variable when the regression model was built in this study. The risk factors which were significantly positively or negatively associated with the autochthonous incidence rates in cross-correlation analyses were applied to the time-series regression tree model as independent variables. All time-series variable graphs were completed by Microsoft Excel 2007 (Microsoft Corp., USA). Cross-correlation between the factors and DF incidence rates were performed using SPSS v. 16 (SPSS Inc., USA) and time-series regression tree models were constructed in R software v. 3.1.1 (R Foundation for Statistical Computing, Austria).
Ethics statement
Ethics clearance for this project was approved by Sun Yat-Sen University and Zhongshan Center for Disease Control and Prevention Ethical Review Committee (Approval no: 2015024). DF data were collected from NIDRS. All potentially identifiable information has been removed to protect the privacy of individuals.
RESULTS
Descriptive analysis
The seasonal variations of autochthonous DF cases, meteorological factors, mosquito density and MTIOD during the study period are shown in Figure 2. There were 1110 notifications for autochthonous DF cases and 40 imported cases in Zhongshan city during the period 1 January 2001 to 31 December 2013. The autochthonous cases mainly occurred between July and November. The mean monthly number of autochthonous cases was 7·12 (Table 1).
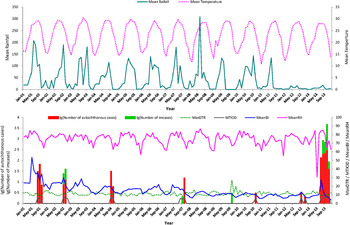
Fig. 2. Monthly distribution of autochthonous dengue cases, imported dengue cases, mosquito density, meteorological variation and time interval between onset and diagnosis from January 2001 to December 2013 in Zhongshan, China. Mean rainfall (mm), monthly mean rainfall; mean temperature (°C), monthly mean temperature; MaxDTR (°C), monthly maximum diurnal temperature range; MTIOD (days), monthly median time interval between symptom onset and diagnosis by day; MeanBI, monthly mean Breteau Index; MinRH (%), monthly minimum relative humidity.
Table 1. Summary statistics of monthly data for all variables between 1 January 2001 and 31 December 2013 in Zhongshan, China

aADF, Monthly autochthonous DF cases; bIDF, monthly imported DF cases; cMeanBI, monthly mean Breteau Index; dMTIOD (day), monthly median time interval between symptom onset and diagnosis; eMeanT (°C): monthly mean temperature; fMaxT, monthly maximum temperature; gMinT (°C), monthly minimum temperature; hMeanDTR (°C), monthly mean diurnal temperature range; iMaxDTR, monthly maximum diurnal temperature range; jMinDTR (°C), monthly minimum diurnal temperature range; kMeanRF, monthly mean rainfall; lMaxRF (mm), monthly maximum rainfall; mMeanRH (%), monthly mean relative humidity; nMaxRH (%), monthly maximum relative humidity; oMinRH (%), monthly minimum relative humidity; p s.e.m., standard error of mean.
Cross-correlation analysis
The results of the cross-correlation function show that autochthonous DF incidence rates were significantly positively associated with MaxT, MTIOD, and MeanBI at 1–3 months lagged MA, with monthly imported DF cases at a lag of 1 month, with MinT and MeanT at 1–2 months lagged MA, with MaxDTR, MeanRH, MaxRH at a lag of 1 month. MinRH was positively associated with the DF incidence rates at a lag of 2 months (Fig. 3, Supplementary Table S1). There was no significant relationship between MaxRF, MeanRF, MeanDTR, MinDTR and autochthonous DF incidence rates (Supplementary Fig. S1, Supplementary Table S1).
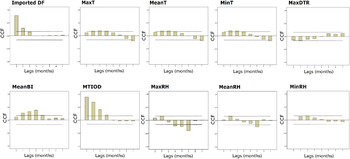
Fig. 3. Plots of cross-correlation function (CCF) between monthly DF incidence rates separately and mosquito density, diurnal temperature range, timeliness of diagnosis and meteorological variation during January 2001 to December 2013 in Zhongshan, China. The two dashed lines illustrate critical values for cross-correlation (at the 5% level).
The regression tree model
We calculated the lagged MA values with the significantly lagged orders based on the cross-correlation analysis. The significant factors from cross-correlation at the different time lags were used for the construction of regression tree models (Fig. 4). For the period 1 January 2001 to 31 December 2013, the regression tree model demonstrated MTIOD was the most important splitting factor contributing to DF incidence rates, with a threshold value of 4·15 days (Fig. 4). The model also showed that mosquito density was of greater importance than the meteorological factors temperature range. For example, the monthly incidence rates of autochthonous DF increased by 26·43-fold [relative risk (RR) 26·43, 95% confidence interval (CI) 11·74–41·13, compared to the average DF incidence rate during the study period] when the 2-month lagged MA of MTIOD was >4·15 days. In the right branch of the tree, the monthly autochthonous DF incidence rates increased by 36·02-fold (RR 36·02, 95% CI 25·26–46·78, compared to the average DF incidence rate during the study period) when the 3-month lagged MA of MeanBI was ⩾16·57 and the 1–2 months lagged MA of MTIOD was >4·15 days. MTIOD and MaxDTR were included in the left branch of the tree. If the 1–2 months lagged MA of MTIOD was between 1·11 and 4·15 days and MaxDTR at a lag of 1 month was <9·6 °C, the monthly mean autochthonous DF incidence rate increased by 14·67-fold (RR 14·67, 95% CI 8·84–20·51, compared to the average DF incidence rate during the study period). However, the other branch showed the autochthonous DF incidence rate increased by 3·06-fold compared to the overall monthly mean autochthonous DF incidence rate when the 1–2 months lagged MA of MTIOD was between 1·11 and 4·15 days and MaxDTR at a lag of 1 month was ⩾9·6 °C (RR 3·06, 95% CI 1·17–4·95) (Fig. 4).
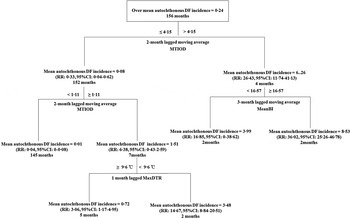
Fig. 4. Results of time-series classification and regression tree modelling the relationship between mosquito density, diurnal temperature range and the time interval between onset and diagnosis and monthly autochthonic DF incidence rates during the period January 2001 and December 2013 in Zhongshan, China. The regression tree shows the monthly mean autochthonic incidence rates of DF, the threshold values of the tree.
DISCUSSION
In this study, we explored the effect of potential risk factors such as timely diagnosis, mosquito density, and the meteorological factors on DF incidence rates in Zhongshan using time-series regression tree models. This study indicates that the timeliness of diagnosis, mosquito density, and temperature fluctuations played significant roles in the transmission of autochthonous DF in Zhongshan.
To some extent, the timeliness of diagnosis could reflect the sensitivity of the NIDRS run by the local CDC in China. The time interval between symptom onset and laboratory diagnosis contributed to the delay in reporting from the doctors to the surveillance system. The results of this study indicate that the early diagnosis of DF was the most important factor for reducing DF spread. We found that MTIOD was 6·044 days during the study period (Table 1). The threshold value of 4·15 days at a 1–2 months lagged MA of MTIOD is the most important factor in determining the monthly incidence rates of the autochthonous DF in Zhongshan.
Previous studies suggest that timeliness of diagnosis is associated with patients’ age, education, income, occupation, doctors’ skills and diagnostic methods [Reference Yoo30]. According to the current status of DF prevention and control strategies in China, several possible reasons related to the healthcare system and patients were considered as contributing factors to delayed diagnosis. First, the lack of specificity of clinical diagnosis and laboratory-confirmation facilities and health conditions of the basic community hospitals or primary healthcare departments can lead to the delay in diagnosis. Second, the social demography information of patients such as age, education, income, and occupation may impact on the timeliness for seeking the medical service. In our study, 59·14% of all the reported cases were people aged 20–40 years. Patients were most commonly employed in the transport, production, and agricultural industries. A portion of suspected cases who presented with a history of sudden onset fever might take antifebrile medicine themselves, instead of consulting a doctor at the hospital during the acute febrile phase, leading to underestimation or delayed diagnosis. Additionally, DF cases are not quarantined, which could increase the opportunity for mosquito–human DENV transmission by human movement during the incubation period [Reference Stoddard31]. Therefore, this study indicates that any delay in diagnosis and notification of cases increases the risk of introducing the virus into mosquitoes and driving autochthonous transmission [Reference Simmons3].
A number of changes need to be implemented to improve detection and to facilitate prevention and control in the community. First, clinical guidelines and management strategies for early monitoring and diagnosis of DF need to be improved. Professional education and training of the clinical doctors, nurses and other healthcare workers with respect to diagnosis of DF cases should be widely implemented. Second, increased explorations of feasible and low-cost methods for early diagnosis are required for basic medical units. The NS1-based test as a rapid screening tool is utilized for the early diagnosis of DF, although the accuracy and variance between the primary and secondary infections of the NS1 test for early diagnosis of DF infection still needs to be enhanced in basic healthcare departments, the method's value remains [Reference Thomas32]. Third, effective public health education for the population, especially for those at high risk needs improvement. Finally, customs officers should be involved in the prevention of epidemics; customs officers are often the first contact with imported cases.
Short-term temperature fluctuations were observed to be positively associated with autochthonic DF transmission in our study. These findings are consistent with previous studies [Reference Delatte11, Reference Paaijmans33]. Temperature is critical to the survival of the adult female Aedes mosquito and to virus transmission. Recent studies have explored the interaction between temperature fluctuations and mosquito-borne flavivirus transmission [Reference Lambrechts13, Reference Paaijmans33]. A previous study found that larger diurnal temperature fluctuations could have a negative effect on vector survival for mosquitoes [Reference Paaijmans, Read and Thomas12]. Moderate fluctuations in temperature (10 °C) would increase DF risk in the higher DF transmission season [Reference Lambrechts13]. Temperature could influence the EIP of Aedes mosquitoes. Carrington et al. [Reference Carrington34] showed that the large DTR might reduce DENV susceptibility and extend the EIP of mosquitoes. Our study indicates that when MaxDTR, at a lag of 1 month, was <9·6 °C and the 1–2 months lagged MA of MTIOD was 1·11–4·15 days, the autochthonous DF incidence rate was 14·67-fold higher than the average autochthonous incidence rate of DF. The small DTR might be the key risk factor in DF transmission due to increased longevity, midgut infection rates and shortened EIP of Aedes mosquitoes compared to the large temperature fluctuations or constant temperature [Reference Carrington34].
The main vector species for DF in China is A. albopictus [Reference Wu35]. Although DF transmission depends directly on female mosquitos, traditional larval indices such as BI are still widely used for the entomological surveillance during epidemic periods [Reference Tun-Lin36, Reference Focks37]. In a study conducted in Vietnam, Pham et al. showed that there was a linkage between mosquito indices and DF incidence rate [Reference Pham38]. A Brazilian study identified that Aedes larval indices and rainfall could enhance DF outbreaks [Reference Pontes39]. The time-lag effect between peak larval mosquito density and peak incidence rates of DF outbreaks was about 1 month [Reference Pontes39]. We found the monthly autochthonous incidence rates of DF to be significantly positively correlated with the MeanBI at lags of 1–3 months (Fig. 3). Monthly autochthonous DF incidence rate increased by 36·02-fold when the 3-month lagged MA of the mean BI ⩾16·57 and the 2-month lagged MA of MTIOD was >4·15 days (Fig. 4). BI, as a predictor to identify high-risk areas for DF transmission, was evaluated in Havana, Cuba [Reference Sanchez40]. This study showed BI ⩾16·57 to be a significant predictor. The threshold effects of A. albopictus density in our study were different from other studies [Reference Sanchez40, Reference Focks41], which might be explained by ecological factors. Additionally, climate change, global travel, herd immunity, DENV serotypes, and timeliness of diagnosis would be possible factors to influence the relationship between the Aedes density and DF transmission risk [Reference Huang42, Reference van Panhuis43].
This study demonstrated the hierarchical interactions between predictors of DF using the time-series regression tree. It evaluated the relevance among the time interval between symptom onset and diagnosis, diurnal temperature fluctuations, mosquito density and autochthonic DF incidence rates in China using a time-series regression tree model construction. It suggests that the assessment of threshold effect of the important risk factors of DF and the implementation of management control measures could be attributed to DF transmission. Regression tree models can provide a non-parametric approach that can potentially better accommodate these complex interactions since they avoid some of the assumptions associated with linear regression [Reference De'ath44].
In our previous study, we also compared the outcomes of the Bayesian CART model, with those of the traditional CART model. The analyses indicate that the nature and magnitude of the effect estimates were similar for the two methods [Reference Hu45]. Additionally, we tested the autoregression (AR) term in the CART model. The results showed that the key environmental factors remain significant in the relationship in the model even if we included the AR term in the model. However, the goodness-of-fit analyses indicate that the model without the AR term had higher accuracy than the model with the AR term [model with AR term: root mean squared error (RMSE)=0·528; without AR term: RMSE=0·356]. As the study aimed to assess and select the key environmental factors we did not include the AR term in the non-parametric model.
We suggest that local public healthcare departments should invest further in DF health education, enhance laboratory diagnostic services, focus more on Aedes mosquito density, and improve the sensitivity and specificity of surveillance systems, focused on both vectors and patients.
There were, however, a number of limitations to this study which need to be acknowledged. First, monthly data were used in the study. Weekly data would be better to assess the relationships between weather, mosquito density, and DF. Unfortunately, in this study, weekly data on mosquito density were unavailable. Second, the potential risk factors (herd immunity, human behaviour, virus strain and mosquito survival rate) were not included in the analysis as they were not available. It is suggested that the rapid and community-based diagnostic methods for decrease of DF infection and the spread in the mosquito–human interface are needed in future studies. Third, we did not evaluate the lifespan of larvae and the mosquito–human contact rate, thus the analysis was on the basis of a hypothesis that there was a positive correlation between mosquito density, biting rate, and infection rate. This study was an ecological study, which applied links between the risk factors and outcome of the diseases based on the population. Further research is needed to determine the possible causal association between the factors and DF incidence rates.
CONCLUSION
In this study, time-series regression tree models were used to assess and predict the risk of DF. We emphasize that timeliness of diagnosis, mosquito density, and diurnal temperature fluctuation play key roles in autochthonous DF transmission. MTIOD was determined to be the most critical factor in the assessment of the risk of DF transmission and the implementation of management control measures. Public health departments in China should pay more attention to mosquito control. The threshold effects of meteorological variation such as MaxDTR may be considered as a predictor of DF incidence rate. We conclud that the threshold effect of timeliness of diagnosis, mosquito density and diurnal temperature fluctuation examined in the time-series regression model could be used to predict and assess the risk of DF epidemics, and the factors identified is this study can benefit the early warning infectious diseases surveillance system.
SUPPLEMENTARY MATERIAL
For supplementary material accompanying this paper visit https://doi.org/10.1017/S095026881600265X.
ACKNOWLEDGEMENTS
We greatly acknowledge the contribution of Mr Yanheng Wu, Ms. Wuyang Shi, Ms. Jinsi Lin and other clinical, laboratory of the Zhongshan CDC. The collaboration of data has benefited from the support of Mr Le Luo, Ms. Xueqin Chen who assisted in collecting data in Zhongshan, China. We thank Dr Gabriel J. Milinovich from the Queensland University of Technology, Australia for valuable comments on the manuscript. We also thank the Australia China Centre for Public Health (ACCPH) for supporting the project. Dr. Wenbiao Hu was supported by an Australian Research Council Future Fellowship (FT140101216).
This work was supported by the National Natural Science Foundation of China (NSFC) (grant no. 81373050, 81172735 International Program for Ph.D. Candidates, Sun Yat-Sen University, China (grant no. 02300-18814201).
DECLARATION OF INTEREST
None.


