


Introduction
The ongoing Flint water crisis has revealed many environmental and public health problems stemming from poor water infrastructure, including the rise in Legionnaires’ disease caused by waterborne bacteria, legionella. While the main focal point of Flint investigations has been the lead poisoning of county residents, there was also a simultaneous outbreak of 87 cases of Legionnaires’ disease with 10 deaths in Genesse County, which includes Flint [1, 2]. Legionellosis, which includes Legionnaire's disease, demonstrates seasonal and geographic variability and is on the rise worldwide. Surveillance systems established to track legionellosis disease across Europe, North America, New Zealand, Australia and other countries are reporting increasing trends [3–6]. Between 1991 and 2012, the Australian Department of Health reported a two-thirds increase in legionellosis cases [6]. In the USA, during 2000–2014, crude incidence of legionellosis increased by approximately 300%, from 0.4 to 1.6 reported cases per 100 000 population [Reference Adams7, 8].
Legionnaires’ disease and Pontiac fever are the two most common forms of legionellosis, a nationally notifiable disease in the USA. Legionnaires’ disease causes severe pneumonia requiring hospitalisation, while Pontiac fever is generally presented as a flu-like illness and often resolves on its own. Thus, it is highly unlikely that hospitalisation records capture Pontiac fever cases. The Centers for Disease Control and Prevention (CDC) require reporting of all common forms of legionellosis, including Legionnaires’ disease and Pontiac fever, but publicly available data do not distinguish between the two. To assess the epidemiology and increased incidence of legionellosis, the CDC recommend a combination of passive and active surveillance. There are two CDC national surveillance systems: the National Notifiable Diseases Surveillance System (NNDSS) established in 1976 and the Supplemental Legionnaires’ Disease Surveillance System conducted from 2011 to 2015 [Reference Dooling9, 10]. Outbreaks of legionellosis are reported through the Waterborne Disease Outbreak Surveillance System (WBDOSS), established in 1971. Monitoring of waterborne legionellosis outbreaks began in 2001. Since then legionella has been recognised as one of the most prominent aetiologic agents associated with waterborne outbreaks, being responsible for 66% of all outbreaks in 2011–2012 [Reference Beer11].
Although the specific causes for the increase in legionellosis cases are still unknown, potential factors include improved diagnosis and reporting [Reference Farnham12], ageing of the national water infrastructure [Reference Garrison13] and an ageing population [8]. Legionellosis occurs through inhalation of water aerosol contaminated by legionella, a pathogen that can live in organic matter attached to pipe inner surfaces [Reference Bartram14, Reference Fields, Benson and Besser15]. Amoebae growing in the water supplies act as the site of replication of legionella. However, it is not clear what occurs in plumbing sludge, since legionella can grow in biofilms that have a mixture of bacterial species. Water contamination occurs in the piping distribution systems of hot tubs, pools, showers, baths, humidifiers, mist and cooling equipment [Reference Phin16]. Older people (aged 50+), smokers and people with underlying medical conditions, such as diabetes and immune system disorders, are reported to be susceptible to infection [Reference Phin16]. Environmental risk factors include ageing water infrastructure and poor maintenance of complex water systems in hospitals and long-term care facilities [Reference Garrison13, Reference Bartram14, Reference Soda17]. A recent study indicates that the removal of sinks from patient rooms and introduction of a method of ‘water-free’ patient care has been associated with a significant reduction of patient colonisation with Gram-negative bacteria, especially in patients with a longer intensive care unit length of stay [Reference Hopman18].
Meteorological factors are shown to be associated with the seasonal increase in disease incidence [Reference Beaute19, Reference Cunha, Burillo and Bouza20]. Legionella bacteria thrives in a specific temperature range, 25–45 °C [Reference Bartram14, Reference Fields, Benson and Besser15]; and reports from surveillance of legionellosis point out the seasonal nature of infection. The peak of reported legionellosis cases usually occurs in late summer to fall, which is potentially linked to warmer, higher relative humidity and wetter weather conditions [8, Reference Phin16, Reference Beaute19, Reference Fisman21–Reference Simmering24]. Additional testing during the non-typical pneumonia season and the use of cooling towers during the summer are also offered as an explanation of seasonal rise [Reference Fields, Benson and Besser15]. Characterisation of the seasonality of legionellosis, while well documented, has been typically limited to a simple description of the month with high incidence. The highest number of cases were reported in June–October in the USA [8], July–August in Canada [5], August–November in Europe [3] and March–May and September–November in Australia and New Zealand [Reference Graham4, 6, Reference Phin16, Reference Li, O'Brien and Guest25]. Characterisation of seasonal patterns, in terms of peak timing and amplitude, is essential to investigate the underlying reasons for changing epidemiology of infection. A shift in seasonal peak timing and amplitude points to a potential alteration in risk factors that affect disease incidence, including the probability of exposure and environmental triggers that promote pathogen growth. Our early work has demonstrated the potential to gain insight into the aetiology of ill-posed infections by quantifying their seasonal characteristics and comparing to the seasonality of well-documented infections [Reference Chui26].
The surge in legionellosis has been most noted since 2003 [Reference Neil and Berkelman27], which is alarming given the significant morbidity and mortality of legionellosis. Approximately 9% of legionellosis cases are fatal and 40% require intensive care [Reference Dooling9]. Elderly patients (aged 65+) with pneumonia caused by Legionella pneumophila have a higher frequency of underlying comorbidities and thus high cost of care [Reference Sopena28]. We determined that between 1997 and 2006, there were approximately 8000 hospitalisations due to Legionnaires’ disease in US residents aged 65+, representing approximately $340 million in annual charges to Medicare [Reference Naumova29]. Passive surveillance systems are believed to under-report disease incidence, especially of non-mandatory infections [8]. Our early work has illustrated an approach to link surveillance and hospitalisation records to assess the degree of agreement between two data sources [Reference Mor30]. By comparing the number of reported cases with the number of hospitalised cases for the same infection, we identified municipalities that significantly deviated from the typical experience in the state and might be under-ascertaining cases [Reference Mor30]. Since legionellosis is a nationally notifiable disease, cases reported to the national surveillance system should exhibit strong concordance with hospitalisation records. The Centers for Medicare and Medicaid Services (CMS) maintain records of all the hospitalised Medicare patients nationwide and include information on approximately 96% of the US elderly population [Reference Fisher31, Reference Cohen, Chui and Naumova32].
The objectives of this analysis are to assess and compare the seasonal patterns of legionellosis in the USA using two national databases. We first created a monthly time series from 1993 to 2015 of cases of legionellosis using publicly available yearly reports from the CDC's NNDSS, and from 1997 to 2006 of medical claims of hospitalisation due to legionella in older adults from CMS databases. To examine the trend, seasonal peak timing and amplitude, we split the study time interval into two segments (before and after 2003), and applied a Poisson harmonic regression model to each data and each segment of the time series. Peak timing estimates and their confidence intervals were derived from the model regression parameters using the δ-method [Reference Naumova, MacNeill, Auget, Balakrishnan, Mesbah and Molenberghs33]. National surveillance provides continuous and ongoing data that enable a detailed analysis of changes in trend and seasonal patterns over time, and allow us to compare such patterns with trends observed in the highly susceptible elderly population.
Methods
CDC: surveillance records
We abstracted reported cases of legionellosis from the CDC's yearly NNDSS summary reports from 1993 to 2015. These publicly available reports feature the official statistics for notifiable diseases, and include counts, rates, age distribution by groups, and counts by state and territory. Monthly legionellosis disease counts are only available for the entire USA, while disease counts by age group are only available by year and not by month. Thus, we focused on disease counts available by month and year, and by year and age group.
We abstracted disease counts by month and created a monthly time series from 1993 to 2015. Year 2004 had information on total cases and reported age, but not on reported cases by month. We interpolated monthly counts for 2004 based on reported monthly cases of adjacent years (2003 and 2005), and on total 2004 cases. First, we averaged monthly disease counts for years 2003 and 2005 to obtain unadjusted estimates of monthly disease counts for 2004. Then, we calculated the adjusted monthly disease counts using equation 1:
 $$Y_{i,\; \; 2004} = \displaystyle{{Y_{i,{2004}_{{\rm unadj}}}} \over {\mathop \sum \nolimits_{i = 1}^{12} Y_{i,{2004}_{{\rm unadj}}}}} \times Y_{{\rm Total},2004},$$
where Y i,2004 and  $Y_{i,{2004}_{{\rm unadj}}}$ are the adjusted and unadjusted 2004 disease counts for month i, respectively; and Y Total,2004 is the total number of CDC reported cases for 2004. We then rounded the adjusted 2004 disease counts to the nearest integer.
We used time series and calendar plots to explore disease count distribution by month (Figs 1 and 2). We used monthly proportions of reported cases for a given year to construct a calendar plot illustrating the variability of yearly reported cases. Disease counts were converted to monthly proportions for a given year using equation 2:
 $$\; \; P_{i,j} = \displaystyle{{Y_{i,j}} \over {\mathop \sum \nolimits_{i = 1}^{i = 12} Y_{i,j}}} \times 100\; \%, $$
where P i,j is the percentage of disease counts for each month i based on the total for year j, and Y i,j is the disease incidence for month i and year j.
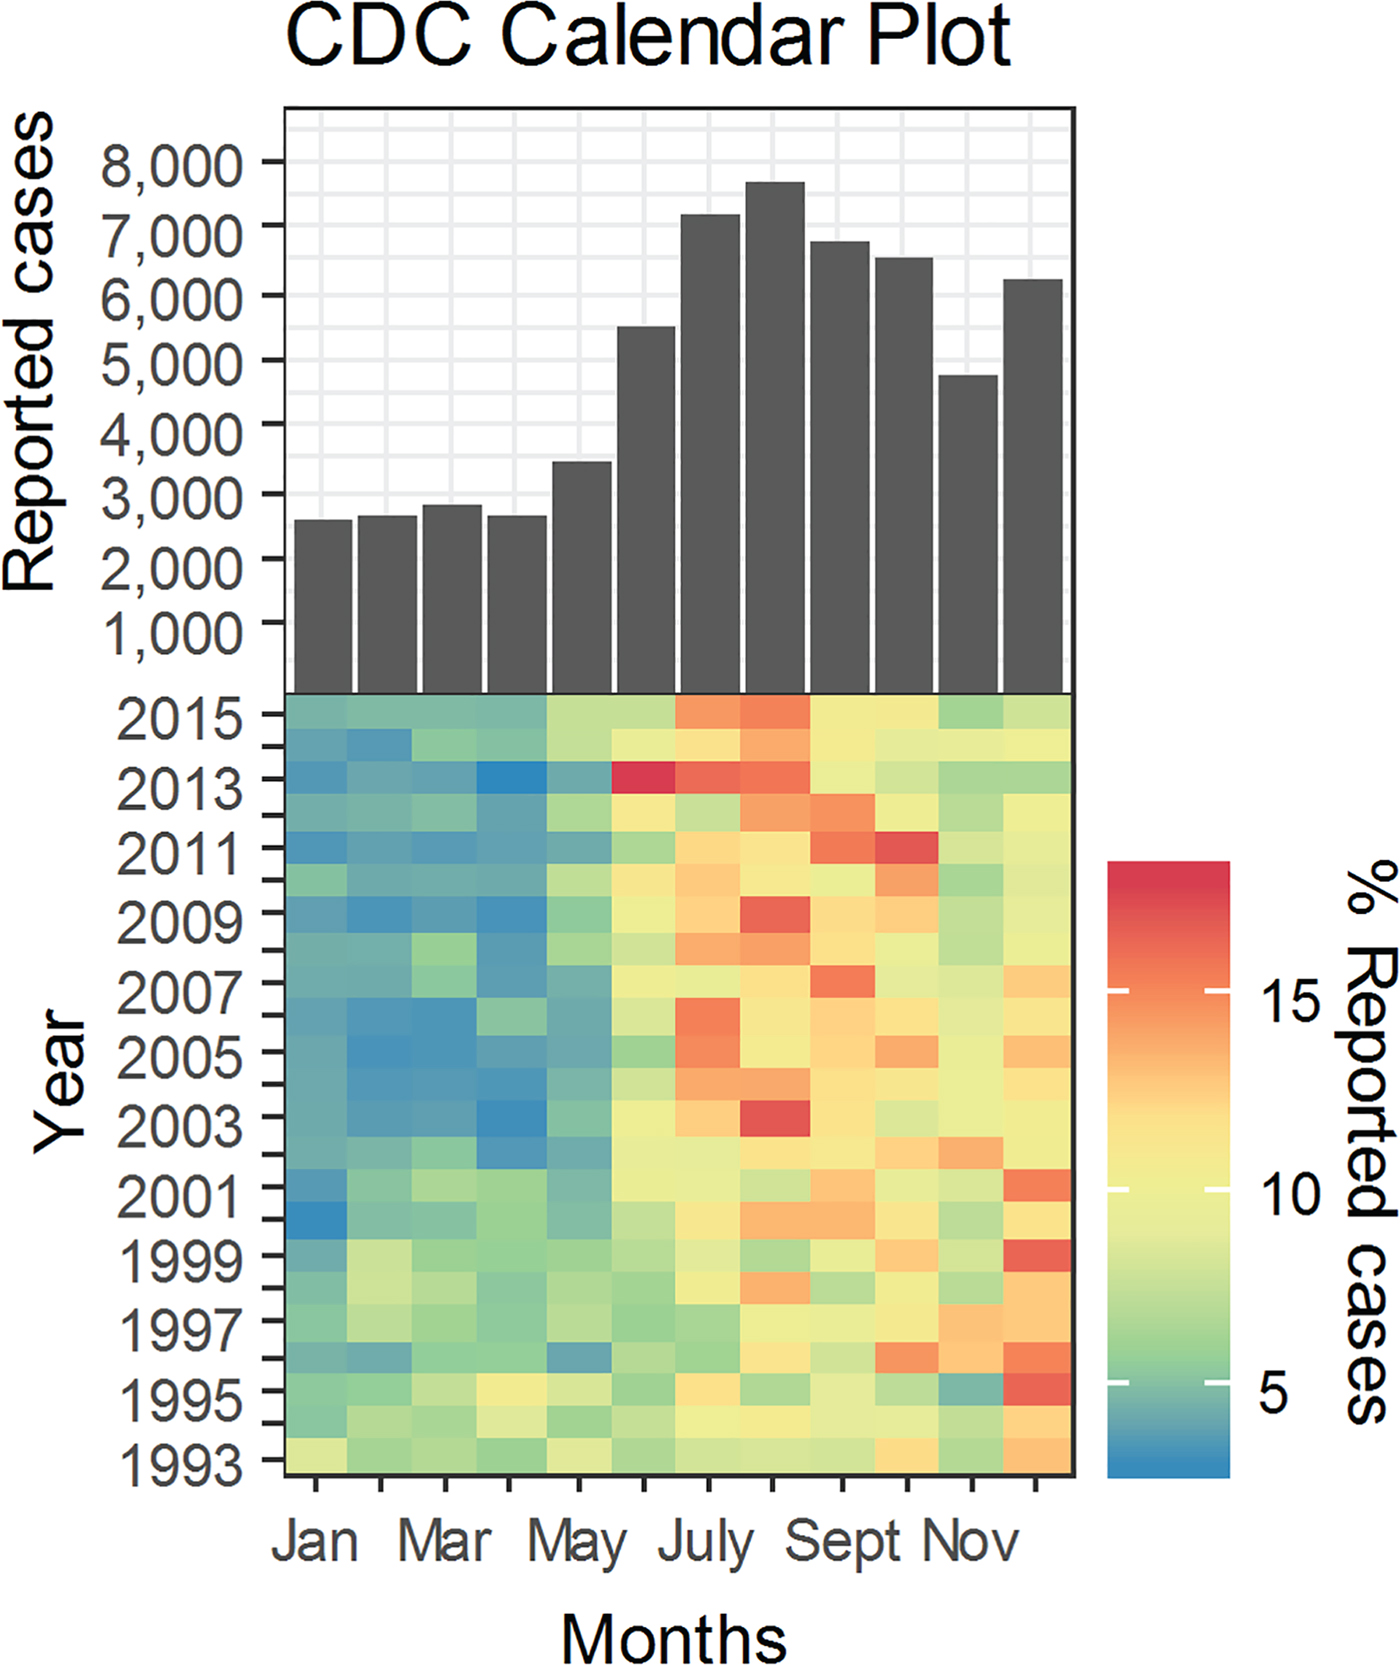
Fig. 1. Histogram and calendar plot of legionellosis cases reported to the Centers for Disease Control and Prevention from January 1993 to December 2015. Cool to warm colour scale represents a low to high scale of monthly per cent of reported cases. Low monthly percentage of yearly reported counts is represented by a dark blue tone with red symbolizing the other end of the scale.
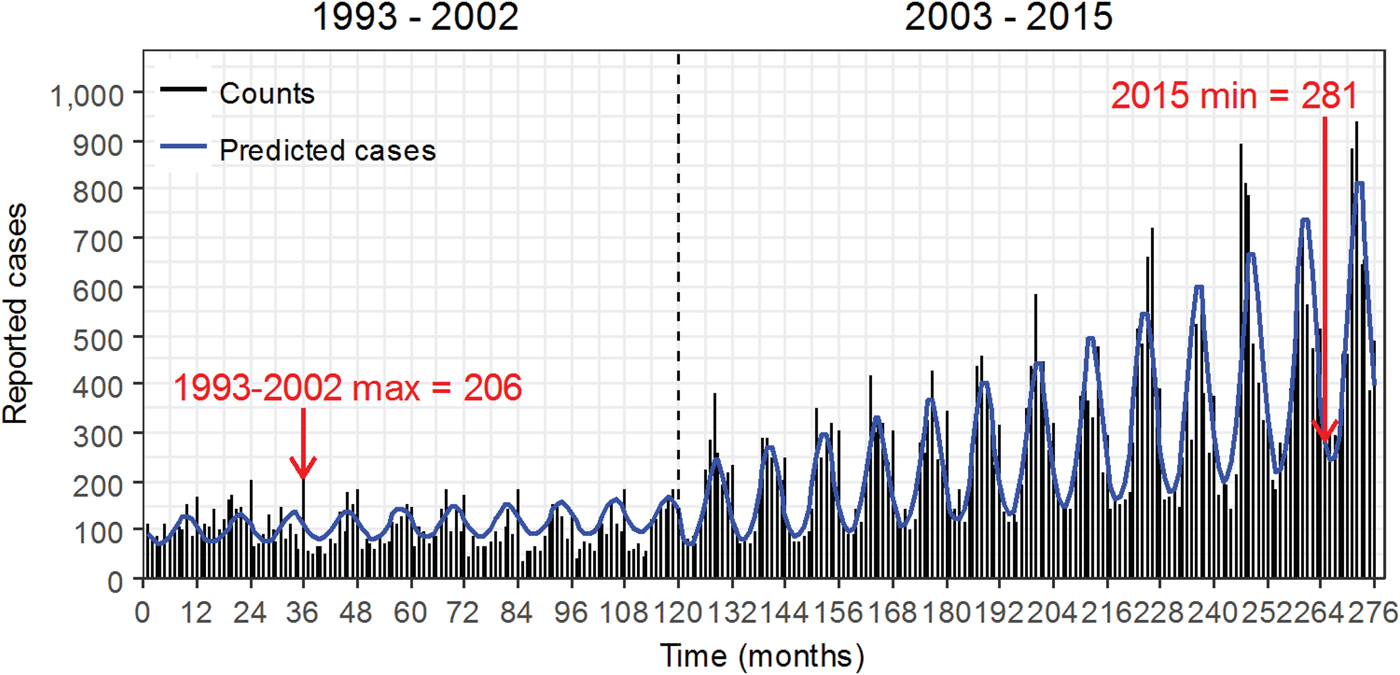
Fig. 2. Monthly time series of reported cases of legionellosis from the Centers for Disease Control and Prevention with model results superimposed as a solid blue line. The dashed vertical line at December 2002 marks two periods.
To estimate the contribution of disease cases that occurred in older adults, we reviewed age distributions in publicly available CDC reports. Abstraction of disease counts by year and age group from 1993 to 2015 revealed inconsistencies with age grouping. Age categorisations contained 11 groups in 1993 and 1994: <1, 1–4, 5–9, 10–14, 15–19, 20–24, 25–29, 30–39, 40–49, 50–59, 60+. In 1995, age categories were re-classified as: <5, 5–14, 15–24, 25–44, 45–64, 65+, and a new category ‘age not stated’ was introduced. Starting in 1996, age categories were again re-classified as: <1, 1–4, 5–14, 15–24, 25–39, 40–64, 65+ and ‘age not stated’. Table S1 shows the misalignment in age categories between time periods 1993–1994, 1995 and 1996–2015. We examined the contribution of each age category to the total number of reported cases of legionellosis for years that had consistent age categories (1996–2015). Age categories <1, 1–4, 5–14, 15–24 and 25–39 combined constituted no more than approximately 15.5% of the total reported cases and were thus aggregated to a single age category 0–39. Age categories 40–64 and 65+ accounted for most cases each year and were thus kept as their own categories. Figure 3 shows the yearly age distribution of reported legionellosis cases for the three age categories (0–39, 40–64 and 65+). By re-aligning the age categories, we determined the counts associated with older adults to enable proper comparison with CMS data. To calculate reporting rates in disease counts per 100 000 population, we used CDC yearly population estimates [34].
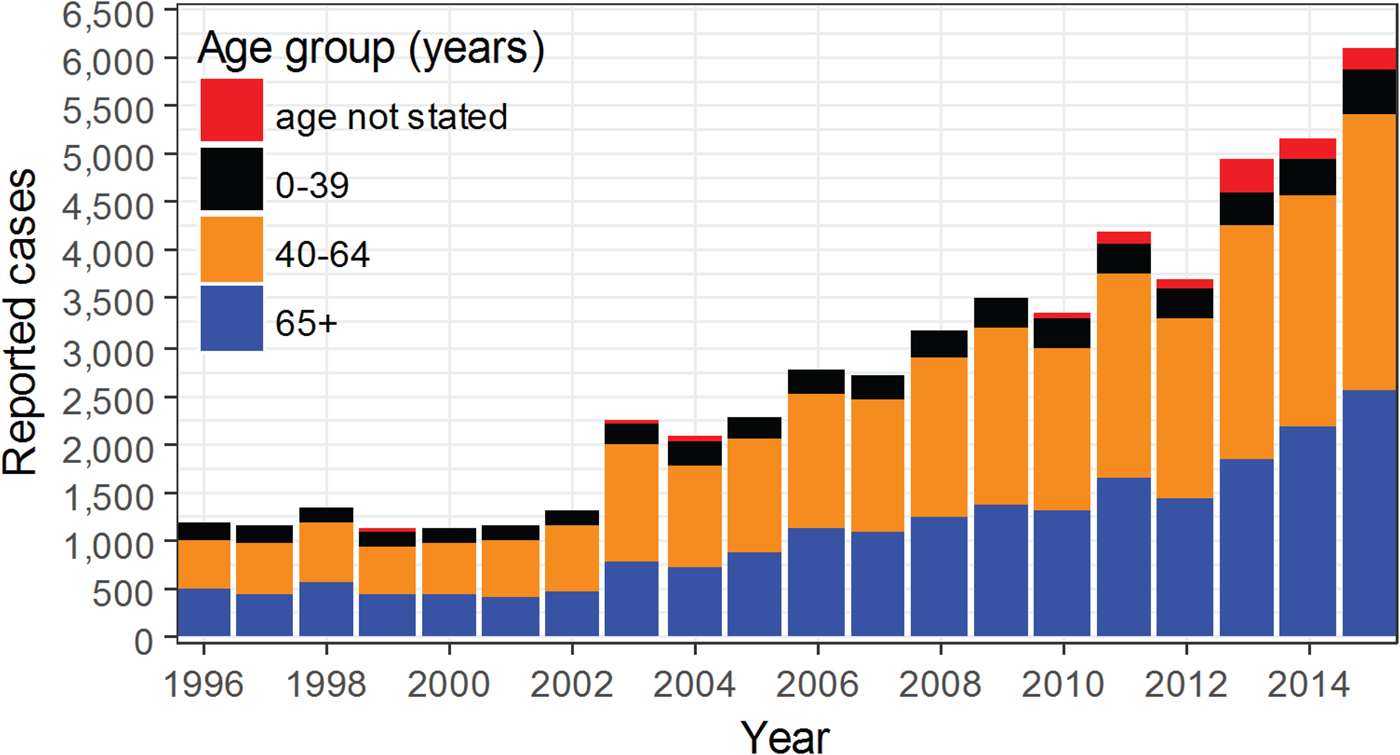
Fig. 3. Trend by age groups of reported legionellosis cases from the Centers for Disease Control and Prevention from years 1996 to 2015.
CMS: hospitalisation records
CMS is the national data repository of medical claims and offers a universal, uniform, and near-exhaustive coverage of US Medicare beneficiaries aged 65+. We abstracted hospitalisation records from CMS using International Classification of Disease, Ninth Revision, Clinical Modification (ICD-9-CM) code 482.84 reported in primary or secondary diagnostic fields during a 16-year period, from 1 January 1991 to 31 December 2006 [Reference Naumova29]. Adoption of the 482.84 code for legionellosis was not widely used until mid-year 1997, with only one case of legionellosis being recorded between 1991 and 1997. The first hospitalisation record occurred in July 1997 and most likely does not reflect the true occurrence of legionellosis for this year but a transition in coding scheme. Thus, we only used records from January 1998 to December 2006 in this analysis. To construct the time series, we aggregated records of hospitalisation cases of legionellosis for beneficiaries 65+ by month of hospital admission. To calculate hospitalisation rates in disease counts per 100 000 population, we used CDC yearly population estimates for older adults (65+) [34].
To characterise the level of agreement between CMS hospitalisation cases and CDC reported cases for the age category of 65+, we calculated an index of reporting discrepancy (IRD) for each year using equation 3:
 $$\hbox{IRD} = \log \displaystyle{{N_{{\rm CDC}\_65 +}} \over {N_{{\rm CMS}}}},$$
where  $N_{{\rm CDC}\_65 +} \; $ and N CMS are the CDC and CMS cases, respectively. The index approaches 0 when the number of CDC and CMS cases are similar. A negative IRD indicates that reported CDC cases are lower than CMS cases; and when CDC cases exceed CMS cases, IRD values are positive.
Statistical model
Visualisation of the CDC time series showed two time periods with different patterns for trend and seasonality (Fig. 1). Trend and the amplitude of seasonal variations appear constant through December 2002; the increase in both trend and amplitude become notable starting January 2003. This apparent difference in trend marks two time segments, period 1 and period 2, best captured by a segmented regression model with the break point at 2003, in combination with harmonic terms describing the cyclic seasonal pattern of counts represented by the Poisson distribution. Thus, we defined the segmented Poisson harmonic regression model [Reference Chandy35] in equation 4:
 $$\eqalign{\hbox{ln}\lpar {E\lsqb {Y\lpar t \rpar } \rsqb } \rpar =\;& \beta _{{\rm inter}} + \; \beta _{{\rm tren}{\rm d}_{\,p1}}t_{\,p1} + \beta _{{\rm co}{\rm s}_{\,p1}}\cos \lpar {2\pi \omega t_{\,p1}} \rpar \cr &+ \; \beta _{{\rm si}{\rm n}_{\,p1}}\sin \lpar {2\pi \omega t_{\,p1}} \rpar + \beta _{{\rm tren}{\rm d}_{\,p2}}t_{\,p2} \cr & + \beta _{{\rm co}{\rm s}_{\,p2}}\cos \lpar {2\pi \omega t_{\,p2}} \rpar + \; \beta _{{\rm si}{\rm n}_{\,p2}}\sin \lpar {2\pi \omega t_{\,p2}} \rpar ,} $$
where Y(t) is the disease incidence at month t; β inter is the intercept reflecting counts at the break point (T break); β trend are the coefficients for trend with t p1 and t p2 representing time in month before and after T break, respectively; similarly β cos and β sin are the coefficients of the harmonic terms for each of two segments or time periods, p1 and p2, respectively; and ω = 1/M, where M = 12 is the length of the annual cycle in month.
We used equation 4 to model all available CDC data (1993–2015) and overlapping CDC and CMS data (1998–2006). Thus, we produced the three regression models: (1) CDC data from 1993 to 2015, (2) CDC data from 1998 to 2006 and (3) CMS data from 1998 to 2006.
Calculation of peak timing and amplitude
Estimates for peak timing and its confidence interval were derived from the model regression parameters for periods 1 and 2 using the δ-method [Reference Naumova, MacNeill, Auget, Balakrishnan, Mesbah and Molenberghs33]. Table 1 shows the corresponding equations. Using the regression model and peak timing estimates, we calculated values for peak incidence in each period. Values for nadir were estimated with the time reference of 6 months before or after the peak timing estimate. Amplitude was calculated as the ratio between peak and nadir values for the beginning of the time series (T start) and at the end of the time series (T end). Amplitude for the breakpoint, T break, was calculated as the average of the two amplitudes surrounding the breakpoint. This approach allowed us to compare the changes in amplitude from the beginning, through the breakpoint, to the end of the time series for each dataset.
Table 1. Description of equations used in estimating the peak timing
Results
The monthly distribution of reported legionellosis cases from the CDC is shown in Figure 1 as a histogram aligned with the calendar plot through a shared axis. The histogram shows the monthly reported cases across the entire time period (1993–2015). The majority of cases were reported from June onward with the highest values in August and a distinct increase in December. The calendar plot shows the relative contribution of monthly cases to the total number of cases reported within a given year. Similarly to the histogram, the calendar plot shows the majority of cases between June and October. Closer inspection of the calendar plot and monthly contribution of cases (Table 2) reveal that the frequency of reported cases in December was high in period 1 (1993–2002) and declined by 3.7% in period 2 (2003–2015). In period 2, most cases were reported in July and August. Between periods 1 and 2, the frequency of reported cases increased by 3.7% in July and 3.5% in August (Table 2). Consistently through the 21 years of data, January to May have the least number of cases of legionellosis.
Table 2. Summary of monthly contributions of cases during two time periods
*Significant (by analysis of variance).
Figure 2 shows time series of monthly legionellosis counts with the two distinct time periods indicated by the vertical dashed line. There is a clear change in trend and an amplitude increase in period 2 (2003–2015) compared with period 1 (1993–2002). Predicted cases derived from the regression model indicate peaks and valleys in both time periods with a steady trend and amplitude in period 1 and an increase in trend and amplitude in period 2.
Results from the regression models are shown in Table 3 as the estimates of per cent change in disease counts per month and peak timing for periods 1 and 2. Trend in reported cases is more pronounced in period 2 with an average 0.835% change in disease counts per month as compared with 0.258% for period 1. The average peak timing of reported cases shifted from mid-September (9.676 months, 95% CI 9.512–9.841) in period 1 to mid-August (8.452 months, 95% CI 8.410–8.495) in period 2 with more defined peaks as evidenced by narrower confidence intervals (Table 3, Fig. 5).
Table 3. Summary of trend and peak timing estimates for reported legionellosis cases by the CDC during 1993–2015
We examined the contribution of each age category to the total number of reported cases of legionellosis for years that had consistent age categories (Table S1). For CDC 1996–2015 data, adults older than 40 years old (40–64 and 65+) represented the largest age group in reported cases for all years. The marked rise in reported cases after 2002 is consistently concentrated among individuals over 40 years old (Fig. 3).
Table 4 shows the annualised age distribution for CDC records for time period 1 (1993–2002) and period 2 (2003–2015), and for CDC and CMS records for the two overlapping time periods (1a: 1998–2002 and 2a: 2003–2006). Legionellosis cases identified in hospital settings exceed the number of cases reported to the CDC for the age category of 65+ in all years except for 1997, 2003, 2004 and 2006. This lower reporting of CDC 65+ cases as compared with CMS cases is reflected in the negative IRD values, which range from −0.022 to −0.318. Since 1998, there has been a decrease in negative numbers with IRD becoming positive in 2003, 2004 and 2006. From 1998 to 2002, the ratio of CMS hospitalisation cases to total CDC legionellosis cases ranged from 45.0% to 82.7%. In 2003 and 2004, this ratio was at its minimum (<20%), but rose again in 2005 with a slight decrease in 2006.
Table 4. Reported CDC cases and CMS hospitalisation cases by year and 65+ age category
Similarly to the CDC data, CMS records exhibited a change in the trend and seasonal patterns of legionellosis between the two time periods. CMS counts show a downward trend from 1998 to 2002 and an upward trend starting in 2003 (Fig. 4). The downward trend is also captured in model results with a negative per cent change in legionellosis counts per month (Table 5). In period 1a, 1998–2002, the average monthly counts of hospitalisation due to legionellosis declined by 1.925%. The peak timing was in late September (9.921 months), although the confidence interval ranged from late August to early November (95% CI 8.774–11.067). CDC data for period 1a also showed a peak timing in mid-September (9.397 months, 95% CI 9.206–9.589). In period 2a, we see better synchronisation of upward trends and peak timing between CMS and CDC records: both CMS and CDC records peak in August, 8.383 and 8.820 months, respectively, although the confidence interval of the peak timing for hospitalisation records is wider. Figure 5 summarises peak timing along with their confidence intervals for CDC periods 1 and 2, and CDC and CMS periods 1a and 2a. The widest confidence interval corresponds to period 1a hospitalisation records. Confidence intervals of peak timing for CDC records are narrower than for CMS records in all time periods. For both data sources, confidence intervals become narrower in the second time period (2 and 2a). Models for CDC data explained approximately 81% of data variability (85% for the 1993–2015 model and 78% for the 1998–2006 model). Variability explained for the CMS model was approximately 60%.
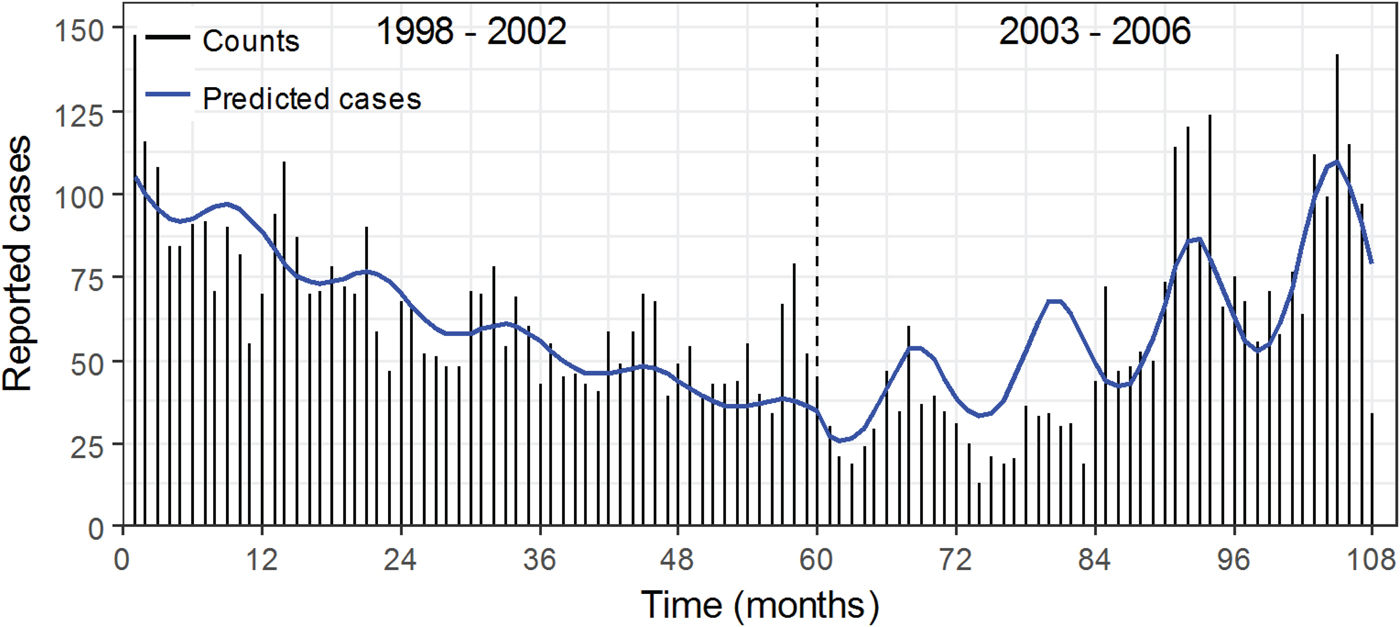
Fig. 4. Monthly time series of reported cases of legionellosis in older adults (65+) from the Centers for Medicare and Medicaid from January 1998 to December 2006 with model results superimposed. The dashed line at month 60 or December 2002 separates periods 1a and 2a.

Fig. 5. Peak timing estimates for pre- and post-periods for three models. The k timing estimates for pre- and post-periods for three models.
Table 5. Summary of trend and peak timing estimates for the reported legionellosis cases by the CDC and for the hospitalisation cases of older adults (65+) due to legionellosis from CMS during 1998–2006
Table 6 shows the predicted annual legionellosis counts and rates per 100 000 population, and the amplitude for the beginning and end of each time period as well as the breakpoint in 2003 for CDC records (1993–2015), and for years that had overlapping CDC and CMS records (1998–2006). The predicted disease counts and rates for CDC records, representing general population, show a sharp increase between 2003 and 2015 with cases and rates increasing by approximately 255% (1670–5925 counts) and 219% (0.578–1.843 counts per 100 000 population), respectively. Amplitude shows an increase of 97% (1.771–3.482) between 1993 and 2015. Amplitude also shows an increase between the beginning and the end of years that have overlapping CMS and CDC records; between 1998 and 2006, amplitude increased by 95% (2.082–4.054) for CDC reported cases and by 100% (1.034–2.070) for CMS hospitalisations due to legionellosis in older adults.
Table 6. Predicted disease counts with rates, and amplitude at the beginning (T start), breakpoint (T break) and end (T end) for each of two time periods

a CDC data include the entire population and CMS data only older adults (65+).
b To estimate reporting rates per 100 000, the total US population was used for CDC rates, and the population of older adults (65+) was used for CMS rates.
Discussion
Our study clearly indicates a notable shift of seasonal peaks in legionellosis from mid-September (9.676 ± 0.164 months) before 2003 to mid-August (8.452 ± 0.042 months) after 2003 along with a substantial increase in seasonal amplitude of 97% between 1993 and 2015. The shift in seasonal peaks before and after 2003 was also observed between 1998 and 2006 along with a seasonal amplitude increase of 100% in US older adults and 95% in the general population. While the seasonality of legionellosis has been documented, characterisation of seasonality has been typically limited to a simple description of the month with high incidence, which is often inconsistent, imprecise and lacks ability to formally compare seasonal variations. We applied an approach that extracts information on seasonality in a rigorous and systematic manner and enabled us to estimate seasonal characteristics, such peak timing and amplitude, and to compare the results across time periods and affected populations. The shift in disease peak towards mid-August is indicative of changes in epidemiology of disease transmission and must be communicated to health professionals, physicians, researchers, public, and policy and decision makers.
The study confirms that the incidence of legionellosis has been increasing in the USA since 2003. The rapid increase began in 2003 and continued through 2015 to reach 6079 cases and a rate of 1.89 cases per 1 000 000 population, a 360% and 312% increase, respectively. Reported cases of legionellosis to the CDC remained stable between 1993 and 2002 with an average of approximately 1260 cases reported each year at an average rate of 0.46 cases per 100 000 population. Our modelling predicts approximately 1551 cases in 2002 at a rate of 0.539 per 100 000 population, and approximately 5925 cases in 2015 at a rate of 1.843 per 100 000 population. This corresponds to an increase of approximately 282% in predicted cases and 242% in predicted rates.
The steady increase starting in 2003 observed across all age groups has been attributed to changes in test type and test performance for pneumonia-like diseases following the outbreak of SARS in 2003 [Reference Neil and Berkelman27]. Improved surveillance has been noted as a potential reason for the continued increase of legionellosis incidence across Europe [Reference Beaute19, Reference Rota36]. The Australian Department of Health has documented a sharp increase in reported legionellosis cases, from 122 to 382, between 1991 and 2012 [6]. Monitoring of waterborne legionellosis outbreaks began in the USA in 2001, which given a 1 year implementation window, could have resulted in the increase in cases reported to the CDC in 2003.
However, changes in seasonal characteristics of legionellosis are less likely to be the result of only improved reporting. Cases of legionellosis reported to the CDC showed the expected seasonal pattern of high incidence in late summer and fall and low incidence in winter, but peak timing, a fundamental characteristic of seasonality, changed. The peak timing shifted by a month starting in 2003 from mid-September to mid-August, which exceeds the typical legionellosis incubation period of 1–10 days [Reference Bartram14]. Table 2 shows that the highest number of cases was observed in December before 2003 and in August after 2003. We examined whether the shift in peak timing was solely due to the reduced number of cases in December as part of a sensitivity analysis (Table S2). We repeated the peak estimation for time series with December counts removed, and confirmed a peak in August for both time periods. This result suggests that the shift in peak timing from mid-September to mid-August after 2003 is driven primarily by the lower number of reported cases in December. Finding records of legionellosis outbreaks in December prior to 2003 proved challenging.
The observed shift in peak timing could be related to environmental drivers and summer travel. Fluctuations in seasonal peaks (September in 2011, October in 2012 and August in 2013) were observed in a study of surveillance records of legionellosis in England and Wales potentially due to weather conditions [Reference Ricketts23, Reference Naik and Phin37]. In 2013, approximately 31% of the reported cases of Legionnaire's diseases in England and Wales were associated with travel abroad, with India having the highest incident rate (7.56 cases per million visits), followed by Malta (6.54 cases per million visits) [Reference Naik and Phin37]. According to the World Health Organization (WHO), approximately 20% of the cases of legionellosis detected in Europe are travel-related [Reference Bartram14]. In the USA between 1980 and 1998, approximately 21% of cases of Legionnaire's disease from the CDC's passive surveillance system were travel-related [Reference Benin, Benson and Besser38]. The study unfortunately did not provide information destination and time of travel, and the publicly available CDC data do not have enough information to analyse such patterns properly. A systematic analysis of outbreaks and incidence of legionellosis is needed to determine the reasons for the shift peak timing on refined spatial and temporal scales.
There needs to be more attention to the shift in seasonal peaks to better understand underlying environmental drivers. Over time, we observed that the seasonal peaks became stronger: amplitude almost doubled and became narrower with an overall duration of about 2 months (Fig. 5). Alarmingly, the minimum monthly cases of legionellosis reported to the CDC in 2015 was 281, which exceeds the maximum monthly cases reported any time before 2003. These changes in seasonality of reported legionellosis suggest underlying causes that go beyond increased reporting. Changes in environmental factors that promote pathogen growth could be one of the causes. The Mid-Atlantic region experienced a sharp increase in legionellosis between May and September of 2003 along with record-breaking rainfall: the average monthly rainfall was 54% higher than historical averages for those months. In five Mid-Atlantic States, a 1 cm increase in rainfall was associated with a 2.6% increase in legionellosis incidence between 1990 and 2003 [Reference Hicks22]. An increase in temperature and rainfall as well as higher relative humidity have been associated with higher risk of Legionnaires’ disease [Reference Beaute19, Reference Fisman39]. These environmental factors could boost proliferation, transmission and potentially pathogen mutation. Shen et al., highlighted complex interactions among L. pneumophila, disinfectant residual and biofilms. Biofilms that develop under long-term disinfected conditions provide less protection for L. pneumophila as compared with those that develop under disinfectant-free conditions [Reference Shen40]. The efficacy of disinfectants depends on environmental conditions that often change seasonally or due to infrastructure failures. During the Flint water crisis, as the concentration of free chlorine in water delivered to Flint residents decreased, the risk of acquiring Legionnaire's disease increased by 80% per 1 mg/L decrease in free chlorine [Reference Zahran41]. Better understanding of the mechanisms that increase exposure and transmission of L. pneumophila might lead to opportunities for disease control and prevention.
With the growing segment of ageing and highly susceptible population, the observed trends of legionellosis are alarming due to its high morbidity and mortality [Reference Phin16]. While age composition of reported cases of legionellosis to the CDC remained mostly consistent over time, the increase in incidence since 2003 has not been the same for all age categories. Between 1996 and 2015, people 40 years and older had the largest disease burden, with older adults (65+) representing approximately 39% of all reported cases. Yet, most of the increase in incidence has been observed in people 40 years and older. Due to inconsistent age categorisation, we only analysed data after 1996. Frequent changes in age categorisation in CDC data (prior to 1996) create unnecessary confusion, which can be prevented by using a granular age scale for publicly available reports. Furthermore, the detailed analysis of age distribution at granular scale, enabled by new methodology most applicable for big data, allows researchers to early detect changes in patient profiles while still maintaining confidentiality [Reference Naumova29, Reference Cohen, Chui and Naumova32].
The increase in legionellosis since 2003 has been well documented, but public reports of disease trends rarely include information of quality of model fit, proper test statistics and interpretation of modelling results [6, Reference Beer11]. The increasing amplitude of seasonal peaks in reported legionellosis is startling. Yet, the assessment of seasonality of legionellosis in existing surveillance systems has been especially limited to oversimplified information on months with highest and lowest number of records, which mask temporal variations. Organisations responsible for surveillance, like the CDC in the USA, should strive for data harmonisation and proper reporting of seasonal characteristics of disease. Proper reporting will enable reliable comparisons across locations and times, and improve the analysis of temporal variations to enable forecasting of disease incidence, age distribution and emerging trends.
CMS hospitalisation records show somewhat similar patterns to CDC surveillance records with an increase in legionellosis incidence starting in 2003. From 2003 to 2006, predicted cases of legionellosis increased by approximately 110% (462–970 cases) and predicted rates by approximately 102% (1.295–2.610 cases per 100 000 population). Peak timing was not apparent prior to 2003, but then became more defined with narrower confidence intervals. CMS legionellosis cases declined during 1998–2002, which is inconsistent with the flat reporting depicted by the CDC records. This declining trend could be the result of changes in Legionnaire's disease diagnostics. Between 1980 and 1998, diagnosis by urine antigen testing increased from 0% to 69% while diagnosis by serologic testing decreased – the frequency of isolates other than L. pneumophila serogroup 1 decreased from 38% to 4% [Reference Benin, Benson and Besser38]. The authors of that study warned that the decrease in culture-based diagnosis limits the recognition of disease cases associated with other isolates and impairs outbreak investigation. CMS records exhibited a dip in cases in 2003 and 2004 with a noticeable lower number of predicted legionellosis cases as compared with reported cases (Fig. 4). These discrepancies are attributed to incomplete records in the available CMS dataset for 2003 and 2004, which is likely to represent a fraction of actual cases. While the similarities between seasonal patterns in legionellosis depicted by CMS and CDC provide strong support for the detected patterns, improving detection methods and quality of reporting is needed to better characterise seasonal change in pathogen ecology.
Worldwide, the primary cause of infection is inhalation of aerosols or aspiration of water contaminated with legionella bacteria, primarily L. pneumophila. Potting soil and compost contaminated with Legionella longbeachae also pose a risk for human infection, particularly in Australia and New Zealand [Reference Whiley and Bentham42]. A legionellosis outbreak associated with industrial cooling towers in New Zealand showed that nine out of 13 cases had evidence of infection with either L. pneumophila serogroup 1 or L. longbeachae serogroup 1 [Reference Thornley43]. Since both organisms were also isolated from the cooling towers, waterborne transmission of L. longbeachae was suggested but remains unproven. The authors of the study recommend not discounting waterborne transmission in investigations of L. longbeachae infection.
Comparison of CDC reporting for people 65 years and older with CMS hospitalisation cases reveals that in 6 out of 10 years (1997–2006) CMS records exceeded the CDC records by 46–522 cases, indicating potential under-reporting of legionellosis to the CDC. Inspection of the age-not-stated category in CDC shows that the differences between CMS and CDC 65+ were not misplaced in the age-not-stated category. This discrepancy in the number of cases between CDC and CMS suggests that not all cases of legionellosis diagnosed by the hospital-based laboratories are reported to the CDC. Those discrepancies have been decreasing since 1998, suggesting that reporting consistency across agencies is improving.
Conclusion
The development of predictive strategies for a complex infection such as legionellosis requires better understanding of microbial ecology in water systems, improved reporting of legionellosis and detailed analysis of seasonal changes. With the growing volume of electronic records, consistently and systematically collected over long time periods, the understanding and prediction of legionellosis trends and temporal variations could be substantially improved. Accurate characterisation of changes in legionellosis trend and seasonality and timely synchronisation and harmonisation of records collected by various agencies are essential to strengthen disease monitoring and inform potential interventions in a meaningful way.
Supplementary material
The supplementary material for this article can be found at https://doi.org/10.1017/S0950268818002182
Acknowledgements
Authors are thankful to Professor Ralph Isberg for valuable insights and suggestions.
Financial support
The use of Centers for Medicare and Medicaid Services hospitalisation records was enabled by the National Institutes of Health (NIH) grants R01-ES013171, U19-AI062627 and NO1-A150032. M.C. received salary support for data analysis and preparation of the manuscript from Tufts Post-Baccalaureate Research Program (PREP) grant funded by the NIH grant R25 GM066567.
Conflict of interest
None.


