

INTRODUCTION
Bovine tuberculosis (TB; caused by infection with Mycobacterium bovis) is primarily a disease of cattle, although other species, including badgers (Meles meles) in Ireland and the UK, can be infected. The annual incidence of TB in Irish cattle herds (the number of previously uninfected herds identified with infection during the year divided by the total number of uninfected herds present at the start of the year) is around 6% and has remained relatively stable for several decades (http://www.agriculture.gov.ie). Efforts to eradicate the disease have not been successful [Reference More and Good1]. Two large-scale field trials, the Four Area Project (FAP) in Ireland and the Randomized Badger Culling Trial (RBCT) in England, have shown that badgers contribute to the epidemiology of infection in cattle [Reference Griffin2, Reference Donnelly3]. In both trials, comparisons were made between large areas where badgers were proactively culled and reference areas where little or no culling was carried out. In the RBCT, reactive culling was associated with a measured increase in TB in cattle [Reference Donnelly4]. The RBCT has contributed to an intense national debate in England regarding the role of badger culling in the control of TB in cattle.
Emerging from the debate is the question of the distances at which badger sett to cattle herd transmission occurs and the scale at which badger culling is likely to be effective. This is also of importance regarding vaccine development and its evaluation in field trials. In the current study, our first aim was to examine the hypothesis that TB is spatially correlated in cattle herds, and to establish the range of correlation and the effect, if any, of proactive badger removal on this. We did this by using data gathered during two 5-year periods, before (1 September 1992 to 31 August 1997) and during (1 September 1997 to 31 August 2002) proactive culling, in lands of the FAP. Details of the FAP and study design can be found in Griffin et al. [Reference Griffin2]. We used logistic models that explicitly include spatial random effects, i.e. generalized linear geostatistical models (GLGMs) [5, chapter 4] to analyse the data. To date, spatial association of infection in cattle has been mainly studied using nearest neighbour methods [Reference Porphyre, McKenzie and Stevenson6–Reference Green and Cornell10]. However, unlike GLGMs, these methods do not allow for spatial variation in population density, do not take covariates into account, or do not establish the range of clustering. Our second aim was to compare TB incidence in cull (removal, i.e. treatment) to minimal cull (reference) areas, and to compare proactive cull areas prior to and during proactive cull periods, as in [Reference Griffin2] but taking possible spatial correlation into account. As discussed previously [Reference Clifton-Hadley11], herds in the same area cannot be considered truly independent, since local spread of infection is known to occur.
MATERIALS AND METHODS
Cattle and badger population structures
The matched removal and reference areas in four different geographical regions in Ireland where the FAP was conducted are shown in Figure 1. Herds that had all their land contained in these areas as in [Reference Griffin2], are included in the analysis. This was done to minimize the impact of events unrelated to the areas of interest. Twenty-four percent of herds were excluded based on this criterion. However, the land owned by the remaining 76% of herd owners accounted for 71% of all land within the project areas. The excluded herds were not clustered; they were, however, located mainly near study boundaries. A farm could consist of several non-contiguous land parcels which we represented as a single-point location – the centroid of the largest parcel. The entire dataset consisted of 3530 herds with 12 498 land parcels. A total of 1776 herds (50%, ranging from 41% in Cork to 63% in Kilkenny) had non-contiguous land parcels (4992 or 40% of parcels). The median distance to the centroid for the non-contiguous parcels was 1·4 km (quartiles: 0·8 km and 2·6 km, similar across counties) and they comprised 23·6% of the total area of the farms (ranging from 16% in Cork to 28% in Kilkenny). The choice of centroid has the disadvantage that distances between herds are based on these locations rather than based on distances between property boundaries. It is also assumed that centroids represent precise locations of TB events in herds. However, the benefits of using single point-locations (cited in [Reference Durr and Froggatt12]) included, ease of data storage and manipulation, simple visual output and more developed statistical methods and software than for other types of spatial data.
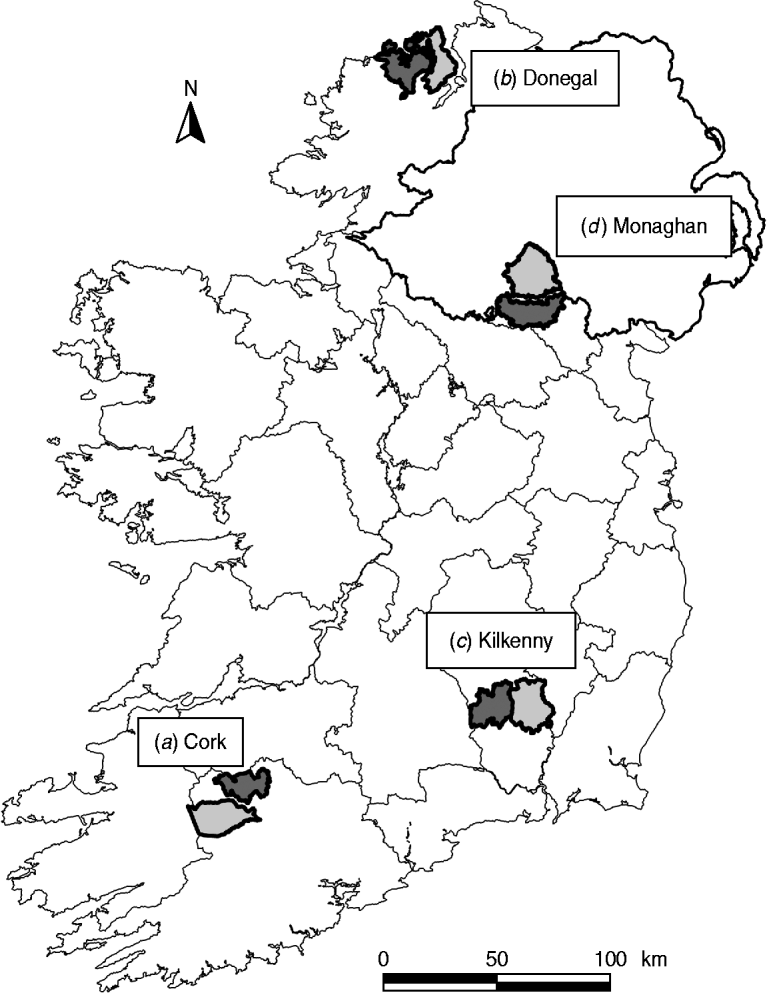
Fig. 1. Locations of the matched removal (![]() ) and reference (
) and reference (![]() ) areas in counties Cork, Donegal, Kilkenny and Monaghan in Ireland.
) areas in counties Cork, Donegal, Kilkenny and Monaghan in Ireland.
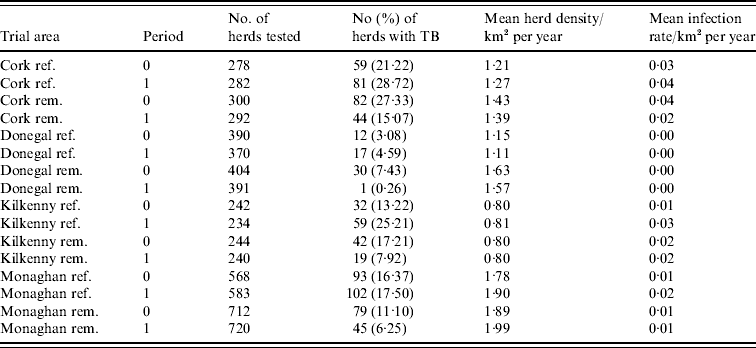
During the period of the FAP, all cattle herds in the study areas were tested at least annually. A herd was designated infected in a year if it contained at least two cattle that tested positive that year. This minimizes misclassification due to a single false-positive test. It also focuses on infection in the herd by excluding herds with a single introduced infected animal, unless there has been subsequent transmission to cohort animals [Reference Olea-Popelka13]. Summary statistics describing cattle herd populations in the 10-year period of the study are given in Table 1 and displayed in Figure 2. The herd densities are under-estimates as only herds with all lands in the removal or reference areas are considered in these analyses. The mean infection rate/km2 per year was taken as the total number of cases over the total number of annual herd tests divided by the area and averaged over years.
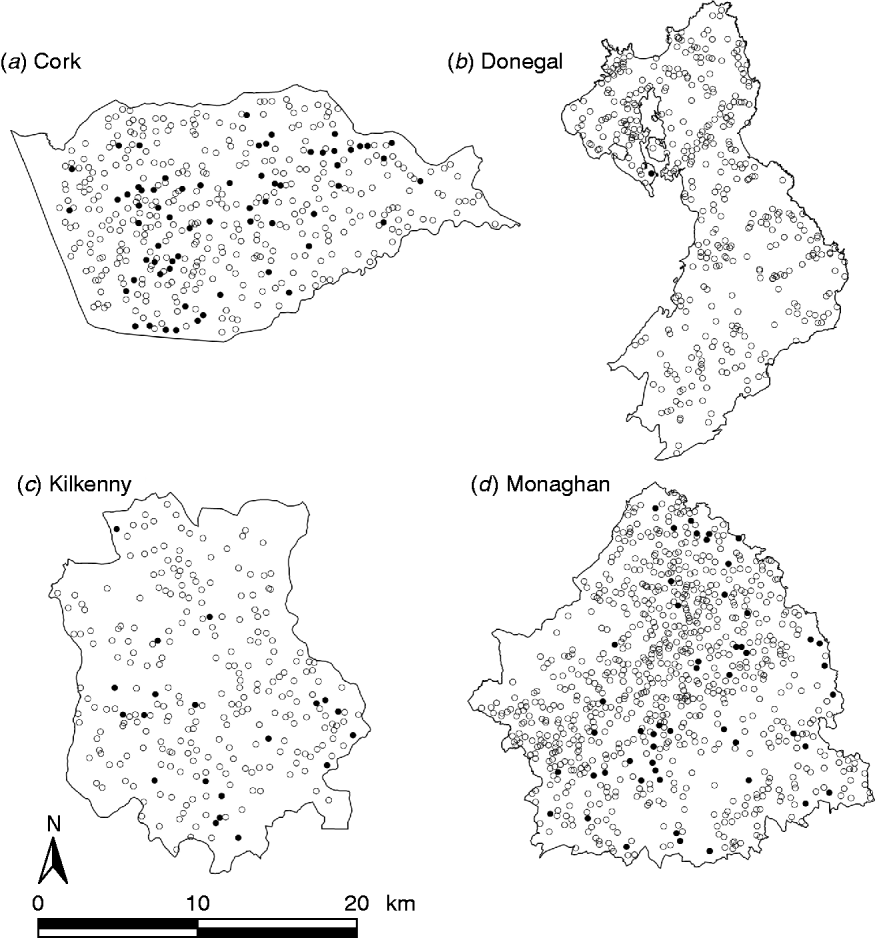
Fig. 2. Scatterplots of locations of TB infected (•) and non-infected (○) herds in the removal areas of four counties, in the period 1997–2002.
Table 1. Number of herds and percentage with at least two TB-positive cattle in the reference (ref.) and removal (rem.) areas in four counties in Ireland during 1 September 1992 to 31 August 1997 (prior to the proactive badger cull, period 0) and 1 September 1997 to 31 August 2002 (proactive badger cull, period 1). Also shown are herd densities and infection rates
We also considered for study, the total of 1039 adult badgers culled in the proactive areas in the first year of the cull for which the infection status, sex and age were known. Only the first year was considered, since the numbers of badgers culled in subsequent years were too small to permit substantive analysis. Moreover, data over years were not amalgamated, to avoid possible effects of recent badger culling on the distribution of infection [Reference Tuyttens7, Reference Woodroffe14], in order to permit comparison with other studies. Culling was conducted in association with setts. More detailed badger information can be found in Kelly et al. [Reference Kelly, McGrath and More15]. Using standard culture methods [Reference Costello16], 20% of badgers were infected with TB (28% in Cork, 41% in Donegal, 13% in Kilkenny, 20% in Monaghan). These figures underestimate the true infection prevalence, noting a relative sensitivity of 54·6% [95% confidence interval (CI) 44·9–69·8] [Reference Crawshaw, Griffiths and Clifton-Hadley17], compared to a more detailed necropsy protocol that is now used in Ireland [Reference Murphy18] and the UK [Reference Crawshaw, Griffiths and Clifton-Hadley17].
Spatial models
As in [19, chapter 4], we considered TB to be clustered in cattle herds if there is residual spatial variation in risk, after known influences have been accounted for. Thus, logistic regression models were fitted initially to the binary responses Y i, ith herd infected/not-infected allowing fixed effects that explained all or part of the broad-scale (first-order) variation in the mean response to be identified. Semivariograms were then computed from the standardized Pearson residuals Z i from the models, to identify the presence of residual spatial autocorrelation, i.e. second-order local spatial effects [20, section 6.3]. The semivariogram shows spatial dependence as a plot of semivariance vs. distance or lag h. The semivariance is calculated as
where N(h) is the set of distinct pairs of values separated by h and |N(h)| is the number of distinct pairs in N(h). Plotting the semivariance produces a curve typically rising from a point on the y-axis (the nugget), to a maximum semivariance value or ‘sill’ within a certain lag distance on the x-axis (the range) as depicted in [19, chapter 6]. The nugget describes the spatially uncorrelated variation in the data. The larger this value, the less spatial dependence there is between herds and the less useful spatial modeling will be. Points near the study borders are likely to have fewer neighbours than those in the centre of the study area. This may affect investigations of data for the presence of clustering. These distortions are referred to as edge effects and may affect the semivariograms. It should be noted, however, that these points are relatively few as most points very close to the boundary are excluded from analysis. Pointwise 95% confidence limits were constructed for each semivariogram, as described in [19, chapter 7]. The empirical semivariograms were used as rough guides to indicate spatial structure [20, sections 6.1, 6.3]. Estimation and testing of spatial structure via model fitting is a more reliable way of proceeding (P. Diggle, personal communication). Where indicated by the observed variogram (i.e. if it was outside the 95% limits) the logistic model was extended to include a spatial random effect as follows. We assumed the binary responses Y(s i) (ith herd at location s i infected/not-infected) had mean E(Y(s))=μ=g−1Xβ), where g(μ)=logit(μ) and X is the matrix of covariates. Allowing u(s i) to be a spatial random effect at location s i, we assumed the u(s i) followed an exponential covariance model F with (i,j)th element given by
where d ij is the distance between the locations s i and s j. Thus the model assumed that the correlation was the same for all equally distant locations in a given direction (i.e. stationarity), did not depend on direction (i.e. the model was isotropic, as indicated by visual inspection of scatter plots as in Fig. 2) and declined with increasing spatial separation between herds. The variance–covariance matrix of the data was modelled as
where A is a diagonal matrix with elements μi(1−μi). The parameters σ2 and ρ are the sill and ‘range’, respectively. The range of a stationary process is that distance at which observations are no longer correlated. For covariance models where covariances reach zero only asymptotically (e.g. the exponential), the practical range is defined as the distance where the covariance is reduced to 5% of the sill, i.e. 3ρ [20, section 4.2].
To model abrupt changes over relatively small distances and to include possible covariances between repeated measures on the same herd, we included a nugget effect by using
We computed a common measure for the degree of spatial structure via the relative structured variability (RSV) given by (σ2/σ2+c 0)×100 [20, section 4.2]. A test of spatial correlation was carried out by testing H 0: σ2=0. As we were testing a parameter on the boundary of the parameter space, the reference distribution was a mixture of a χ2 0 and a χ2 1 distribution. To perform the test, we simply divided the P value obtained from a χ2 1 by 2 [Reference Self and Liang21]. A test of ρ=0 is performed similarly. As ρ⩾0 necessarily, a confidence interval (CI) for ρ was computed on the log scale and then transformed. The upper confidence limit was truncated to the maximum distance between any two herds as it cannot exceed this. It should be noted that this is a marginal model and thus estimates of fixed effects are directly comparable to a non-spatial logistic model. The model will be referred to as a logistic GLGM with exponential covariance.
Estimation in a spatial model involves repeated inversion of an n×n matrix, where n is the number of distinct geographical locations, which is computationally difficult to implement. Moreover, the scale at which spatial correlation occurs in each treatment area and county varies considerably. Therefore two separate analyses were performed.
In the first analysis, the data in each county, area and period were analysed using separate spatial models. Presence or absence of spatial correlation and spatial correlation ranges were established. The response variable in the models was Y(s i) as defined above. The fixed effects in the models were log(herd size) [i.e. log(hs)], ph (presence or absence of previous history of infection in the herd) and the factor ‘year’ representing the years 1992/1993, 1993/1994, …, 2001/2002. In the removal areas for period 1, the covariates, d (distance to the nearest badger sett), infb (infection status of nearest badger sett) and two- and three-way interactions of ph, infb and d were also considered. Separate spatial models increase the probability of type 1 errors but this effect is likely to be small as herds in separate counties and areas can be considered independent.
In the second analysis, we assessed the effect of badger removal incorporating the spatial data, by considering reference and removal areas in one model. We also compared the removal area in the period prior to proactive culling to the period of proactive culling, again incorporating spatial information. Model fitting was carried out as in the first analysis. The fixed effects in these models were treatment (removal area/reference area), year, log(hs), ph and treatment×ph as defined above. In the comparison between pre- and proactive cull periods, individual years were not modelled and a simplified model using the summary covariate ‘period’ (0=1 September 1992 to 31 August 1997 and 1=1 September 1997 to 31 August 2002) was used instead. The models are similar to those used in [Reference Griffin2]. In order to circumvent computational difficulties, large sample sizes and low infection rates (as discussed in [Reference Bowman, Giannitrapani and Scott22]), a logistic model with a non-exponential radially smoothed spatial covariance structure was considered separately for each county. The model first involves choosing some knots (K of them) from the available locations and constructing a smoothed covariance matrix based on distances between the knots and distances between the knots and all spatial locations. The smoothing parameter is related to the variance of the random effects. Fitting this model only involves inversion once of a K×K matrix rather than repeatedly that of a n×n matrix. We followed the recommendation of Ruppert et al. [Reference Ruppert, Wand and Carroll23] by choosing K as one fourth of the (unique) coordinate locations, but not more than 35. The model is also described in detail elsewhere [20, section 6.2.1.1]. Effects with P values <0·05 were deemed significant. Models were fitted using the glimmix procedure in the software package SAS version 9.1.3 (SAS Institute Inc., USA) using a pseudo-likelihood approach [Reference Wolfinger and O'Connell24]. Semivariograms of model residuals were used to evaluate any remaining spatial dependence. However, as previously stated, these only provide rough guides. The mathematical and statistical theory of correlated error models, including goodness-of-fit inference, is complicated and still evolving, and the interested reader is referred to [Reference Schabenberger and Gotway20] for a detailed discussion.
RESULTS
In the first analysis, 16 fixed-effects logistic models were fitted to county, period and treatment area, and empirical semivariograms constructed from the Pearson residuals from the models. The empirical semivariograms where there was no spatial structure are indicated in Table 2, with range parameters zero. Figure 3 shows four of the empirical semivariograms. As confidence limits near zero are very large due to small sample sizes, the nugget is not shown. In the fixed-effects logistic models where spatial structure was indicated, a logistic GLGM with exponential covariance was fitted. The covariate log(hs) was statistically significant (P<0·05) in all models with odds ratios (OR) corresponding to a doubling of herd size ranging from 1·36 (95% CI 1·02–1·63) to 2·71 (95% CI 1·83–3·58). Differences between years were found in some models according to whether or not there were large changes in rates of infection on a yearly basis. The removal-area models also included badger covariates. In the first year of badger culling, distances to the nearest herd were similar for infected and uninfected badger setts (P=0·56, Wilcoxon rank sum test), the median distance was 0·55 km for uninfected and 0·56 km for infected badger setts, aggregated across the four counties. Thus, infected and uninfected badger setts had comparable opportunities for contact with cattle. In the removal areas for period 1 models (the number infected in Donegal was too low to support modelling), in Cork and Monaghan, the interaction term infb×ph was significant (P=0·003 Cork, P=0·002 Monaghan). For herds with the nearest badger sett infected, previous history of infection was not a risk factor for disease (Cork: OR 1·01, 95% CI 0·98–1·04; Monaghan: OR 1·00, 95% CI 0·98–1·02) and for those with the nearest badger sett not infected it was a risk factor (Cork: OR 1·08, 95% CI 1·05–1·11; Monaghan: OR 1·06, 95% CI 1·04–1·08). Previous history of infection had no significant effect in any other models with odds ratios ranging from 0·64 (95% CI 0·46–1·20) to 1·50 (95% CI 0·89–2·52). Estimates, standard errors and confidence intervals of the practical ranges from fitting the models are displayed in Table 2. We noted that these ranges varied significantly with time within an area, varied across counties (Wald tests) and three out of four were positive in removal areas period 1. The test of spatial correlation was significant in all the spatial models (P<0·001 in all cases), as was the nugget effect, and the relative structured variability was high (Table 2). Most range estimates were significantly different from 0 by the modified χ2 test [Reference Self and Liang21], again confirming the presence of spatial correlation. When logistic GLGMs were fitted to the three areas/time periods where the empirical semivariograms indicated no spatial structure, the range parameters were well beyond area limits, indicating broad spatial heterogeneity. A range parameter of zero fits equally well in such cases.
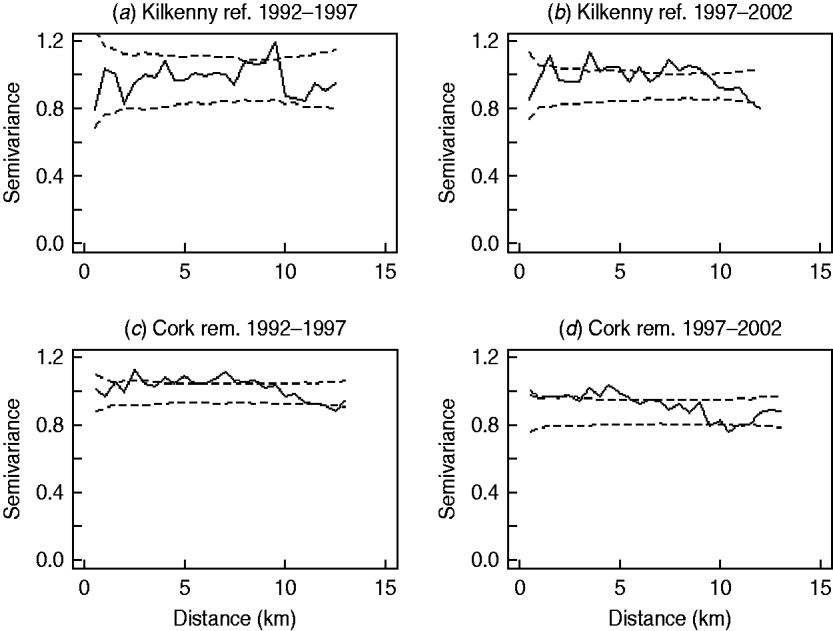
Fig. 3. Semivariograms for two areas by period (0=1992–1997, 1=1997–2002), computed using the standardized Pearson residuals derived from the fixed-effects logistic models described in the text (nugget not shown). The dashed lines show the pointwise 95% confidence limits constructed from 999 simulations where the residuals were randomly allocated to herd locations and the semivariogram computed for each simulation (rem., removal area; ref., reference area).
Table 2. Practical range parameter estimates and relative structured variability (RSV) from logistic generalized linear geostatistical models with exponential covariance structure, described in the text, fitted separately to the removal (rem.) and reference (ref.) areas of four counties for the pre- (period 0) and proactive (period 1) badger culling periods
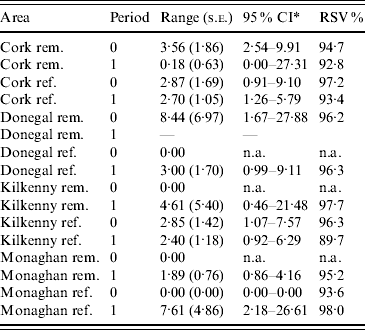
* CI, Confidence interval computed on log scale and then transformed. The upper limit was truncated where applicable, at the maximum distance between any two herds.
n.a., not applicable.
In the second analysis, the estimates of the fixed effects from the logistic GLGMs, with smoothed radial covariance structure for period 1, comparing removal and reference areas are shown in Table 3a (apart from the year effect). The interaction term treatment×ph was not significant in any county. Only in Donegal was the log odds of a herd restriction in the removal area significantly lower than the reference in period 1 (P=0·003). In the other counties P values were all >0·10. Herd size is a risk factor for odds of disease (P<0·05 in all counties). Odds ratios corresponding to a doubling of herd size, ranged from 1·32 to 2·13 over the four counties. In Cork and Monaghan, herds with a previous history had a greater risk than those with none (OR 1·38, P=0·07; OR 1·45, P=0·03, respectively). The test of spatial correlation was significant in every county (P<0·001), although the result was borderline in Donegal. Table 3b shows estimates from the logistic GLGMs, with radial covariance structure comparing pre- (0) and proactive (1) badger cull periods. In all counties, except Monaghan, there was a highly significant period effect (OR 0·03–0·39, P<0·001). In Monaghan, there was a lower incidence of TB in period 1 than period 0 but the effect was not significant. The interaction term period×ph was not significant in any county. Only in Cork was the ph term significant, while log(hs) was significant in all counties except Donegal where the P value was of borderline significance (P=0·07). There was no period difference when reference areas period 0 were compared to period 1 within each county and no treatment difference when removal and reference areas were compared in period 0 within each county. This was true using both spatial and non-spatial models.
Table 3. Estimates (standard errors) and P values from the logistic generalized linear geostatistical model with radially smoothed covariance structure described in the text, of the difference in the log odds of a herd infection with TB in (a) the removal area compared to the reference area in period 1 (b) the pre- (period 0) compared to proactive (period 1) badger cull periods in the removal areas, for the four counties
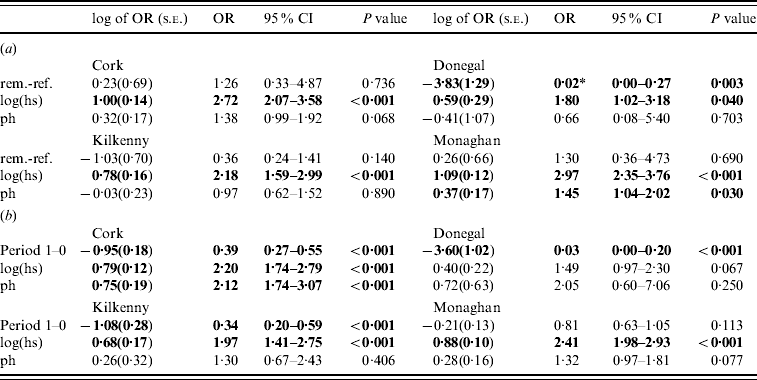
OR, Odds ratio; CI, confidence interval; hs, herd size; ph, previous history of infection.
* Interpretation: compared to herds in the reference area of Donegal during the period 1 September 1997 to 31 August 2002 and after controlling for the effects of herd size and previous history of TB infection, the odds of a herd in Donegal removal area for the same time period being infected with bovine TB was decreased by a factor of 0·02 (95% CI 0·00–0 ·27).
Significant effects (P<0·05) are in bold.
DISCUSSION
This study provides valuable insights into spatial clustering of TB-infected cattle herds and related factors, in Ireland, both prior to and following proactive badger removal. Further, we report the results of regression analyses where factors influencing farm-level TB risk have been quantified, with unmeasured spatial effects accounted for.
The first analysis establishes that TB-infected herds are clustered in space. One of the main benefits of the fitted models from this analysis is the provision of practical range estimates of clustering of TB adjusted for covariates. Two aspects of these estimates are particularly noteworthy. First, the estimates vary between counties and second, within areas over time. For example, in Cork prior to proactive badger removal, the estimate was higher in the removal area compared to Kilkenny, and lower during the second (compared to the first) period of observation (Table 2). This is useful information for culling policy, suggesting that a single culling distance may not always be appropriate. The variation in this estimate may be due to varying rates of TB over time and over areas which is in turn associated with a broad range of factors. Badger ecology is one such factor, as reactive or proactive culling may lead to changes in preferential sett location as well as the extent of home ranges as discussed previously [Reference Pope25]. Kelly et al. [Reference Kelly, McGrath and More15] found prior to and during the first year of the FAP that badger ranges extended to 6 km. In addition, the four areas involved quite different farming environments and badger densities [Reference Griffin2]. Changes in herd sizes may also occur over time – increased herd size is associated with increased incidence [Reference Griffin2], and with this, correlation range estimates may decrease. Other factors relating to the source and persistence of infection are discussed below.
It also cannot be discounted that differences between counties may be due in part to edge effects and this limitation of the data is acknowledged. However, edge effects will be the same when comparing the same area over time and also there is no evidence they differ between areas and thus are unlikely to affect comparisons between areas. We note that while incomplete identification of M. bovis infection in badgers does not affect the model fits obtained for the removal areas in the proactive culling period, it may lead to the effects of badger covariates being underestimated. We also note that because herds are represented by a single location, clustering effects may be diluted and correlation ranges underestimated. Standard errors of ranges in Table 2 are relatively large and confidence intervals wide possibly because of the paucity of infected herds.
Spatial association of infection persisted during the proactive badger culling period in Cork, Kilkenny and Monaghan. Similar results have been observed in the UK during the RBCT [Reference Jenkins26]. This observed effect is probably for reasons unrelated to badgers since in each of the FAP removal areas, proactive badger removal was sustained over a 5-year period [Reference Griffin2], leading to a substantial reduction in badger numbers [Reference Corner27]. Moreover, badger immigration (from outside each removal area) was limited by natural geographic features [Reference Griffin2]. There are several possible explanations for ongoing clustering of infection, including residual (persistent but undetected) infection in cattle, and ongoing herd-to-herd transmission. Residual infection is a key feature of human infection with M. tuberculosis [Reference Manabe and Bishai28], and we have increasing evidence of a key role for residual infection in cattle, based on results from several recent studies [Reference Olea-Popelka13, Reference Olea-Popelka29, Reference Wolfe30]. Consistent with this view, previous history of infection was a risk factor for TB in the current study. Similar difficulties were faced in the latter stages of the successful Australian TB eradication programme [Reference Radunz31]. Neighbourhood spread is also possible [Reference Olea-Popelka32], although probably of lesser importance [Reference More and Good1]. The movement of infected animals (introduced infection) will contribute to the establishment of infection, but not directly to its persistence. Due to the high level of animal movement in Ireland [Reference Ashe33], introduced infection is likely to lead to a relatively dispersed spatial pattern of infection.
In the second analysis, the analyses of the FAP [Reference Griffin2] have been repeated to include spatial data. When a spatial term is included in a logistic model to compare the reference and removal areas, the treatment effect is no longer significant apart from Donegal in period 1 (Table 3). The results are in the same direction as the logistic model, but regression coefficients are closer to zero and have larger standard errors due to the incorporation of spatial structure. Similar results were found by other authors when comparing spatial analyses to simpler analyses [19 (section 7.6), 20 (section 6.3)]. We note that the effect of the spatial term was smallest in Donegal. Comparing pre- and proactive cull periods in a single area – the removal area – the spatial structure is virtually the same. In this analysis, the results of [Reference Griffin2] are reproduced (apart from Monaghan) as was expected [19, chapter 7], with a highly significant difference in cattle incidence between the two periods. We note that Monaghan has the largest number of herds and the greatest difference in herds between pre-to proactive cull periods.
In conclusion, we have demonstrated the existence of local geographical associations between infected cattle herds. We have shown these vary over time and across areas. Local clustering of herd infection persists in some areas after badger culling has taken place.'
ACKNOWLEDGEMENTS
We thank Guy McGrath of the Centre for Veterinary Epidemiology and Risk Analysis, University College Dublin, for geo-referencing and mapping. We also thank the Editor and referees for helpful comments in relation to this work.
DECLARATION OF INTEREST
None.


