


INTRODUCTION
Pneumonia is a cause of enormous morbidity and mortality worldwide, including in the USA where it accounts for 4·2 million clinic visits and over 60 000 deaths in adults, and an economic burden of over $17 billion, annually [Reference File and Marrie1]. Pneumonia is a leading cause of pediatric hospitalization and is the eighth leading cause of death in this country [Reference Keren2, 3]. While pneumococcal conjugate vaccines have been effective in decreasing rates of pneumonia hospitalizations nationally [Reference Griffin4, Reference Grijalva5] as well as in Minnesota [Reference Iroh Tam and Koopmeiners6], sustained decreases were noted only in the younger children receiving the vaccine [Reference Iroh Tam and Koopmeiners6], suggesting that exposures beyond immunization are affecting disease and hospital admission.
Pneumonia and pneumonia hospitalization have a long-recognized correlation with socioeconomic risk factors. Adult bacteremic pneumococcal pneumonia and infant risk of developing pneumonia have both been associated with lower income and education [Reference Thorn7]. Similarly, pneumonia hospitalization rates have been significantly associated with socioeconomic deprivation [Reference Beck8, Reference Crighton9], and geographic variation in pneumonia hospitalization has been associated with underlying socioeconomic conditions [Reference Beck8]. However, whether spatial variability is also linked to other demographic and environmental factors beyond socioeconomic status and education is not well described.
Spatial modeling of infection can define distinct, local patterns for disease incidence and local covariation with social and environmental factors, and thereby identify targets for implementation of public health strategies. A fine spatial resolution such as to the block-group level can allow for a refined level of analysis of pneumonia hospitalizations that can provide a more accurate depiction of the underlying data, and has been explored using postcode districts [Reference Blain10], census divisions [Reference Crighton9], and aggregated census tracts [Reference Thorn7]. Spatial variation is a tool that could be used to identify some of these environmental factors in specific areas or population groups that might not be easily detected with other designs. We hypothesized that use of this approach would identify whether spatial variability exists and could correlate pneumonia hospitalizations with socioeconomic, demographic and environmental factors. The objective of this study was to evaluate if location-specific patterns of pneumonia, and socioeconomic, demographic and environmental factors can exist within a relatively small geographic region.
METHODS
This was a cross-sectional study design of patients within the Fairview Health System network of Minnesota. The Fairview Health System network comprises eight hospitals in the seven-county metro area of the Twin Cities encompassing 7706·5 square kilometers, including six community hospitals, a 96-bed tertiary care children's hospital and an 874-bed tertiary care university hospital. The clinical data repository includes data from 12·2 million outpatient visits, 514 000 inpatient visits, and 333 000 Emergency Department visits in 2015. During the study period, roughly 20% of the metro area's population was hospitalized within the network.
All patients 2 months of age and older hospitalized within the network between 1 January 2011 and 8 November 2015 with a diagnosis of pneumonia were identified. We identified participants through International Classification of Diseases, Ninth Edition (ICD-9) and Tenth Edition (ICD-10) codes diagnosed with pneumonia, pneumococcal or streptococcal septicemia. Patients with home addresses beyond the seven-county metro area (Anoka, Carver, Dakota, Hennepin, Ramsey, Scott, and Washington Counties), seen in the outpatient clinic, or who were re-hospitalized within a month were excluded. Variables extracted included age, sex, race/ethnicity, diagnoses and residential address. This study was approved by the Institutional Review Board of the University of Minnesota.
Patients were geocoded to their census block group by linkage to their residential address. Vague and incomplete addresses (e.g. P.O. boxes, General Delivery) were excluded. Primary exposures were obtained from Esri's Business Analyst [11], American Fact Finder [12], the Minnesota Solar Suitability Analysis [Reference Brink13], and the Marshall Research Group [14], using 5 year estimates from 2010 to 2014. Covariates for analysis included median household income, unemployment rate, educational attainment, living below the poverty line, racial and ethnic diversity index [Reference Reese-Cassal15], average annual air quality (amount of nitrogen dioxide (NO2) measured in parts per billion), and average annual solar insolation (measured in kilowatt-hour per meter squared (kWh/m2)). The primary outcome of interest was census block group-level pneumonia hospitalization risk, which was calculated for each block group using the numerator as the number of cases present within a block group, and the denominator as the total population within the block group. For the age analysis, rather than assume that the patient population is equally distributed, we created a new variable at block group level based on census data: high and low number of individuals aged ⩾65 (the top 50%, compared with the bottom 50%, of the distribution of number of individuals aged ⩾65 years). Seasons were defined according to the National Oceanic and Atmospheric Administration as spring (March–May), summer (June–August), fall (September–November) and winter (December–February) [16].
In order to promote ease of interpretation and preserve nonlinear trends, all variables were defined by quartiles. Educational attainment was defined by the number of college-educated individuals per block group (those who have attained a Bachelor's degree or higher). Average annual solar insolation was transformed to represent kilowatt-hour per square meter (kWh/m2), dividing average annual solar insolation per block group by the area of the block group.
Statistical analyses were performed using STATA software, v.13 (StataCorp, College Station, TX). Spatial analyses were performed using Esri's ArcGIS software, v.10·4 (Esri, Redlands, CA). To correct for positive or negative spatial variability between the observed values and their distances, we utilized Moran's I statistic in assessing the degree of spatial autocorrelation [Reference Cliff and Ord17]. A multivariate Poisson regression was used to test for differences and associations between pneumonia hospitalization rates over block group with socioeconomic, demographic and environmental variables. Cluster spatial analysis was performed using the Getis-Ord Gi* statistic [Reference Ord and Getis18], which characterized hot or cold block group clusters with higher or lower than expected pneumonia hospitalization rates, respectively. These hot and cold spots were overlaid with the distribution of socioeconomic, demographic, and environmental variables to assess for significant associations. Geographic masking was performed on all maps in order to promote comparability.
RESULTS
A total of 18 362 patients were identified, and 17 840 patients ranging from 10 weeks to 105 years (median age 66 years) were included in the analysis. Fifty-one percent were female. The majority of the patients were white (82%), 8·7% black, 1·8% Hispanic, and 6·8% other. Average block group population was 1416 (range 267– 8965) with an average block group area of 7 366 872 km2 (range 81 251–303 581 842 km2). The bottom 50% of block groups with a population ⩾65 years ranged from 0 to 148 persons, whereas the top 50% of block groups ranged from 149 to 1232 persons. A small proportion (196 block groups, or 9·4%) within the Twin Cities seven-county metro area had no pneumonia hospitalizations documented in the Fairview Health System. Among the other 1889 block groups with cases, pneumonia hospitalization risk ranged from 0·02% to 8·05% (Fig. 1a). The calculated average pneumonia hospitalization risk within a block group was 6 cases per every 1000 persons.
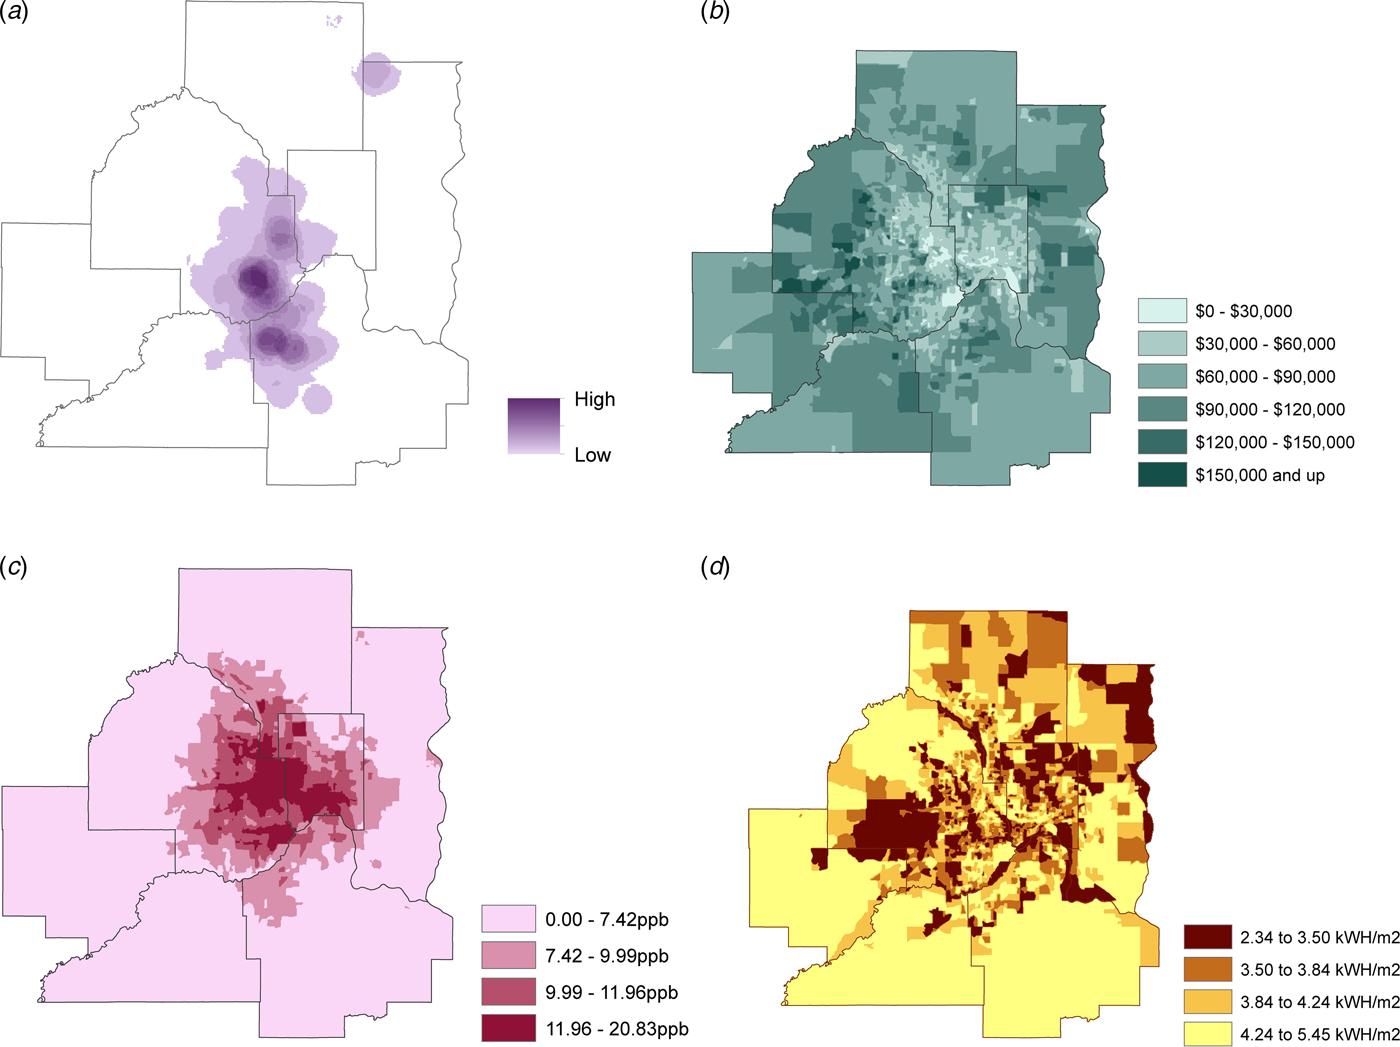
Fig. 1. 2011–2015 Twin Cities seven-county metro area by block group of: (a) Pneumonia hospitalization risk (block group cases per block group population); (b) Median household income (dollars); (c) Average NO2 emission quartiles (ppb, parts per billion); (d) Solar insolation quartiles (kWh/m2). Geographic masking was performed on all maps in order to promote comparability.
According to the Poisson analysis, those residing within block groups containing the bottom (first) quartile of the distribution of median household income had a 56% (Incidence rate ratio (IRR) 1·56, 95% confidence interval (CI) (1·31–1·85)) increased risk of pneumonia hospitalization compared with those at the top (fourth) quartile of the income distribution (Fig. 1b; online supplementary Appendix Table). No significant difference was detected between the first and second quartiles of the distribution of median household income (IRR 0·98, 95% CI (0·81–1·18)). Arguably, the decreased risk observed between the first and third quartile of income was marginally significant (IRR 0·85, 95% CI (0·70–1·02)), and a trend was apparent in the data where increases in income accompanied a decrease in risk. Among the distribution of a number of individuals living below the poverty line, pneumonia hospitalization risk increased approximately 19% (IRR 1·19, 95% CI (1·01–1·41)) going from the first to the fourth quartile. Furthermore, the risk of pneumonia hospitalization increased with higher rates of unemployment rates among block groups: from the first quartile of the distribution of unemployment rate to the third and fourth quartiles, pneumonia hospitalization risk increased approximately 20% for both (IRR 1·20, 95% CI (1·03–1·41); and 1·22, 95% CI (1·03–1·46), respectively).
After adjusting for median household income, there was a 39% increased the risk of pneumonia hospitalization among those in the second quartile of the distribution of college-educated individuals relative to those in the first quartile (IRR 1·39, 95% CI (1·18–1·64)). When going from the first to the third and fourth quartiles among college-educated individuals, the risk of pneumonia hospitalization increased 64% (IRR 1·64, 95% CI (1·38–1·96)) and 61% (IRR 1·61, 95% CI (1·28–2·02)), respectively. Similarly, after adjusting for median household income among the uninsured, there was a 21% (IRR 0·79, 95% CI (0·67–0·94)) decreased risk of pneumonia hospitalization for those in the second, and a 24% (IRR 0·76, 95% CI (0·62–0·92)) decreased risk for those in the fourth, compared with the first, quartiles.
A significant association was found across all quartiles of race/ethnic diversity index. When moving from the first to the second and third quartiles, the risk of pneumonia hospitalization increased by 31% (IRR 1·31, 95% CI (1·12–1·53)) and 34% (IRR 1·34, 95% CI (1·13–1·58)), respectively. Moving from the first (lowest) to the fourth (highest) quartile of the race/ethnic diversity index led to a 44% (IRR 1·44, 95% CI (1·22–1·71)) increase in pneumonia hospitalization risk. After adjusting for income, a significant association was found only between the first and second quartiles of race/ethnic diversity index, where moving from the first to the second quartile resulted in a 21% (IRR 1·21, 95% CI (1·04–1·41)) increased the risk of pneumonia hospitalization.
There were significant differences in pneumonia hospitalization by age group. Block groups with larger populations of adults ⩾65 years had pneumonia hospitalization rates that were 40% (IRR 1·40, 95% CI (1·26–1·56)) higher than the block groups containing smaller populations of older adults.
Seasonal analysis also revealed significant differences in pneumonia hospitalization by age group. For all seasons, block groups containing a larger population of adults ⩾65 years had greater pneumonia hospitalization rates than the block groups containing smaller populations of older adults (Table 1).
Table 1. Incidence rate ratio and risk of pneumonia hospitalization by season for block groups containing a larger population of adults ⩾65 years

CI, confidence interval; IRR, incidence rate ratio.
Block groups containing smaller populations of ⩾65 years are the reference group.
In examining environmental factors, air quality was found to have a significant relationship with pneumonia hospitalizations across all quartiles of the distribution of average annual NO2 emissions. When going from the first to the second and third quartiles, the risk of pneumonia hospitalization increased 56% (IRR 1·56, 95% CI (1·32–1·84)) and 37% (IRR 1·37, 95% CI (1·16–1·60)), respectively (Fig. 1c). Block groups containing the highest quartile of average NO2 emissions had a hospitalization rate for pneumonia that was 44% (IRR 1·44, 95% CI (1·22–1·69)) higher than the lowest quartile.
Several statistically significant interactions were detected between age group and air quality (Fig. 2). Block groups containing larger populations of adults ⩾65 years who live in regions with the second, third, and fourth quartiles of NO2 emissions had 68% (IRR 1·68, 95% CI (1·37–2·06)), 58% (IRR 1·58, 95% CI (1·28–1·96)) and 110% (IRR 2·10, 95% CI (1·64–2·71)) higher risk for pneumonia hospitalization, respectively, than those living in block groups with the lowest quartile of average annual NO2. Comparing the lowest quartile of NO2 emissions to the highest, for block groups containing smaller populations of older adults, was only marginally significant (IRR 1·22, 95% CI (1·00–1·48)).
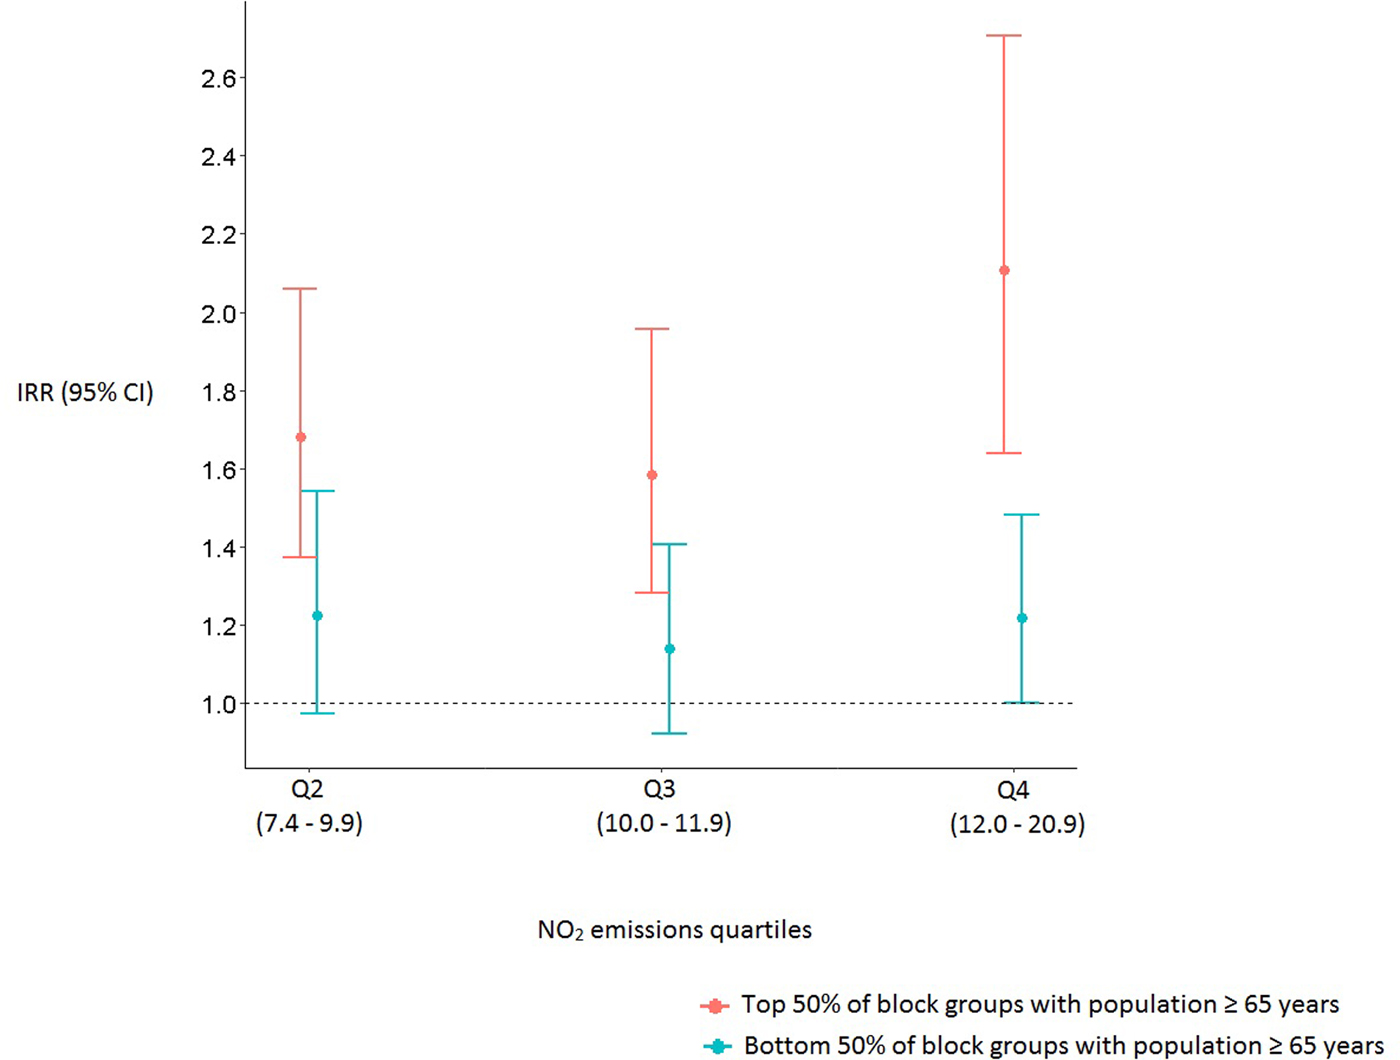
Fig. 2. Incidence rate ratios and 95% confidence intervals of pneumonia hospitalizations for block groups with larger and smaller populations of ⩾65 years. The first quartile of average annual NO2 emissions serves as the reference group.
Statistically significant interactions between age group and air quality remained after stratifying by a season where, for all four seasons, block groups containing larger populations of adults ⩾65 years in regions with higher NO2 emissions had a greater risk for pneumonia hospitalization than those from block groups with the lowest average annual NO2 (Fig. 3).
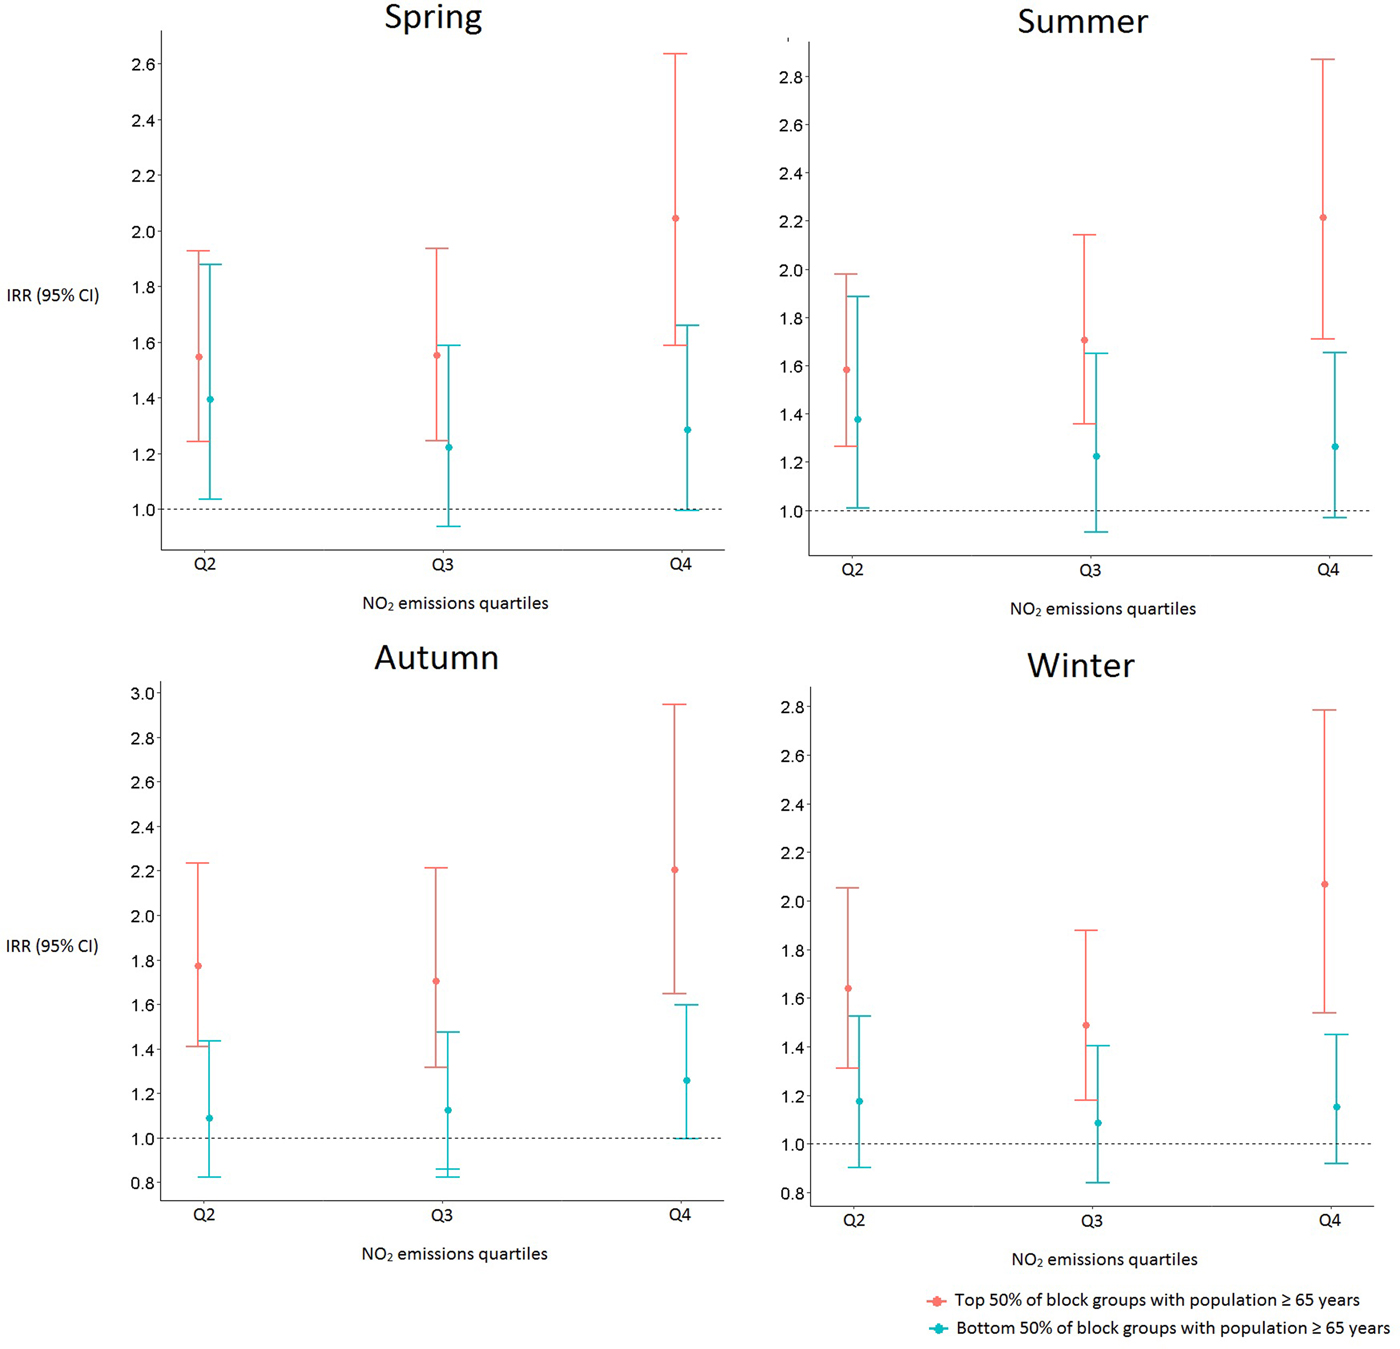
Fig. 3. Incidence rate ratios and 95% confidence intervals of pneumonia hospitalization by season for block groups with larger and smaller populations of ⩾65 years. The first quartile of average annual NO2 emissions serves as the reference group.
Furthermore, strong and significant associations were detected between solar insolation and pneumonia hospitalization risk, where regions with higher relative to lower average annual solar insolation also had a greater risk of pneumonia hospitalization. Moving from the first to the second quartile of solar insolation resulted in a 16% (IRR 1·16, 95% CI (0·99–1·35)) increased the risk of pneumonia hospitalization. Moving from the first to the third and fourth quartiles of average annual solar insolation the risk of pneumonia hospitalization increased by 19% (IRR 1·19, 95% CI (1·03–1·38)) and 47% (IRR 1·47, 95% CI (1·25–1·73)), respectively (Fig. 1d).
There was significant geographic clustering as suggested by the results of the Getis Ord Hot-Spot Analysis (Fig. 4). The hot-spot analysis showed spatial correspondence to the expected relationships: hot spots (higher than expected pneumonia hospitalization rates) were situated in areas where higher levels of NO2 emissions or lower average income were apparent, while cold spots (lower than expected pneumonia hospitalization rates) were situated in the higher income areas characterized by lower levels of NO2 emissions.
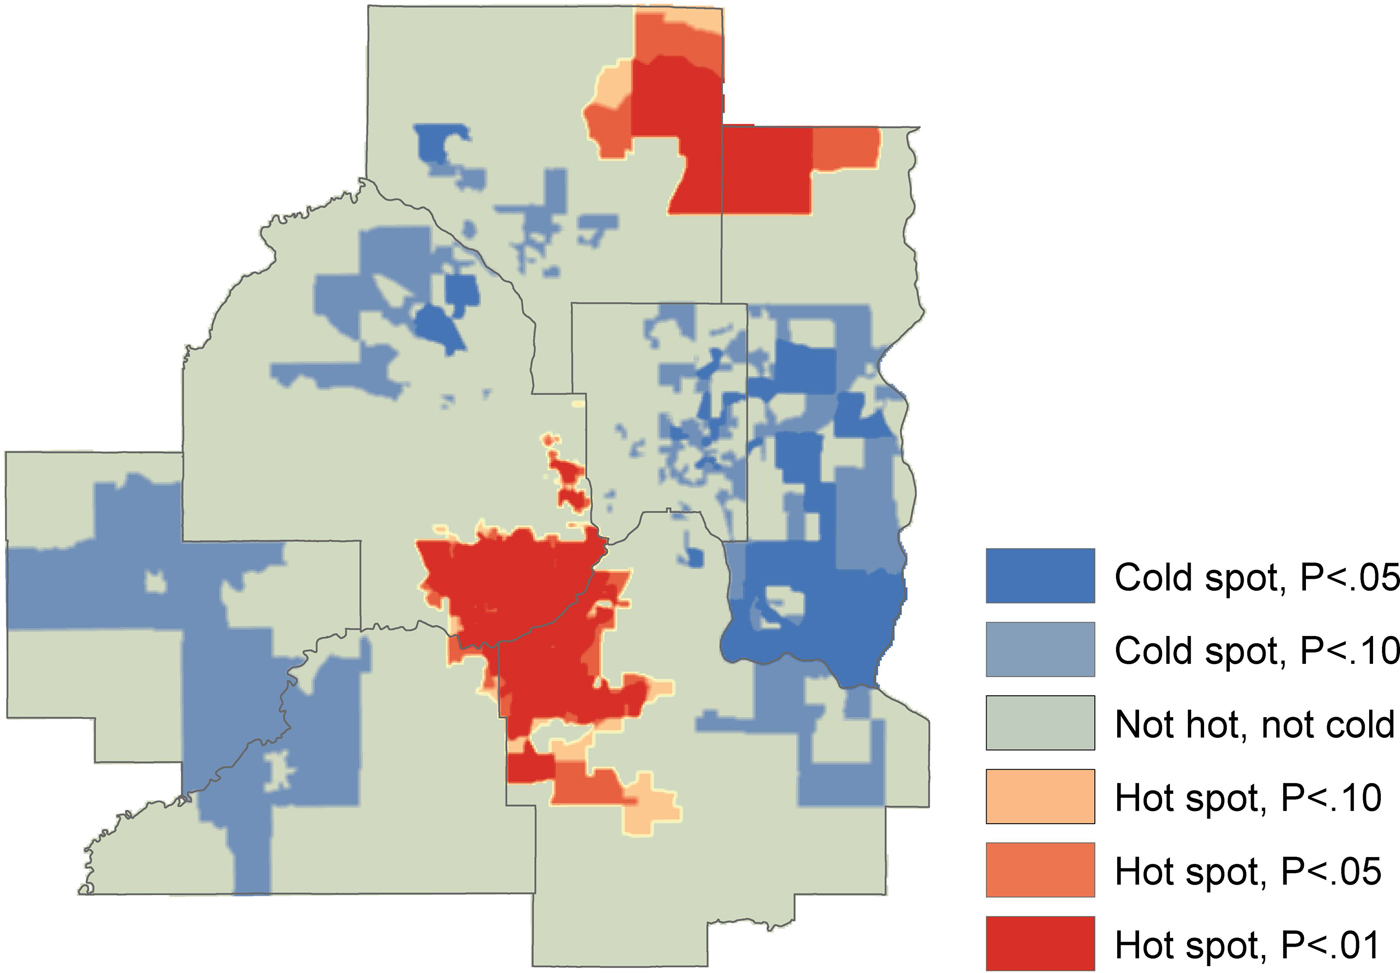
Fig. 4. Hot-spot analysis for significant spatial clusters of pneumonia hospitalization, 2011–2015.
DISCUSSION
Using data at the fine spatial resolution of the block group, this study identified significant spatial variability in pneumonia hospitalization risk across the Twin Cities seven-county metro area in Minnesota. This variability was associated with underlying distributions of socioeconomic, demographic and environmental factors such as measures of income, race/ethnic diversity index, unemployment, poverty, air quality, and solar insolation. While these findings are broadly consistent with previous studies on the association between increased risk of respiratory infections and lower socioeconomic status, and we also report significant associations with lesser described factors.
Previous studies have reported on spatial variation in health, including the poorer health indices [Reference Epstein19–Reference Yoo, Slack and Holl22] and increased respiratory illness [Reference Beck8, Reference Blain10, Reference Beck23–Reference Yousey-Hindes and Hadler26] that are seen in lower-income neighborhoods and communities. Spatial associations with respiratory tract infections in areas with lower socioeconomic status have been attributed to higher population density [Reference Feemster20], increased environmental particle exposure and pollutants in these areas [Reference Ghio27], and limited access to health care [Reference Larson and Halfon28]. Findings of documented variability have been posited to inform resource-delivery to promote hospitalization prevention [Reference Hardt29].
In our study, contrary to expected, greater risk of pneumonia hospitalization was significantly associated with increased numbers of college-educated individuals per block group. One explanation is that college-educated individuals are more likely to seek clinical care than those without college degrees. The inclusion of median household income in our model gave rise to unstable effect estimates as a result of the undeniable collinearity that persists between race/ethnic diversity index and income. Because it is nearly impossible to piece apart from the independent effects of race/ethnic diversity index and income, one should interpret the adjusted model with caution. Counter to what one would expect, our data suggests that as the number of uninsured individuals per block group increases, the risk of pneumonia hospitalization decreases. Because we relied on hospital admissions for our risk calculation, we are missing data from those who had pneumonia and did not seek clinical care. Therefore, one explanation for our observations is that individuals who are uninsured are less likely to go to the hospital when sick as they are deterred from the cost of care. Block groups with larger populations of ⩾65 years had significantly higher pneumonia hospitalization rates compared with block groups with smaller populations of ⩾65 years, which correlates with what is known about higher morbidity occurring in this population. The significant interaction between air quality and age ⩾65 years suggests that this group may be vulnerable to pneumonia hospitalization induced by poor air quality. Block groups containing larger populations of ⩾65 years in regions with higher NO2 emissions had a greater risk for pneumonia hospitalization than those from block groups with the lower average annual NO2, across all seasons, suggesting that vulnerability of this group to the pneumonia-inducing effects of air quality exists regardless of the season.
Air quality has been identified as a risk factor for childhood pneumonia and mortality in low- and middle-income countries [Reference Ram30]. In the United States, levels of ambient air pollutants have been associated with death rates from pneumonia [Reference Kravchenko31] and air pollution has been linked to childhood respiratory health in rural Alaska Native communities [Reference Ware32]. However, much of the literature has focused on childhood illness and also has not specifically examined the impact of air quality on hospitalization rates. Of two studies that did, one demonstrated that coarse particulate matter was associated with increased risk of emergency hospital pneumonia admissions in Hong Kong [Reference Qiu33]; another study revealed an association between increased particulate exposure and pneumonia admissions among the elderly [Reference Schwartz34].
Similarly, solar insolation has been explored in studies evaluating the association between ultraviolet B radiation and vitamin D on a variety of dermatologic, neurodevelopmental, endocrine, oncologic and autoimmune conditions [Reference Grant35]. While the potential association with pneumonia was described in ecological studies [Reference Juzeniene36], including one performed in the United States where solar ultraviolet B radiation doses reduced the influenza fatality rate during 1918–1919 pandemic influenza [Reference Grant and Giovannucci37], this is to our knowledge the first study to show an association with pneumonia hospitalizations. Our association of high solar insolation with increased pneumonia hospitalization was surprising and contrary to previous findings. In these studies, solar insolation was linked to a decrease in respiratory tract illness, which was attributed to the biosynthesis of vitamin D and its associated antioxidant properties and antibacterial activity [Reference Muhe38, Reference Wayse39]. In the presence of sunlight or UV rays, certain pollutants may undergo chemical reactions. Therefore, solar radiation may increase toxic by-products or may release pollutants such as trapped nitrogen oxide. As we do not have a complete understanding of the factors involved in the significant relationship between solar insolation and pneumonia hospitalization, it is difficult to say for certain what the data is showing. We controlled for income and education in our model. We can speculate that the relationship detected between solar insolation and pneumonia hospitalization reflects the association of NO2 emissions with risk by the way of road network density [Reference Gunier40]. Possibly, block groups with greater solar insolation have greater road network density and subsequently higher annual NO2 emissions, and therefore greater pneumonia hospitalization risk. Another possible relationship is that ground-level ozone and other secondary pollutants can form when NO2 and volatile organic compounds mix due to sunlight [Reference Jenkin and Clemitshaw41]. Solar insolation is clearly a topic of future research given the various potential illness pathways it presents.
Spatial variation of pneumonia hospitalizations has been explored using postcode districts [Reference Blain10], census divisions [Reference Crighton9], and aggregated census tracts [Reference Thorn7]. However, these studies explored the spatial variation of pneumonia on larger areas of interest using coarser spatial resolutions. A study of pneumonia hospitalization at the county level identified geographic variation in risk, but this focused only on children [Reference Beck8]. By using spatial resolution to the block group level, our examination of pneumonia hospitalizations allowed for a refined level of analysis that can provide more accurate depiction of the underlying data [Reference Beck23], as well as capture relationships among population, socioeconomic and demographic factors, health and the environment that vary with fine-scaled differences in land use and housing.
Our sample size included almost 18 000 patient encounters which are, to our knowledge, the largest study performed to date that has used fine resolution spatial analysis to examine pneumonia hospitalizations. However, the Fairview Health System network accounted for only about 20% of hospitalizations within the Twin Cities seven-county metro area during this study period, which limits the capture of a population-wide perspective on spatial patterns. Despite this, the system was distributed fairly widely, which is supported by the fact that 90·6% of block groups reported some level of pneumonia hospitalization. This would support the argument that the sample is spatially broad and geographically distributed and, from that, likely representative of the population. Another limitation is that pneumonia hospitalizations were analyzed across space but not over time, and thus our results do not account for seasonal effects on the risk of pneumonia hospitalization. We did not stratify our analysis by age group, which may have revealed additional associations. Given that our study was cross-sectional in design, we cannot make causal conclusions regarding any spatial patterns observed, and hence findings cannot be generalized to larger spatial scales.
In conclusion, we utilized a novel approach to evaluate relationships between pneumonia hospitalization and sociodemographic and environmental factors. We demonstrated that the risk of pneumonia hospitalization at the census block level varies by region-specific socioeconomic and environmental factors such as income, race/ethnic diversity index, unemployment, poverty, air quality and solar insolation. Using fine spatial resolution to the block group level we describe new associations which merit further study, and demonstrate proof-of-concept of an approach that may help identify high-risk regions that would most benefit from targeted interventions and prevention strategies [Reference Feemster20, Reference Hardt29]. Varying spatial units can have different pneumonia hospitalization correlations with socioeconomic, demographic, and environmental factors. Future studies should compare the various spatial units and their correlations.
SUPPLEMENTARY MATERIAL
The supplementary material for this article can be found at https://doi.org/10.1017/S0950268817002291
ACKNOWLEDGEMENTS
We thank Gretchen Sieger for identification of medical records for this study. We thank Richard MacLehose and Julian Wolfson for biostatistical support, Coleman Shepard for extracting the solar data, Josh Donato for writing the script to extract the solar data, Tracy Kugler for assistance preparing the figures, and David Van Riper for guidance on masking techniques. We thank Zohara Cohen, Lori Ketola and Amanda Bailor for assistance on addressing health information privacy. Research reported in this publication was supported by the University of Minnesota Institute for Health Informatics Seed Grant and the National Center for Advancing Translational Sciences of the National Institutes of Health Award Number UL1TR000114. This work was also supported in part by NSF OCI: Terra Populus: A Global Population/Environment Data Network (0940818), the National Institutes of Health supported Minnesota Population Center (R24 HD041023), and the University of Minnesota Office of the Vice President for Research. We gratefully acknowledge support from the Minnesota Population Center, which is funded by a center grant from the National Institutes of Health (P2C HD041023). The content is solely the responsibility of the authors and does not necessarily represent the official views of the National Institutes of Health.


