

INTRODUCTION
A general problem with infectious disease surveillance systems is that due to under-ascertainment, estimation of incidences based on numbers of reported laboratory-confirmed cases will often lead to considerable underestimation. This is especially true for self-limiting diseases with symptoms such as diarrhoea caused by foodborne bacteria [Reference Herikstad1]. Several barriers have to be crossed before an infected person is reported in a surveillance system, e.g. the person has to seek healthcare, a stool sample has to be taken, the bacteria should be identified by a laboratory [Reference Scallan2], and the laboratory should report the positive finding. A Dutch study has estimated that only one out of 14·3 Salmonella cases in the general population was reported to the laboratory surveillance system [Reference van Pelt3]. Since both the organization of healthcare and surveillance systems differ strongly between countries, the numbers of reported cases cannot be used to compare incidences as a measure for the disease burden across countries. Clearly we are in need of alternative, less biased methods to evaluate the incidence of salmonellosis and other diseases since official systems only capture a small and unknown fraction of case patients.
Community studies have been used in an attempt to estimate the true burden of gastroenteritis by use of questionnaires and the microbiological analysis of systematically collected stool samples from prospectively followed population cohorts [Reference van Pelt3, Reference Wheeler4]. However, such community studies are very expensive and may therefore be difficult to apply in most countries. In the current study we use measurements of antibodies in representative serum samples randomly selected from the population to estimate the frequency of seroconversions against a certain pathogen. We show that these can be used to obtain a valid comparison of infection pressure between countries. This approach also benefits from being more cost-effective than traditional studies involving the collection of faecal samples, since it can use sera from well-defined cohorts collected for other purposes.
Blood samples from cross-sectional population studies in three European countries were gathered as part of a European collaborative project [5]. After measuring antibodies against Salmonella we were able to estimate the incidence of Salmonella seroconversions in the participating countries and make comparisons. The method presented here has the advantage of being completely independent of the healthcare and surveillance systems and is therefore well suited for comparing the incidence of Salmonella exposures between countries and periods. Moreover, this methodology can provide a basis for estimating the degree of underreporting, e.g. evaluating the ratio (sometimes referred to as the multiplier estimate [Reference Voetsch6]) between the seroincidence and the incidence of culture-confirmed cases.
We applied a mathematical model from a previously published study aimed at estimating the frequency of seroconversions [Reference Simonsen7], a measure termed as the seroincidence. Our paper will show the results of applying this method to estimate the seroincidence in cohorts from different countries and periods. We further extended the model such that the ratio (with corresponding credible intervals) between pairs of incidences could be estimated.
METHODS
Materials
Longitudinal study
A follow-up study of 302 persons infected with either Salmonella Enteritidis or Salmonella Typhimurium was performed [Reference Strid8]. Blood samples were taken three or four times in a period of 18 months after onset of infection. Anti-Salmonella IgA, IgM and IgG concentrations were measured in arbitrary units of optical density (OD) values in an in-house mixed ELISA, using lipopolysaccharides of S. Enteritidis+ S. Typhimurium as capture antigens [Reference Strid8].
Cross-sectional studies
Population-representative sera were collected in three countries: Denmark, Poland and The Netherlands. The Danish sera were obtained from the Helbred 2006 cohort and consisted of 1780 blood samples collected in 2006 and 2007. The Polish sera came from Bank Surowic Zakladu Wirusologii PZH and consisted of 500 samples collected in 2004 [Reference Smith9]. In The Netherlands we included sera from two cohorts: the first was the Regenboog cohort for which 1053 blood samples were collected in 1998–2002 while the second, the Pienter II cohort [Reference van der Klis10], consisted of 1065 blood samples collected in 2006 and 2007.
Antibody titres in each blood sample from the cross-sectional samples were measured in the same units by the same assay as in the longitudinal study.
Estimation of seroprevalence
In order to define the threshold for being seropositive, the 95% percentile was calculated for each of the antibody classes (IgG, IgM, IgA) in the Danish cross-sectional cohort and these values were used as cut-offs. The antibody levels observed in the three other countries were then compared with this cut-off value. The seroprevalence in each of the four cohorts was estimated by the fractions of seropositive samples. This was done separately for each of the three antibody classes (IgG, IgM, IgA).
Estimation of seroincidence
The seroincidence is here defined as the number of seroconversions per (1000) number of person-years. Under the assumption of a rapid rise in antibody levels following infection and a subsequent slow decay, we designed a mathematical model. In order to handle individual variation of peak level, decay rate and baseline level, the model had a two-level hierarchical structure where the parameters describing the individual response curves were allowed to be random components with global mean and variance parameters. Inference of these parameters was obtained from the longitudinal study [Reference Simonsen7]. Using the estimated parameters it was then possible to predict the antibody level for any number of days since a person experienced their last infection. Conversely, given a set of antibody measurements (IgG, IgM, IgA), it is then possible to back-calculate the time elapsed since a last infection. This was done by Monte Carlo simulation, producing sets of time since infection, {T i}j, where j refers to any individual simulation and i to an individual in any of the cross-sectional samples.
A Bayesian approach was used for the estimation of seroincidence. This means that we considered the seroincidence as a random variable of which we aimed to find the conditional distribution (commonly called the posterior distribution) given the observed data. A requirement for doing so is definition of a distribution of the model parameter(s) prior to any observations (the prior distribution). In a situation with no prior information (which most often is the case) it is often possible to define a non-informative prior distribution reflecting complete ignorance about the model parameters. Then the posterior distribution depends (entirely) on the information contained in the observed data.
The approach used here is explained in detail in Simonsen et al. [Reference Simonsen7]. Inference of the incidence is based on the posterior distribution of the incidence given the observed antibody values. Since an incidence is treated as a scale parameter, the non-informative prior distribution should be flat on the log-scale. Therefore, the non-informative prior distribution of the incidence is given by the improper probability density function, π(γ) ∝ 1/γ, where γ is the unknown incidence.
We assumed first that the times since infection are known (T i for individual i) for each individual in the cross-sectional cohorts. Due to the fact that the antibody levels for IgM and IgA appeared to reach steady state after 60 days, we chose to censor estimated time since infection at 60 days [Reference Simonsen7]. The conditional distribution of incidence given the time values is then given by
where 1T i<60 takes the value 1 if individual i was infected within the last 60 days and zero otherwise. Note that the last term shows that γ is Gamma-distributed (after conditioning with time since infection). This implies that the mean value (which can be used as an estimate) of γ is
which intuitively is correct; the number of observed events divided by the total observed time between infection/censoring event and observation event is the commonly used estimator of an incidence.
However, only the antibody values are known – not the actual time since infection. To overcome this problem, we can simulate sets of the time since infection from their conditional distribution given the observed antibody values averaging over the distributions where we condition with the simulated time values. These simulations were performed by construction of a Markov Chain [Reference Gilks, Richardson and Spiegelhalter11]. The posterior distribution of the incidence is therefore
where {T i} (with no subscript j) refers to the unknown random variable time since infection while {T i}j refers to the jth simulated set of values of time since infection and M is the number of simulated sets of time since infection. The second part of equation (2) follows from the fact that for given values of time since infection, antibody levels do not provide any further information about the incidence. Convergence of the Markov chains was tested by verifying that there were no significant differences between different parts (of various sizes) of the chains (Geweke's test) [Reference Gilks, Richardson and Spiegelhalter11, Reference Dodds and Vicini12]. We especially verified if the selected burn-in period was long enough by testing for significant difference between samples in the initial part of Markov chains directly after the burn-in period (the burn-in period was the initial 5000 iterations in the chain, that were discarded) and samples in the final part of the chain. Further, the Markov chains were thinned in order to approach independent samples. This was done by verifying that all the autocorrelations in the thinned chains were insignificantly different from zero.
By using equation (1) it can be seen that the posterior distribution of the incidence can be estimated by a mixture of Gamma distributions. Note that the observed antibody values only affect the posterior distribution through the simulated time values which were simulated in the conditional distribution given the antibody levels.
The distribution given by equation (2) allows estimation of the median incidence as well as 95% credibility intervalsFootnote † as the 2·5% and 97·5% percentiles.
Incidence comparison
Pairwise comparisons of the seroincidences between the four cohorts were made by constructing the posterior distribution of the incidence rate ratios. The posterior distribution of the ratio of two incidences could be constructed analytically. After calculating the posterior distribution of the incidence in the two countries under consideration, we simply need to find the distribution of the ratio of two random variables which are distributed as the posterior distributions of the pairs of incidences from the two countries.
We assumed that X and Y are two independent stochastic variables which are both Gamma-distributed with shape and scale parameters (αX, λX) and (αY, λY), respectively.
The distribution of the ratio of two stochastic variables, X and Y can be calculated as
where the f X and f Y are probability mass functions for the stochastic variables X and Y. When both X and Y are Gamma-distributed the following distribution is obtained for their ratio:
In the present case, X and Y, represent the incidences in two different countries that are not Gamma-distributed but rather mixtures of Gamma-distributed variables:
where X i and Y i are, respectively, Γ(αXi, λXi) and Γ(αYi, λYi) distributed.
The distribution of f X/Y(z) is therefore given by probability mass function of the form
where f Xi/Yi(z) is given by equation (3).
Using this distribution, median values and 95% credibility intervals can be calculated for the incidence rate ratios.
Applied software
The Markov chain used for estimating the longitudinal parameters was produced in WinBugs [Reference Lunn13]. We wrote our own procedures for constructing the Markov chains for estimating the time since infection, the posterior distributions of the incidence rates, and the posterior distributions of the incidence rate ratios as we were unable to find software capable of performing these tasks. This was done in SAS language [14].
RESULTS
Seroprevalences
The distributions of the observed OD values are shown in Figure 1. For all three antibody types the samples from Poland had the largest fraction of high OD values (⩾0·4) while Denmark had the lowest fraction of high OD values. Crude seroprevalence estimates in each of the three cross-sectional samples are shown in Table 1. The seroprevalence was lowest in Denmark (5% per definition) while the highest prevalence was found in the Polish cohort (39·8%, 20·6%, 17·0% positive samples for IgG, IgM and IgA, respectively); The Netherlands had intermediate values.
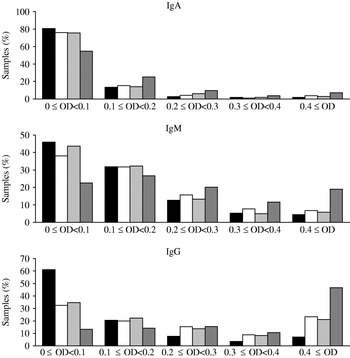
Fig. 1. Distribution of optical density (OD) values for each of the four of serum sample collections. ▪, Denmark (2006–2007); □, The Netherlands (2006–2007); ![]() , The Netherlands (1998–2002);
, The Netherlands (1998–2002); ![]() , Poland (2004).
, Poland (2004).
Table 1. Estimated seroprevalences and seroincidences in the participating countries

Seroincidences
Trace plots and Geweke's tests did not give any indication that convergence of the Markov chains were not attained (data available as Supplementary online material). Further, plots showing goodness-of-fit are shown in Simonsen et al. [Reference Simonsen7]. The posterior distribution of seroincidence is shown in Figure 2 and summarized by median (as a point estimate) and 95% credibility intervals (95% CI) in Table 1. The ordering followed the same pattern as the seroprevalences. The Polish incidence estimate was 547 infections/1000 person-years (95% CI 343–813), corresponding approximately to one seroconversion every second year, while the lowest incidence was in the Danish cohort where it was estimated that on average 84 (95% CI 41–141) seroconversions took place per 1000 person-years, i.e. one seroconversion every 12 years. Seroincidence estimates for the two Dutch serum collections were very similar.

Fig. 2. Posterior density functions of the seroincidence in the participating countries. –––, Denmark; ![]() , The Netherlands (2006–2007); – – –, The Netherlands (1998–2002); ……, Poland.
, The Netherlands (2006–2007); – – –, The Netherlands (1998–2002); ……, Poland.
Incidence comparisons
Incidence rate ratios with 95% credibility intervals are shown in Table 2. The seroincidence in Poland was significantly higher than in the two Dutch cohorts and the Danish cohort. The largest difference was found between the Polish and the Danish cohort: 6·34 (95% CI 3·31–12·53) infections in Poland per infection in Denmark. Incidence estimates calculated on base of the two Dutch cohorts, which were sampled 6–7 years apart, were both higher than the Danish incidence (ratio 2·01 for Regenboog, 1·74 for Pienter) but this was not statistically significant.
Table 2. Estimated incidence rate ratios with 95% credibility intervals between the four cohorts. These are found by taking medians, 2·5% and 97·5% percentiles from the posterior distributions of the incidence rate ratios
DISCUSSION
This paper shows how seroincidence can be estimated and how this measure can be used to compare Salmonella infection rates between countries. The use of seroincidence has several benefits compared to the more commonly used seroprevalence. First, the magnitudes of the seroprevalences are dependent on the arbitrary choice of cut-off for being defined as seropositive.
Further, since the persistence of antibodies varies between individuals, any given seroprevalence cannot be converted into a frequency of infection by simple means. Finally, the three types of antibodies (IgG, IgM, IgA) each produce an estimate of seroprevalence, and these three estimates are difficult to combine. In contrast the seroincidence does not suffer from such problems with arbitrary cut-off levels for different antibody types. Further, as seroincidence is based on serum antibody titres measured with the same ELISA in all sera, it does not suffer from the biases present in the numbers of laboratory-reported cases from different nations, and can therefore be used to compare the sensitivity of surveillance systems between countries or periods.
It is important to emphasize that both symptomatic as well as asymptomatic infection can lead to seroconversion; therefore, the seroincidence shown in this paper should not be seen as a measure of frequency of disease, but rather a measure of frequency of Salmonella exposures leading to seroconversion. However, as this is likely to reflect the exposure at the population level to this foodborne agent, it might be applicable to evaluate the effect of control programmes between countries.
In general, it seems that the higher the seroincidence, the more the IgG-based seroprevalence exceeds the two others (IgM- and IgA-based seroprevalence). Most extreme was the Polish seroprevalence which varied from 17·0% for IgA to 39·8 for IgG. IgG antibodies decay more slowly than IgM and IgA antibodies and therefore, if incidence is high, IgG antibodies tend to persist while IgA and IgM antibodies may decrease between subsequent infections.
When comparing the estimated seroincidences in the two Dutch cohorts we saw a decline over the period from 169 to 149 cases/1000 person-years. The same pattern was found in the incidence of reported cases which had a decline from 0·18 to 0·14 cases/1000 person-years. However, the study also shows that the annual number of reported cases can lead to a very skewed interpretation of the actual infection pressure. While we observed a ratio of seroincidence rates between Poland and Denmark of 6·34 (Table 2), the incidence of reported cases in the two countries was 0·42 cases and 0·29 cases/1000 person-years, respectively, which gives a rate ratio of 1·44. This underlines that inter-country comparisons based on officially reported surveillance figures and seroincidence ratios have a completely different interpretation. Our methodology – which in the current study has been extended to include formal comparisons of seroincidence between countries – offers an attractive alternative approach that can be used to evaluate surveillance systems and control programmes.
NOTE
Supplementary material accompanies this paper on the Journal's website (http://journals.cambridge.org/hyg).
ACKNOWLEDGEMENTS
The study was partly financially supported by MED-VET-NET, an EU Network of Excellence for research on the prevention and control of zoonoses (EU contract no. FOOD-CT-2004-506122), the Danish Graduate School of Biostatistics and the Faculty of Health Science, Copenhagen University.
The work by P.T. was funded by POLYMOD, EU-FP6 contract no. SSP22-CT-2004-502084. We are very grateful to Dinna Krüger and Tina Hansen, Serological Laboratory, SSI for their careful work and to Gerhard Falkenhorst, Division of Epidemiology, SSI, for his help with administration of the project.
DECLARATION OF INTEREST
None.


