


Introduction
Non-typhoidal salmonella (NTS) remains one of the most significant causes of foodborne disease worldwide. In Europe, it is second only to Campylobacter as a cause of gastro-intestinal infection and an important cause of foodborne outbreaks [1]. Whilst some of the approximately 2,600 serovars are host-adapted and cause extra-intestinal disseminated infections, most have a broad host range and circulate in multiple vertebrate species, causing localised gastroenteritis in hosts, but rarely invasive disease [Reference Kingsley and Baumler2]. Salmonella enterica serovar Typhimurium (S. Typhimurium) has traditionally been considered the archetypal broad host range serovar, although a growing body of evidence, initially from sero-, bio-, and phage typing, and now from molecular methods, indicates that the Typhimurium serovar could more correctly be considered as a collection of pathovariants that differ significantly in their degree of host adaptation [Reference Rabsch3]. Some pathovariants appear to have become host-adapted to wild avian species by a convergent evolutionary process akin to that seen in other host-adapted serovars, such as S. Typhi and S. Choleraesuis [Reference Bawn4]. However, these appear to have evolved as a distinct phylogenetic clade from a common ancestor, and the majority of variants associated with known livestock epidemics in the last 30 years have evolved as separate lineages from a basal ancestral broad host range variant. These include the definitive phage types (DT)104, U288 and the most recent monophasic S. Typhimurium (S. 4, [Reference Leekitcharoenphon5],12:i:-) sequence type (ST) 34, representing successive waves of dominant clones that have accounted for up to 60% of human infections for several years before a new strain arises [Reference Bawn4]. S. Typhimurium DT104 is estimated to have first arisen around the middle of the twentieth century, acquiring multiple drug resistance genes in the 1970s and disseminating widely throughout Europe and subsequently Asia and the Americas in the 1980s and 1990s [Reference Leekitcharoenphon5]. The epidemic of human infections with DT104 appeared to peak in the late 1990s in England, Wales, and Ireland, although it was somewhat later in other countries, including Scotland [Reference Helms6]. Although now overtaken by the monophasic S. Typhimurium ST34, which emerged in pig populations and spread globally [Reference Hauser7], likely due to enhanced resistance to heavy metals over other variants [Reference Branchu8, Reference Petrovska9], DT104 continues to circulate in animal populations, causing sporadic outbreaks in both animals and humans. A zoonotic outbreak in 2016, first identified in sheep, cattle, and horses in Anglesey, North Wales [10], presented the basis for this study.
Advances in typing technologies are transforming surveillance and outbreak investigations in animal and human health. In addition to providing valuable information about the population structure of salmonella, whole-genome sequence (WGS) data are becoming more widely used in epidemiology, providing high levels of sensitivity and specificity for detecting clusters of gastro-intestinal infections [Reference Allard11–Reference Dallman13] and source attribution for foodborne pathogens [Reference Dallman14–Reference Arnold17]. The UK Health Security Agency (UKHSA; formerly Public Health England) first adopted WGS typing of salmonella in April 2014, and routinely from 2015, using multi-locus sequence typing (MLST) to assign isolates to a sequence type [Reference Ashton18]. This was complemented by a method that introduced a strain-level nomenclature, known as the SNP address, based on single-nucleotide polymorphisms (SNPs) across the whole genome, providing fine-level typing [Reference Chattaway19]. The method uses hierarchical single-linkage clustering on a matrix of pairwise SNP differences relative to a reference genome. Clustering is performed at seven descending levels of SNP difference (250, 100, 50, 25, 10, 5, and 0 SNPs) to generate a seven-integer code, where each integer identifies the group membership at the corresponding level [Reference Dallman20]. UKHSA now routinely uses the SNP address as the primary method to prospectively monitor for clusters of cases of gastro-intestinal disease that are microbiologically linked, with automated methods that extract 5-SNP-level single-linkage clusters to assess for outbreak investigation [Reference Chattaway19]. The 5-SNP threshold has been demonstrated to give a high likelihood that cases relate to a common source, whilst analysis at the 10-SNP threshold may be useful to uncover wider epidemiological links [Reference Waldram21].
The Animal and Plant Health Agency (APHA) began trialling the UKHSA SnapperDB software [Reference Dallman20, Reference Dallman22] to assign SNP addresses to strains in 2018, as part of joint One Health activities, and now regularly implements it as an additional tool for characterising salmonella for surveillance and outbreak response. Salmonella surveillance in animals differs by several important aspects from that in human health, including active surveillance through the National Control Programmes; dealing with multiple animal species with different host-adapted salmonellae; and the fact that salmonella infections may persist for prolonged periods on livestock holdings, resulting in diagnostic samples from single premises being received at intervals of potentially months or years. Bearing this in mind, this study was undertaken with a view to exploring the use of the SNP address in outbreak detection in UK veterinary surveillance. In 2016, there was a human outbreak of S. Typhimurium DT104 (designated t5:459), where veterinary salmonella isolates identified through normal surveillance were sequenced and had SNP addresses generated at UKHSA and confirmed to cluster genetically with each other and with human isolates. Veterinary investigations verified epidemiological links between several premises from which isolates originated. APHA was subsequently able to define its own SNP address for the outbreak and generate a phylogeny from further current and historic sequenced isolates to place the outbreak strain within the context of the population of UK S. Typhimurium isolates from animal species. This study examines how two readily available early detection models functioned when applied to incidents defined by SNP address, to help adapt or develop early detection systems for the near future. The t5:459 outbreak was used to examine the timeliness of cluster detection using the SNP address in comparison with the phage-type definition.
Methods
Sample selection for sequencing and SNP address generation
Under the Zoonoses (Amendment) (England) Order 2021, laboratory isolations of salmonella from British livestock must be reported to APHA, generally followed by the submission of samples to APHA laboratories. However, only a small subset was sequenced each year on a risk basis; additional isolates were sequenced for specific research projects or during outbreaks. Three previous projects generated sequencing data that were suitable for this research, with all sequencing carried out between 2015 and 2019. Project RDOZO347, described by Mellor [Reference Mellor23], contributed 406 sequences, investigated the historical context of DT104, and sequenced isolates from 1992 to 2016. Isolate sources included livestock, companion animal, and environmental samples and were either DT104 or a related phage type (including DT104b, U302, DT120, and DT12 isolates). Most isolates with a known sequence type were ST19, plus five ST34 isolates.
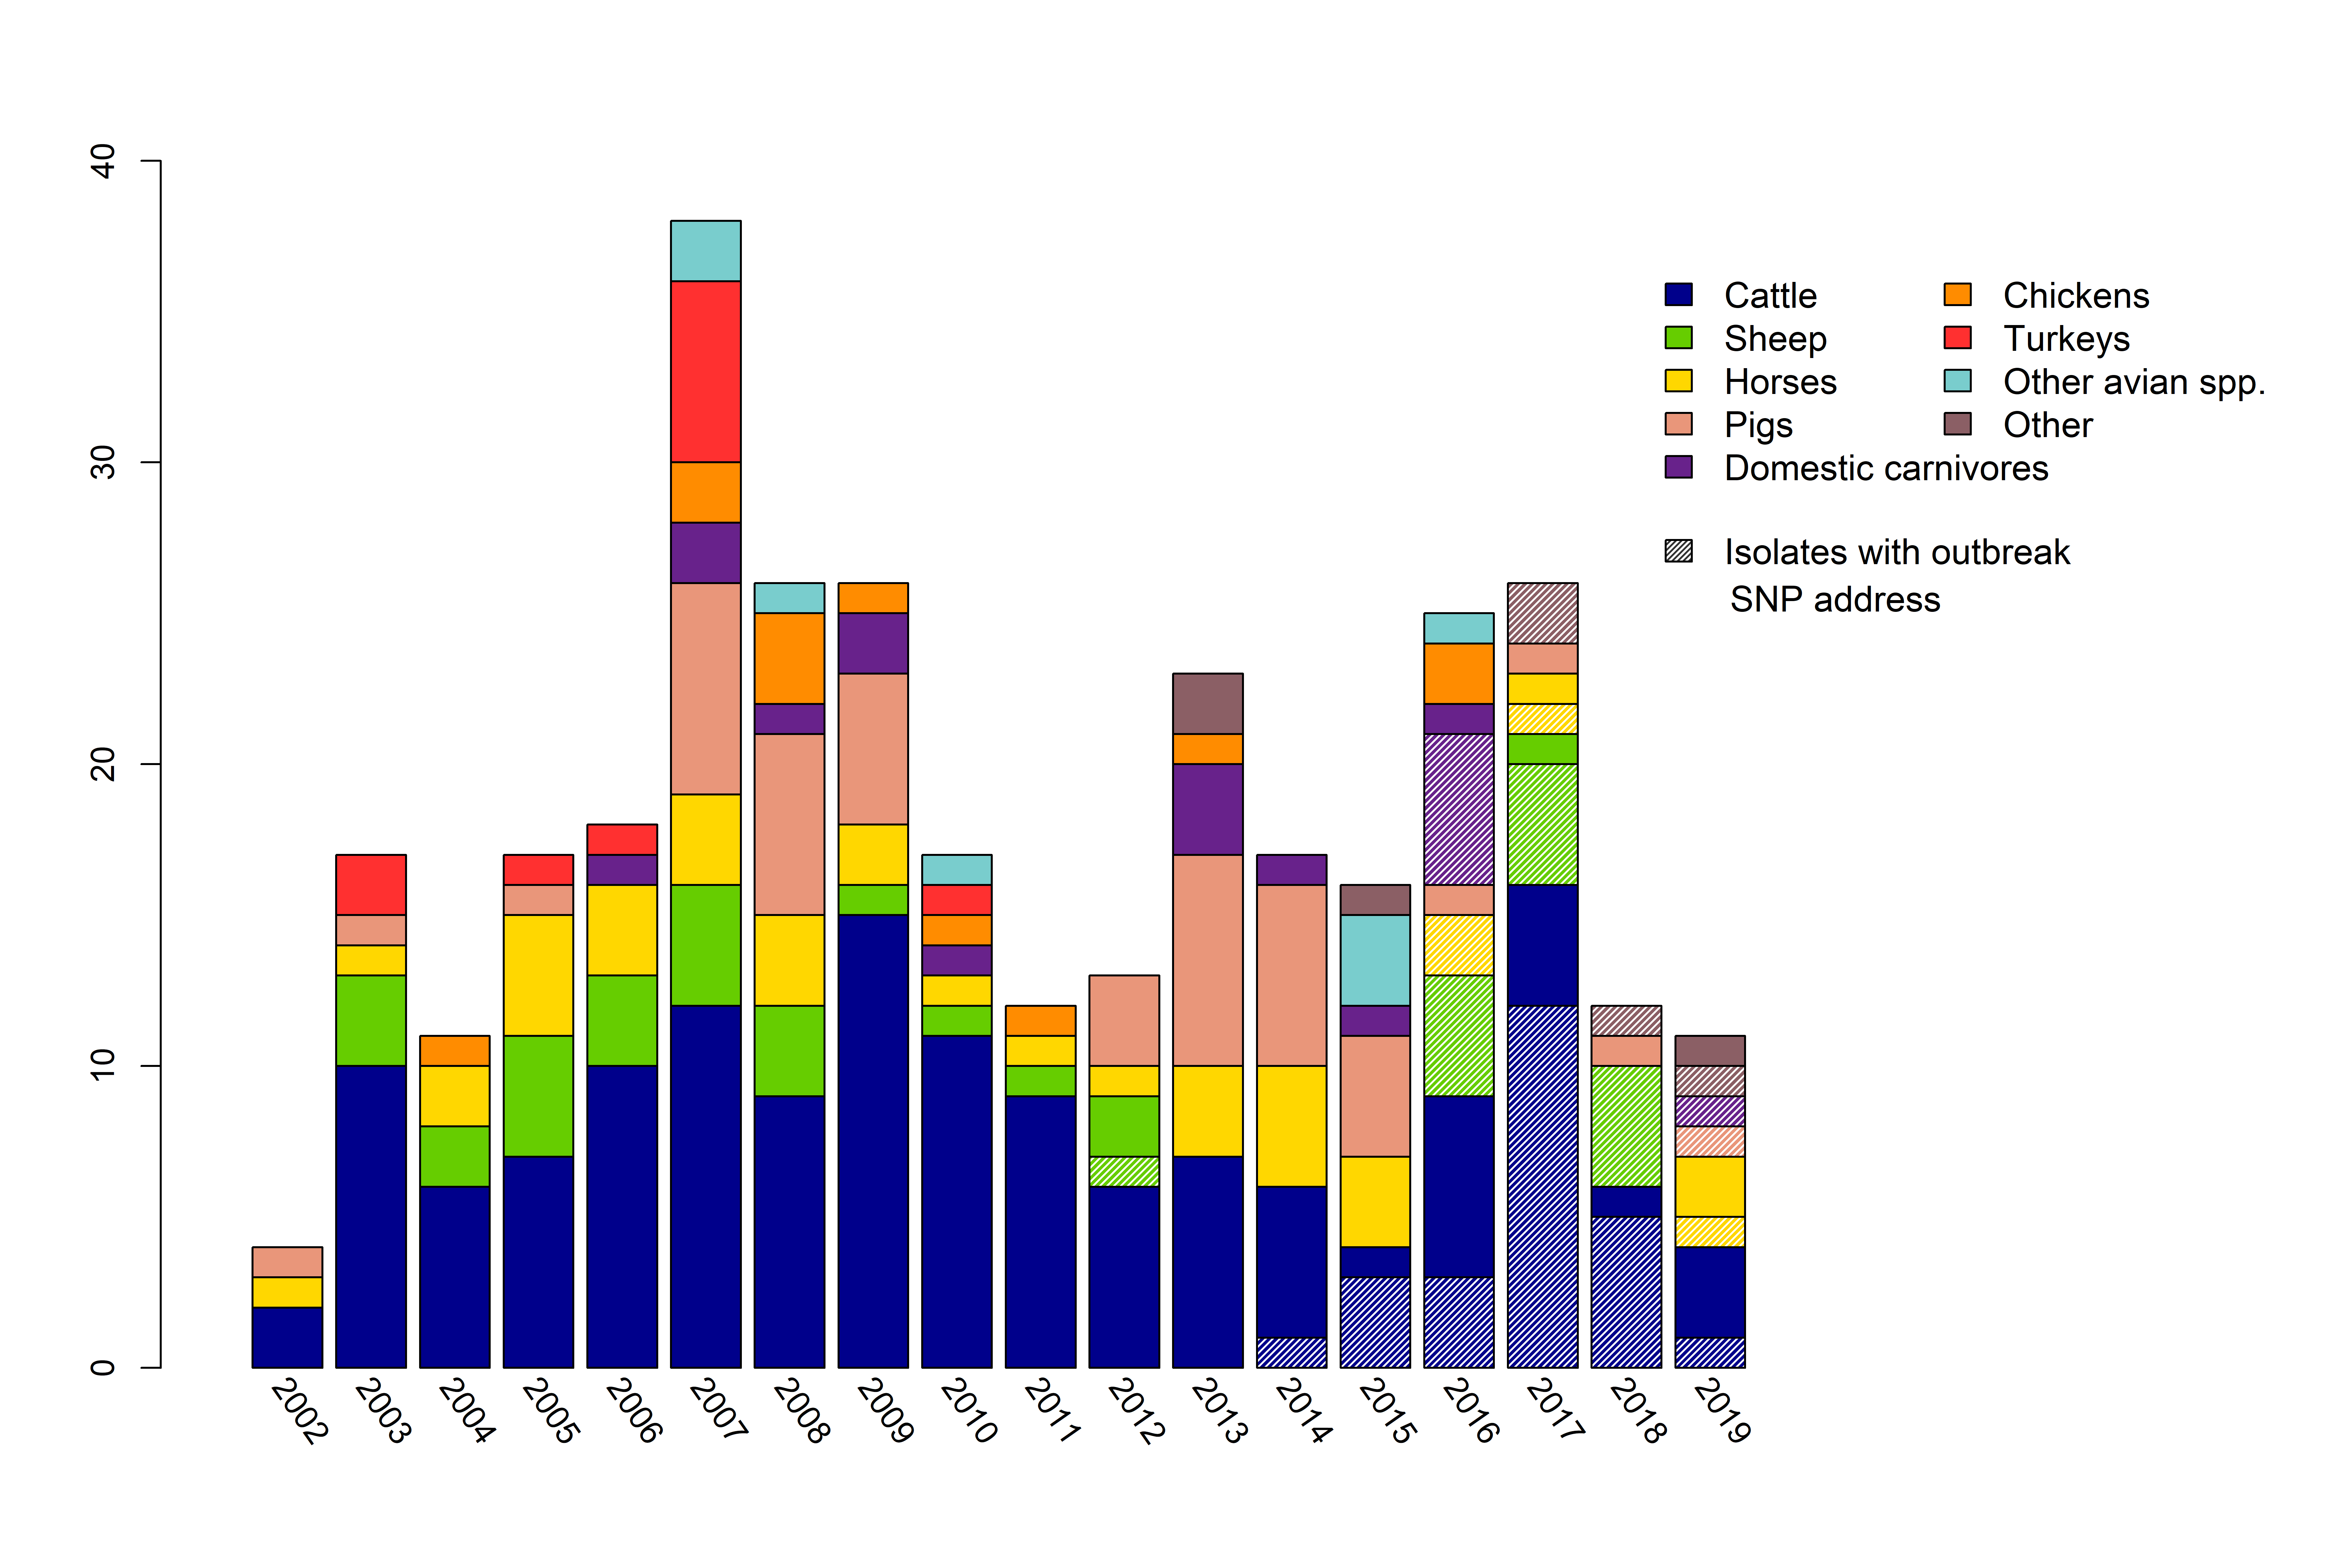
Sequence data for a further 39 isolates (collected from 2014 to 2017) were generated under APHA’s SE553 Project [24], and a further 55 sequences were taken from the CR2000F project (2017 to 2019). These projects focused on generating sequencing data for isolates known or suspected to have a link to the t5:459 outbreak; the internal project reports contain sensitive information and are not in the public domain. Ninety isolates were DT104/ST19; two isolates were U302/ST19; and of two further DT104 isolates, one was ST34 and one was not typable. Isolates encompassed all sources as above, but with a heavy bias towards cattle and sheep, the main species implicated in the outbreak (Supplementary Figure S1).
DNA extraction and sequencing
Genomic DNA of all isolates was extracted with the KingFisher MagMAX™ CORE instrument and the MagMAX™ CORE Nucleic Acid Purification Kit (Thermo Fisher Scientific, UK) from 270 μL of overnight cultures in LB broth, following the manufacturer’s instruction. DNA concentrations were normalised before sequencing library generation with the Nextera XT Kit following the manufacturer’s instructions (Illumina UK). Libraries were normalised and pooled before running on an Illumina MiSeq or NextSeq instrument to generate 150 base pair paired-end reads. Sequencing data were demultiplexed, and sequencing adapters were removed with bcl2fastq software (Illumina UK) to generate per-sample raw data fastq files.
Sequencing data analyses
Sequenced isolates were analysed with an APHA in-house in silico serotyping pipeline [25] to confirm the serovar. Essentially, the Salmonella bioinformatics pipeline (publication in preparation) runs the following tools: fastp, FASTQC, KmerID, and Quast (quality control software); Shovill (genome assembly); SeqSero, MOST, and SISTR (serotype determination); and SRST2 for each sample. The combined outputs from these tools generated sequencing quality metrics, a genome assembly (and the associated metrics), 7-gene MLST profile, and an assigned serotype according to three different tools. Finally, a consensus serotype Typhimurium was assigned based on the output from the three approaches. SNP address generation was performed at the clonal/eBURST group level using SnapperDB [Reference Dallman20]. A pairwise distance matrix of SNP distances was calculated and used to generate an isolate-level hierarchical clustering nomenclature – the SNP Address – using S. Typhimurium AE006468 as the reference genome. The seven levels of the SNP address were then used to create a simplified pairwise matrix and dendrogram (Figure 1).

Figure 1. Dendrogram of SNP addresses from 329 incidents. The outbreak clade, which shares SNP address with the t5:459 human outbreak strain, is shown in red.
Data processing
To obtain location data and produce the data set of phage-type isolates, all records of S. Typhimurium serovars identified between 1 January 2002 and 30 September 2019 were extracted from the APHA salmonella database (25,335 records). Before 2002, location data were not routinely collected, and thus, sequenced isolates from 1992 to 2001 were excluded from most analyses (exceptions are noted below.) The data fields queried from the database were the date of sample collection, the location where the sample was obtained, the species or source from which the sample was collected, and the reason for sample submission and phage type. Location data were one or more of the following: business name, address, postcode, grid reference, or, for agricultural premises only, the holding reference number. Records were sequentially removed from the data set if they were missing phage type (n = 9,845), date (n = 32), were duplicate records (n = 3,080), or did not contain sufficient location data to establish the postcode or the postcode was not within the mainland UK (n = 2,534). Among sequenced isolates (n = 500), all had complete data for phage type and date, but 82 were removed at the location data step; of which, all but two were collected before 2003.
An online tool (https://gridreferencefinder.com/postcodeBatchConverter/) generated an approximate latitude and longitude for each record using the postcode centroid. Unique identifiers were created for each premises to differentiate those that shared postcodes. Where postcode sharing was due to the simultaneous presence of multiple premises within a small area, coordinates were manually adjusted to the true location of each premise to avoid overlap. Premises that sequentially shared a location due to a change in ownership or use were counted as separate premises. Overall, 3,269 postcodes and 3,349 premises were identified.
Data were next aggregated to the case level. Sixty per cent of premises had only one isolate (range 1–409). Our definition of a ‘case’ was similar to the definition of ‘incident’ used in salmonella surveillance [26] as either the first and subsequent isolations of a particular definitive phage type from an animal, group of animal, or environment on a premises (DT cases; n = 4,165), or as the first and subsequent isolations of a particular 5-SNP address (SNP cases; n = 329). However, unlike the usual definition of an incident, no constraints were placed on the time elapsed between isolates belonging to the 5-SNP group or phage type to count them as the same case, due to the sporadic nature of available genetic data. For all subsequent related isolates, the time since the first detection of the DT or SNP case on the premises was calculated. At this stage, premises where animals were not permanently kept (e.g. abattoirs, butchers, laboratories, and referral veterinary clinics) were identified with multiple submissions. These could not be classified as single cases, as the animals tested would likely have originated from a variety of sources, but could potentially trigger apparent spatial clusters; therefore, it was decided to remove these records from the data set entirely (n = 56, including two sequenced isolates). Similar premises with only a single submission were retained, as removal of all such records would remove a larger proportion of companion animal isolates compared with the tiny fraction of livestock samples collected from such premises, and companion animal isolates were already relatively low. Although this means that the spatial data for these samples are not necessarily the same as that of the animal source, nevertheless it can give an indication of epidemiologically linked premises.
Sources were grouped into nine categories: cattle, sheep, horses, pigs, and domestic carnivores (incorporating cats, dogs, and ferrets); chickens, turkeys, and other avian species (incorporating ducks, quails, psittacines, and groups of mixed avian species); and Other (incorporating environmental samples, reptiles and amphibians, and samples where the source was defined as ‘Other’ in the original database).
Defining outcomes of interest
Based on UKHSA’s previous published work [Reference Waldram21] and preliminary examination of the data set, it was decided to test outcomes defined by both the 5-SNP and 10-SNP clustering thresholds on the data set of sequenced isolates. A 12-month rolling average was calculated, for each threshold level, of the proportion of cases contributed by each SNP group. As a comparator, analyses run using the whole cleaned data set of phage types also used two levels of outcome. Firstly, cases were defined as belonging to the DT104 group if they comprised any DT104, DT104 variant, or U302 phage type; secondly, analyses were run separately for DT104 and U302 phage types only.
Statistical methods
The Farrington method [Reference Farrington27] is a log-linear model that calculates an expected value of cases for the current time period based on historical data, and a threshold above which an observed count is declared to be unusual. It can adjust for overdispersion, seasonality, secular trends, and past outbreaks and is currently used in the APHA Early Detection System (EDS) [Reference Kosmider28] to detect potential salmonella outbreaks using serotype, phage type, and antimicrobial resistance patterns. Models were run in R using the farrintonFlexible function from the package ‘surveillance’ [Reference Salmon, Schumacher and Höhle29], using 5 years of historical data, with a half-window of 1 month. A two-thirds power transformation was included to adjust for overdispersion where there were low counts of cases. The model has a default threshold of no alarm if there were fewer than five cases in 4 weeks. Given the very low numbers of any given SNP address overall, the model was run both using the default threshold and a lower threshold of no alarm if there were fewer than three cases in 12 weeks. Farrington models for the SNP cases included pre-2002 cases, due to the overall low number of isolates with sequence data. For the phage-type models, only the cleaned post-2002 data were used, as it was not possible to determine isolates originating from the same case without accompanying location data.
SaTScan™ [Reference Kulldorff30] is free software that includes a prospective space–time permutation scan statistic, designed to scan a defined geographical area to detect outbreaks of any scale or location that are still in existence at the end of the scan period [Reference Kulldorff31]. We elected to use a Bernoulli model, where cases and controls are defined, and which searched for circular spatial clusters where the expected risk of being a case was significantly greater within the cluster than outside of it. Although the software can conduct a prospective scan using only cases, it was felt that it was important to consider the underlying population, as the sample collection was geographically biased due to the outbreak investigation contributing isolates over and above those arising from routine passive surveillance. For models using the sequenced data, cases were defined as the SNP group of interest and controls as any other SNP group. Only sequenced isolates from 2002 onwards were used, which could be matched with location data in the cleaned data set. For the phage-type models, controls were any phage type other than DT104 (including variants) and U302. To simulate the kind of regular scanning that would be undertaken as part of routine surveillance, sequential data sets were created for each quarter (3 months) from March 2003 to September 2019 containing data on all cases and controls up to that time point, and the models were applied to each data set in turn. Space–time clusters identified by each model were scrutinised with respect to the cases allocated to that cluster, to determine whether they were novel or had been detected by previous models. To be defined as a new space–time cluster, at least 50% of the cluster cases had to have not been allocated to any space–time cluster in any earlier model. Space–time clusters were allocated an identifying letter: Those with spatial overlap, but no temporal continuity with an earlier cluster – that is the space–time cluster was not detected by sequential models, but had one or more intervening quarters where it was absent – were allocated the same letter with a subsequent number to differentiate them (such as β and β:1). Clusters were also mapped and tabulated, to cross-check their distributions in space and time and to compare the detection and p-values across the different models. To test for associations between sample source and cluster inclusion at any point, chi-squared tests were used, or Fisher’s exact test, if categories contained five or fewer expected observations.
Results
Descriptive analysis of sequenced isolates
SNP isolates came from 310 premises, 247 with a single isolate and 63 premises with between two and nine isolates. On 39 premises, the additional isolates were deemed to belong to the same case, regardless of whether cases were classified by phage type or SNP address. Eight premises with sequenced isolates were identified as having two or more DT types (Supplementary Table S1), although on seven of these, the isolates of different phage types were allocated to the same SNP-5 group. There were 17 premises with additional isolates that clustered only above the 5-SNP threshold and were thus defined as having multiple SNP cases (Table 1). On only one of these premises were the isolates also differentiated by phage typing. A comparison of genetic distance versus time interval between all intra-premises isolate pairs confirmed a tendency for the median time difference to increase with higher thresholds of SNP clustering, up to the 25-SNP level (Supplementary Table S2). However, on six livestock and one non-livestock-keeping premises, isolates that clustered only above the 10-SNP threshold were collected within a week of each other (Table 1). Conversely, although 85% of isolate pairs (n = 132/156) falling within the same 5-SNP or 0-SNP cluster were collected less than three months apart, there were seven incidents, where isolates in the same 0- or 5-SNP cluster could be identified more than six months after the original sample was collected, and two incidents, in cattle and sheep, where isolates in the same 5-SNP cluster were identified on the same estate over two years later. Also, in cattle, two isolates in the same 5-SNP cluster were found on two neighbouring farms over three years apart.
Table 1. Premises where two or more isolates were sequenced and more than one SNP case identified

a Multiple isolates collected on the same day with ≤5 SNP differences have the 0 SNP groups represented as ‘x’.
b The number of days elapsed is between this and the most closely related previous sample, that is the first one from this case. An identical isolate was found on linked premises 329 days later.
Selection of strains to trial detection methods
Figure 1 shows a dendrogram of the first detected isolates from all cases with SNP data, clustered by the seven levels of SNP address. The t5:459 outbreak cluster (SNP-5 group 7) is highlighted and falls within the largest 25-SNP cluster, which comprised 76% (n = 249) of incidents. Within this group, there were 74 different 10-SNP clusters and 107 5-SNP clusters. The t5:459 outbreak cluster comprised 72 isolates from 53 SNP cases. The field epidemiological investigations at the time of the outbreak linked the first reported case in humans to a case of salmonellosis in cattle in April 2014. However, this data set shows an isolate from a sheep in Anglesey, collected in March 2012, within the same 5-SNP cluster, suggesting that this strain had been circulating in animals for at least two years.
Using a twelve-month rolling average, four 10-SNP clusters were identified that contained at least five cases and had contributed at least 20% of cases in the previous 12 months (Figure 2). Six 5-SNP clusters, including the 2016 outbreak cluster, also met the above criteria and were all subgroups of the identified 10-SNP clusters. Three were located within the same 10-SNP cluster (SNP-10 group 5), along with twelve other 5-SNP groups each of one or two isolates. SNP-5 group 1,195 contained more than 50% of the cases within its SNP-10 group 450 supergroup, as did SNP-5 group 221 with respect to SNP-10 group 88. In contrast, the t5:459 outbreak group did not cluster with any other incidents within the 10-SNP threshold.

Figure 2. Twelve-month rolling averages of the proportion of cases contributed by different SNP groups, with breakdowns of the 10-SNP clusters contributing at least five incidents overall, and 20% or more of all cases in any 12-month period. All cases within SNP-10 group 7 belonged to the same subgroup (SNP-5 group 7).
A total of nine SNP groups were selected to use as case definitions for all cluster detection models, six at the 5-SNP level and three at the 10-SNP level. For the SNP-5 group 7 (t5:459 outbreak) strain, models at the 10-SNP level included no additional cases, they were identical to 5-SNP level models and are not shown. Three additional case definitions were used for SaTScan models only, as they either had fewer than five incidents and therefore would not meet the default alarm threshold for Farrington models, or the 5-SNP and 10-SNP groups contained identical incidents. The full list of case definitions is shown in Table 2.
Table 2. Case definitions for models

Farrington models
Figure 3 shows the months where the number of cases was in exceedance of the threshold calculated by the Farrington models. Except for SNP-10 group 88 and its subgroup SNP-5 group 221, the other ten models raised at least one alarm during the study period. All alarms raised at the default threshold (five cases in four weeks) were also included at the low threshold of three cases in twelve weeks, and whilst this threshold decrease resulted in only one or two additional alarms in the phage-type models, there were between 1 and 8 additional alarms (median 3) in the SNP models, excluding those where no alarms were raised.

Figure 3. Monthly alarms raised by Farrington models with a five-year run-in period for different case definitions. The default model threshold suppressed alarms if there were fewer than five cases in 4 weeks. The low threshold models suppressed alarms if there were fewer than three cases in 12 weeks. The total number of cases for each model is shown on the left (n). Greyed-out areas show where there are no predictions (run-in period or earlier).
There was some overlap between alarms raised by the 10-SNP models and those run on their 5-SNP sub-cluster(s), and between the DT104 group and phage types DT104 and U302, but in no case was there complete agreement. SNP-5 group 20 and SNP-5 group 976 raised one and two additional alarms, respectively, that did not appear in their supergroup, SNP-10 group 5. Both SNP-10 group 5 and group 450 raised alarms that did not correspond with any seen in their modelled subgroups. Phage-type models at the subgroup level also raised alarms that were not observed at the supergroup level and vice versa.
For the t5:459 outbreak, the earliest alarm was raised in January 2016 by the low threshold SNP model. The default threshold U302 phage-type model raised an alarm two months later, and the default threshold SNP model, DT104 phage type, and the DT104 group models each raised an alarm five months after that. No other concordance between the phage type and SNP group models could be confidently identified. The closest alarms were in November and December 2006 in the DT104 group model, followed by an alarm in January 2007 by the SNP-10 group 5 (low threshold) model. The 23 phage-type incidents in November were predominantly in pigs, cattle, and turkeys and widely dispersed across the whole of Great Britain; likewise, the three incidents in the SNP model were in different species and widely dispersed. A second pair of alerts close in time was raised by the SNP-5 group 976 model in July 2006 followed by one in the U302 phage-type model in September of the same year. However, it seems unlikely that these are related, as no sequenced U302 isolates (n = 35) were in the SNP-5 group 976 or its supergroup, SNP-10 group 5.
SaTScan
A total of twelve SNP addresses were used as the case definition in the Bernoulli models, with controls defined as any other SNP addresses. Space–time clusters were detected at both the 5-SNP (n = 16) and 10-SNP (n = 10) level models. All SaTScan models run on SNP cases identified statistical case clusters earlier than their corresponding Farrington models. In addition, the 5-SNP level addresses within the SNP10 group 450 supergroup, which could not be used in Farrington models, as there were fewer than three isolates, recorded detectable clusters in SaTScan models. When first detected, seven of the clusters identified in the 5-SNP models were deemed statistically significant (p-value <0.05), whereas none of the SNP-10 clusters were, though one had a p-value of 0.051 at first detection (Table 3 and Supplementary Table S3). Both the minimum number and median number of cases in a cluster at first detection were 2 for the SNP-5 models and 3 for the SNP-10 models, although there was more variation observed between the different SNP sets than there was between SNP-5 and SNP-10 levels belonging to the same set. Space–time clusters tended to remain relatively consistent over subsequent sequential models, with some shifts in radius and location, and the occasional appearance of a clearly distinct secondary cluster (Figure 4).
Table 3. SaTScan detection of space–time clusters of cases with sequenced isolates between March 2003 and September 2019

Note: For each model, controls consisted of all other sequenced isolates.
a The risk ratios are often infinite because all cases are included in the circle.

Figure 4. Examples of SaTScan space–time clusters detected for different SNP-5 groups for four quarters of 2010. Cases are shown as dots, and circles show the model clusters. The colour intensity of the circles is related to the P-value returned by the model, with darker circles having lower P-values.
Models run on the DT104 group data detected 35 distinct clusters, with between two and eight detected at every time interval (Supplementary Tables S4 and S5). The minimum number of cases in a cluster at first detection was 5, and the median was 7. Only one cluster had a p-value of <0.05 at first detection – although this cluster was, more accurately, a continuation of an earlier cluster that split into two distinct foci. Longitudinal tracking of clusters showed that some remained stable over time, whereas others appeared only transiently, shifted in size and location, merged, or even split and recombined (Figure 5). Six clusters presented a p-value of <0.05 at some point in their lifespan, though this could be up to two years after the first detection.

Figure 5. SaTScan clusters detected for DT104 group models for 2009 and 2010, with an example of a splitting cluster (δ becomes δ:1 and δ:2). The δ:1 cluster appears only transiently in the first quarter of 2010.
The t5:459 outbreak was initially detected, after just two cases in Anglesey, in June 2014 by the SNP-5 level model (SNP-5 cluster A). The earliest detection by the DT104 group models was in March 2016, although a transient cluster centred on the Llŷn peninsula was detected in June 2012, which included the earliest known case in a sheep on Anglesey with the outbreak SNP address. None of the other cases in this cluster had any sequence information.
The animal source of the sample appeared to influence its likelihood of being included in a cluster for the SNP-5 level (Fisher’s exact test: p < 0.0005), the SNP-10 level (Fisher’s exact test: p < 0.0005), and the phage type (chi-squared statistic: 38.7, df = 8, p < 0.0001) models. For all models, cattle and pigs contributed strongly to the test statistic, with cattle incidents being more likely and pig incidents less likely to be included in clusters (Supplementary Table S6). Sheep and turkeys were also more likely to be included in SaTScan clusters across model types, whilst chickens, equids, and other avian species were less likely to be included. Domestic carnivores did not show an association either way, although they were included in 20% of the SNP clusters at the cluster’s first appearance, despite forming only 6% of the sequenced samples.
Discussion
In this study, we have applied, to S. Typhimurium isolates, a form of strain differentiation that is relatively new to the field of veterinary surveillance. Early detection of serovars, phage types, and AMR patterns in veterinary isolates has been routinely carried out for salmonella in Great Britain as part of passive surveillance activities, but the transition towards molecular methods for differentiating salmonellae in the laboratory now demands an adaptation of epidemiological methods to incorporate the increased typing resolution that WGS brings. The SNP address has proved its ready accessibility to existing surveillance methods in the human sphere [Reference Chattaway19, Reference Waldram21]; this study provides an initial investigation of its applicability to the veterinary field using historical data sets.
Two methods of outbreak detection have been explored here, and comparisons have been drawn between using single-linkage SNP thresholds at the 5- and 10-SNP level and the traditional phage-type method to define cases. Although we used only one verified outbreak to explore the sensitivity and timeliness of the methods prospectively, the exploration of further SNP addresses has provided insights into how the methods are likely to behave going forward, and potential problems and pitfalls that may be encountered.
The Farrington models provided a robust, easy-to-implement method of detecting a higher-than-expected number of cases and, for the SNP addresses, detected an exceedance after a relatively small number of cases. The weakness of exceedance methods is when serovars or phage types are very common, as the models lack the sensitivity to detect small increases in case numbers, but WGS may provide a way of narrowing the resolution of the data and thus making it easier to pick up a rapid increase in the detection of a particular strain or group of strains. The level of resolution was easy to adjust using different levels of the SNP address, although it was not clear whether using either the 5- or 10-SNP level gave a particular advantage. As single-linkage clustering is impacted by population coverage, additional sampling could lead to the subsequent merging of SNP-5 groups, and therefore, surveillance at the SNP-10 level may be easier to implement on a purely practical level. The alarms raised by the different SNP addresses were temporally limited, compared with the phage-type models that raised alarms across the whole time period analysed. Alarms raised by the groups with the largest number of incidents (SNP-10 group 5 and subgroups and SNP-5 group 7) appeared approximately correlated with temporal clusters of the phage-type alarms, although the missing data from the early years in the phage-type models precluded any formal analysis of this. The SNP models with fewer incidents (SNP-10 groups 88 and 450 and corresponding subgroups) did not demonstrate corresponding alarms in the phage-type models.
With respect to the t5:459 outbreak, the SNP address did not raise alerts any earlier than the phage-type case definition. Both models first identified an exceedance in August 2016 using the default threshold, although at the lower threshold of three cases in 12 weeks, the SNP address detected the first exceedance in January. However, for routine use, lowering the threshold would need to be carefully trialled, as the decreased specificity may result in unnecessary investigations. Lowering the specificity of the model by adjusting the default exceedance threshold identified more clusters, and was necessary in this data set, due to the relatively low proportion of sequenced isolates compared with overall salmonella submissions. Where total case numbers were low, as with many of the SNP group models, the time interval between cases was generally too large for the models to raise any alarms using the default threshold. The effect of changing the threshold was much less in the phage-type models as the number of phage-type cases was orders of magnitude greater than the number of SNP cases. As these models do appear to be relatively sensitive to the number of cases, their future potential for routine surveillance is likely to depend on the number of sequenced isolates available. A further possibility that could be explored using sequence typing would be cgMLST, which may give sufficient numbers of related cases, but offer a better resolution than phage typing.
The space–time models created using SaTScan appeared to give a distinct advantage over the Farrington exceedance models for more timely detection of clusters, in all cases detecting clusters earlier than their Farrington counterparts, often after only two or three cases. Interestingly, this was not only true for cases that were very localised, such as the t5:459 (SNP-5 group 7) and SNP-5 group 1,223, but also when the cases were more spatially distant, such as SNP-5 group 1,170, where the first three cases occurred in East Yorkshire, Staffordshire, and Essex. For the t5:459 outbreak strain, the SNP address models first detected a space–time cluster in June 2014, whereas the phage-type models’ first detection of a space–time cluster in the same location did not occur until March 2016 (with the first p-value <0.05 not occurring until December 2016). The SNP address models were also considerably easier to interpret, with only one to three clusters appearing at any time point. Mapping the space–time clusters at sequential timepoints clearly indicated which were persistent and which were new. Identification of persistent space–time clusters, especially those spreading, either locally or into new areas, may be the flag that would trigger an investigation, as an indicator that a strain is successful, in the evolutionary sense, in the veterinary sector and becoming prevalent enough to pose risks to human health. The phage-type models, on the other hand, were much more laborious to interpret, with many more transient clusters, cluster splitting, recombining, or suddenly shifting in size and location, making tracking of clusters over time a labour-intensive process. There is a potential risk that, as more isolates are routinely sequenced and the data sets get larger, this could also apply to SNP address models. However, from the data for SNP-10 group 5, which was already in existence at the start of the study period and had a more widespread distribution of incidents around the country, this did not seem to be the case. A small number of models were also trialled using SNP address as cases and any other sequenced or non-sequenced incidents as controls, to see whether the number of controls in the background population affected the detection of the SNP clusters (data not shown). Neither the identification of the clusters nor their relative risks or p-values appeared dramatically altered, which suggests that the method could work equally well with larger data sets of sequenced isolates going forward. Furthermore, the data here indicate that the SNP clusters were time-limited, in a way that phage-type data were not, with strains arising and being superseded, making it easier to distinguish between new and existing clusters. Some of the explanations for the sudden shifts in the phage-type clusters may be due to them incorporating more than one strain of unrelated salmonella within the DT104 phage type that overlapped in time and space.
Although the SNP address appears to perform satisfactorily in both methods for detecting an exceedance of cases retrospectively, a fundamental issue for both methods is how to decide which SNP addresses to run any models on. In a routine surveillance context, the ‘outbreak’ strain in the currently used EDS model would have been unlikely to have been run until there were at least five sequenced isolates and thus an exceedance may not have been detected as early as suggested by the models shown here. Deciding what outcome to use for the EDS is fundamental and identifying new strains for the EDS to look for requires much time and effort. Using the 12-month rolling average to identify SNP groups with a large or rapidly increasing share of the caseload was a straightforward way to identify SNP addresses to investigate here and would be amenable to automation. One of the main drawbacks of SaTScan was the requirement for manual upload of data, which would have made it unfeasible to run many models for different SNP addresses in SaTScan on a regular basis. A potential solution tried was the multinomial SaTScan model, which avoids the issue of having a priori knowledge of which strain to look for. However, this performed poorly in early trials on our data set, which was thought to be due to the large number of categories. Recently developed packages allowing SaTScan to interface with R software may make routine use of this programme more feasible, and from the fact that almost all the SNP clusters tended to show spatial, as well as temporal clustering, it seems likely that incorporating a spatial element into routine detection models would give an advantage over relying on temporal clustering alone. This is perhaps more important in veterinary surveillance, due to the expected substantially lower coverage of animal diagnostic samples tested compared with human samples.
The 2016 DT104 outbreak, on which this work was based, defined livestock incidents as cases if their SNP address was within the same single-linkage cluster at the 5-SNP level as the human outbreak strain. In human cases, the 5-SNP threshold is used for outbreak investigations due to the high likelihood that cases relate to a common source, whilst analysis at the 10-SNP threshold is undertaken to uncover deeper epidemiological links [Reference Waldram21]. The same SNP address levels appeared to work well here, and the fact that >75% of isolates fell within the same cluster at the next highest level of SNP address makes it seem probable that analysing at any higher level may lose the advantage of the greater resolution provided by the SNP address over the phage type. This was born out by some of our earlier trials with detection models run on different levels of the SNP address (not shown here). However, previous studies have found that whilst the number of SNP differences between isolates within outbreaks is usually small (2–12 SNP differences) larger differences of up to 249 SNPs may exist and may be dependent on the serovar [Reference Leekitcharoenphon5]. The SNP differences between strains may also depend on the SNP-based sub-typing workflows used [Reference Saltykova32]. Batch effects, that is technical sources of variation in subsets of sequencing data arising from DNA extraction, technician skills, library preparation, sequencing lane differences affecting coverage, or bioinformatics tools used for trimming and assemblage, are a potential issue even where all work is carried out within the same laboratory. These have been noted as a particular source of bias in multi-year projects [Reference Leigh33] where samples are added incrementally and allocation to different libraries and lanes cannot be fully randomised. Whilst this work used three different sets of sequencing data generated at APHA, and there was relatively little temporal overlap between the samples selected for inclusion, we did note that there were eleven 5-SNP clusters that contained samples sequenced under different projects. Although we cannot rule out false SNP differences in this data set, it appears that the SNP address may be relatively robust to these types of information bias, even at the 5-SNP threshold. However, we would stress the need for thresholds at which to include or exclude cases to be considered on an outbreak-by-outbreak basis, especially if multiple laboratories with different pipelines begin to contribute to sample testing. Where the single-linkage threshold chosen is too discriminatory, cases may be wrongly excluded; however, it is too inclusive and much time is spent investigating cases that are not related.
Thus, for the definition of a strain using SNP address to be most useful, studies looking at background strain diversity are required, both between and within farms, in order to inform how many samples need to be collected and sequenced to identify outbreak incidents. If there is high diversity within a phage type, many more samples might be needed per farm than if using serotype or phage type as the classifier. The temporal aspect also needs to be considered, as a rapidly changing organism may be misclassified by the single-linkage clustering method as a new strain, especially if the coverage of samples being sequenced is low, as intervening isolates are more likely to be missed. This could potentially be countered by progressively relaxing the cut-off chosen for classifying cases as part of the same outbreak as time intervals between samples increase. However, we also demonstrated isolates within the same SNP-5 cluster that were collected over two years apart. Leekitcharoenphon et al. [Reference Leekitcharoenphon5] were unable to find an association between time of isolation and the number of SNP differences and suggested the existence of groups of isolates that comprise single clonal haplotypes with virtually no genetic change over time. Knowing more about changes in strains over time will be particularly important, as it is apparent that clusters and indeed outbreaks can span many years.
Animal host species would also appear to be an important consideration for the application of the SNP address to early detection. It was unsurprising that cattle and sheep had an above-average chance of appearing in SaTScan SNP clusters for the sequenced data, given that this data set was neither random nor representative, but augmented by the outbreak investigation. It was more surprising that cattle and sheep were considerably more likely to be included in phage-type clusters, along with turkeys, whilst pigs, chickens, horses, and other avian species were much less likely to be included. The reasons for this could be multi-factorial, including things such as uneven host population densities; different movement and mixing patterns in different livestock species; national salmonella control plans applied to poultry, thus lowering S. Typhimurium risk in these, but not other species; or bacterial factors, such as the predominance of monophasic S. Typhimurium ST34 in pigs, and more competition or cross-protection from this or other serovars. The effect of the host species on the bacterial diversity will thus also need to be determined to develop effective ways to use the SNP address.
The use of the SNP address in the case definition will also depend on the strain in question, as a new or rare strain would be valuable in defining cases, a more common strain that is present over much of the population would be less so. The changes over time could be most clearly seen for the SNP clusters that arose during the study period, whilst it was more difficult to interpret the clusters for SNP-10 group 5 and subgroups, which were already the dominant strains in 2003, and more widely dispersed over the country. This same caveat can be applied to serotype or phage-type classification, as was evident from our models using the phage type as the case definition. Prospectively, SNP clusters detected from passive surveillance data will need to be verified using epidemiological information and proven transmission links. Using surveillance data at UKHSA for the seven most common salmonella serovars (Enteritidis, Typhimurium, Typhi, Paratyphi A, Java, Agona, and Newport), Waldram et al. [Reference Waldram21] only found a significant epidemiological link for 17 of 32 clusters of isolates. However, Ågren et al. [Reference Ågren34] have shown that cattle herds with known epidemiological contacts generally showed smaller SNP differences between S. Dublin isolates than where no known links were found.
In conclusion, this work demonstrated that SNP addresses could perform well for detecting outbreaks in a timely manner, although a large number of different strains will pose challenges and will only be feasible if systems can be automated. As the SNP address becomes integrated into routine typing methods for all salmonella submitted to APHA laboratories, larger data sets are likely to soon be available to start answering some of the questions about background diversity, although more targeted and systematic sampling will be needed to answer some of the other questions posed about the influence of time, space, and species on cluster detection. It is also worth noting that there is an urgent need for international consensus about how WGS data are used for typing. Currently, an SNP address is run per institution using the same reference strain, but each institutional database generates different values for SNP addresses dependent on their unique content, making data comparisons between institutions more complex. A shared database holding SNP information for sequenced human, animal, food, and environmental isolates would enhance joint outbreak investigations by shortening the time it currently takes to share the data. Collaboration between laboratories should be a future priority, to agree on a method that can be used on a large scale, and is internationally recognised in the same way as sero- and phage typing, as WGS becomes a more routine part of surveillance and epidemiological investigation of livestock disease outbreaks.
Supplementary material
The supplementary material for this article can be found at http://doi.org/10.1017/S0950268823001723.
Data availability statement
The authors have provided anonymised data within the article and in the supplementary materials. Some of the isolates were published in two previous papers, as detailed in the manuscript. However, due to the sensitive nature of the outbreak, the authors are currently unable to publish the full list of isolates. Data can be provided on request to APHA.
Acknowledgements
The authors thank Margarida Carvalho Abecasis for preliminary scoping work on the project and Lesley Larkin for her insightful comments on the manuscript.
Author contribution
Conceptualization: R.P.S.; Funding acquisition: R.P.S., L.P.; Methodology: R.P.S., J.L., L.S.; Supervision: R.P.S., J.L., L.P.; Writing – review & editing: R.P.S., J.L., L.P., Y.T., L.S., J.M.B.; Data curation: L.P., Y.T.; Writing – original draft: L.P., L.S., J.M.B.; Formal analysis: L.S., J.M.B.
Financial support
Funding was received from the European Union’s Horizon 2020 research and innovation programme, as part of the COMPARE project, under grant agreement no. 643676. J.B. is supported by Research England’s ‘Expanding Excellence in England (E3) Fund’. The generation of WGS data for all isolates in this study was supported by Defra RDOZO347, with APHA SE0355 and CR2000F R&D funding to LP.
Competing interest
The authors declare none.


 Open access