


Social media summary: A skeletal structure can have many functions, giving flexibility but complicating functional interpretations from bone.
1. Central theme: integrating variability into the interpretation of functional morphology
The appearance of specialised bipedal morphology in the fossil record is one of the earliest indicators of the hominin divergence from the lineage leading to modern apes (Zollikofer et al., Reference Zollikofer, Ponce De León, Lieberman, Guy, Pilbeam, Likius and Brunet2005). Understanding how and when human-like bipedal kinematics evolved is crucial to thinking about why hominin bipedalism evolved, and why only in hominins (Raichlen & Pontzer, Reference Raichlen and Pontzer2021). To get at these fundamental questions in biological anthropology, we rely heavily on the characteristics of preserved skeletal elements to infer function and behaviour in life. This form–function conceptual framework, in which strong correlation between the structure of a particular trait and its function is assumed, is long-standing (Blits, Reference Blits1999) and seminal not just in biological anthropology but in many scientific disciplines interested in anatomy and morphology. The form–function interpretive framework is the lens through which many important questions and hypotheses have been tackled in biological anthropology, ranging from why humans face such a tight fit during childbirth (Washburn, Reference Washburn1960) to the importance of endurance running in hominin evolution (Bramble & Lieberman, Reference Bramble and Lieberman2004). The form–function theoretical paradigm continues to be a crucial framework for understanding the origins of bipedalism, the selective factors shaping morphological variation and the impact of that variation on kinematics, energetics and locomotor performance. However, it has become increasingly evident that the morphologies of fossil hominins, apes and humans can confer considerable locomotor diversity and flexibility, and can do so with a range of kinematics depending on soft tissue deformation, plasticity and environmental and cultural factors. The nine papers in this Special Collection all highlight a range of innovative efforts to better consider this variability in the interpretation of functional morphology in the context of evolutionary biomechanics and human movement.
2. Mosaic morphology and the form–function paradigm
Typically, key skeletal differences between humans and other extant primates in areas like the pelvis, spine and foot (Williams & Russo, Reference Williams and Russo2015; Holowka & Lieberman, Reference Holowka and Lieberman2018) have been interpreted as derived adaptations that increase efficiency in either terrestrial bipedalism or arboreal locomotion. However, increasing numbers of fossil hominins spanning millions of years of evolution and a wide geographic range all show evidence of mosaic morphology. Various combinations of arboreal and bipedal traits have been documented among the earliest hominins, like Ardipithecus ramidus (Lovejoy, Suwa, et al., Reference Lovejoy, Suwa, Spurlock, Asfaw and White2009; Lovejoy, Latimer, et al., Reference Lovejoy, Latimer, Suwa, Asfaw and White2009), numerous australopithecine species (Stern & Susman, Reference Stern and Susman1983; Williams et al., Reference Williams, Prang, Meyer, Nalley, Van Der Merwe, Yelverton and Berger2021; Dunmore et al., Reference Dunmore, Skinner, Bardo, Berger, Hublin, Pahr and Kivell2020; Georgiou et al., Reference Georgiou, Dunmore, Bardo, Buck, Hublin, Pahr and Skinner2020; Meyer et al., Reference Meyer, Williams, Schmid, Churchill and Berger2017) and several members of the genus Homo (Pontzer et al., Reference Pontzer, Rolian, Rightmire, Jashashvili, Ponce de Léon, Lordkipanidze and Zollikofer2010; Brown et al., Reference Brown, Sutikna, Morwood, Soejono, Jatmiko, Saptomo and Due2004; Détroit et al., Reference Détroit, Mijares, Corny, Daver, Zanolli, Dizon and Piper2019; Johanson et al., Reference Johanson, Masao, Eck, White, Walter, Kimbel and Suwa1987; Lordkipanidze et al., Reference Lordkipanidze, Jashashvili, Vekua, de León, Zollikofer, Rightmire and Rook2007; Kivell et al., Reference Kivell, Deane, Tocheri, Orr, Schmid, Hawks and Churchill2015). The widespread presence of mosaic morphology in the hominin fossil record suggests the presence of perhaps more than one strategy for meeting the biomechanical challenges of bipedal walking without sacrificing functional abilities in other locomotor modes as well.
Extant species help demonstrate this point with respect to variability in relationships between structure and functional parameters. Contemporary humans employ their bipedal walking anatomy in diverse ways, including running and vertical climbing, and to varying degrees depending on cultural variation, soft tissue plasticity, social learning and practice (Venkataraman, Kraft, Desilva, & Dominy, Reference Venkataraman, Kraft, Desilva and Dominy2013; Venkataraman, Kraft, & Dominy, Reference Venkataraman, Kraft, Desilva and Dominy2013; Wallace et al., Reference Wallace, Kraft, Venkataraman, Davis, Holowka, Harris and Gurven2022). For example, despite being well adapted for bipedal locomotion, the human ankle and foot can produce almost complete overlap with wild chimpanzees in range of motion during vertical tree-climbing (Venkataraman et al., Reference Venkataraman, Kraft, Desilva and Dominy2013). Soft tissue plasticity developed over a lifetime of practice enables extreme ankle flexion well beyond what would cause injury or muscle tearing among non-climbing human populations (Venkataraman et al., Reference Venkataraman, Kraft, Desilva and Dominy2013). Not only can humans be surprisingly good climbers, but all extant apes can and do occasionally move bipedally on the ground (Rosen, Jones, & DeSilva, Reference Rosen, Jones and DeSilva2022); facultative bipedalism is one of a range of locomotor modes used by apes, including suspensory locomotion, arboreal bipedalism and quadrupedalism, brachiation and knuckle-walking (Napier & Napier, Reference Napier and Napier1967). All primates walking bipedally need to maintain balance and stability while on one leg in the stance phase, propel that leg forward during the swing phase and deal with impact forces when the foot strikes the ground again, all as efficiently and ‘cheaply’ as possible. However, their distinct anatomies pose different problems in doing so, requiring different solutions.
Much focus has been paid to key differences in the human pelvis relative to that of extant apes, for example our shorter and more laterally oriented iliac blades and shorter ischium (Marchal, Reference Marchal2000). These pelvic traits enable humans to prevent hip adduction during the single-leg stance phase of bipedal locomotion, and to maximise hip hyperextension before toe-off and leg swing (O'Neill et al., Reference O'Neill, Demes, Thompson, Larson, Stern and Umberger2022). Based on the assumption that similar problems and solutions would have existed for hominins, shorter laterally oriented iliac blades and a shorter ischium are considered key derived adaptations indicative of habitual bipedalism in fossils (Stern & Susman, Reference Stern and Susman1983; Lovejoy, Suwa, et al. Reference Lovejoy, Suwa, Spurlock, Asfaw and White2009). However, fossil hominins exhibit a range of variation in ischial length, relative pelvic breadth and iliac blade orientation, amongst others (Kozma et al., Reference Kozma, Webb, Harcourt-Smith, Raichlen, D'Août, Brown and Pontzer2018; Lovejoy, Suwa, et al., Reference Lovejoy, Suwa, Spurlock, Asfaw and White2009), as well as mosaic sets of traits in key areas like the spine, lower limb and foot (Lovejoy, Latimer, et al., Reference Lovejoy, Latimer, Suwa, Asfaw and White2009; McNutt, Zipfel, & DeSilva Reference McNutt, Zipfel and DeSilva2018; Zipfel et al., Reference Zipfel, DeSilva, Kidd, Carlson, Churchill and Berger2011; Williams et al., Reference Williams, Prang, Meyer, Nalley, Van Der Merwe, Yelverton and Berger2021; Meyer et al. Reference Meyer, Williams, Schmid, Churchill and Berger2017). All of these skeletal structures are embedded in an intricate complex of soft tissues (muscle, tendon, ligament, fascia, aponeuroses, etc.), each with its own mechanical properties, contributions to overall function and associated costs. Variation in soft tissue can thus shape the function possible from a given skeletal structure and the overall cost of locomotion, yet this influence is not necessarily detectable from skeletal structure alone (e.g. Venkataraman, Kraft, and Dominy, Reference Venkataraman, Kraft and Dominy2013).
The deformation of soft tissues contributes a substantial amount of the work done during bipedal locomotion (Zelik & Kuo, Reference Zelik and Kuo2010), passive work that then does not need to be actively performed by the muscles, saving energy. Dissipating energy at heel-strike, and powering toe-off, are two challenges that any species walking bipedally faces: among humans, meeting these challenges through soft tissue deformation seems to be the solution converged upon during our evolutionary history. Deformation of soft tissue structures like muscle fibers and tendons, ligaments of the ankle and foot, heel fat pad and plantar fascia probably perform most of the negative work done when the foot collides with the ground, reducing the extent to which the muscles must actively contribute (Zelik & Kuo, Reference Zelik and Kuo2010). When stretched sufficiently, the elastic recoil of soft tissue structures can also contribute much of the positive work needed at toe-off in humans (Hof, Geelen, & Van den Berg, Reference Hof, Geelen and Van den Berg1983; O'Neill et al., Reference O'Neill, Demes, Thompson, Larson, Stern and Umberger2022; Sawicki, Lewis, & Ferris, Reference Sawicki, Lewis and Ferris2009; Zelik, Huang, Adamczyk, & Kuo, Reference Zelik, Huang, Adamczyk and Kuo2014; Zelik & Kuo, Reference Zelik and Kuo2010). The contribution of soft tissue deformation to the work of running is even greater than in walking: for the body as a whole, soft tissue deformation accounts for more than 25% of all negative work during the stance phase, and provides ~17% of the positive work for rebound when running (Riddick & Kuo, Reference Riddick and Kuo2016). Maximising soft tissue deformation may thus have been an important part of the selective environment acting on key locomotor regions of the hominin skeleton. There is some suggestion that the shorter ischium of humans relative to chimpanzees (Aiello & Dean, Reference Aiello and Dean1990) enables greater energy storage in the anterior hip soft tissue, the release of which may contribute up to 35% of the work required at toe-off and leg swing in humans (O'Neill et al., Reference O'Neill, Demes, Thompson, Larson, Stern and Umberger2022). These soft tissues do not preserve, and their contribution to locomotion among fossil hominins is difficult to estimate.
Another challenge of bipedal locomotion that any species must face is keeping the pelvis stable during the single-support phase. This must be achieved regardless of variation in pelvic traits like overall breadth, iliac blade size and the orientation of the ilia and ischia, variation resulting from the particular set of obstetric, locomotor and thermoregulatory challenges in a given species living in a given environment (Gruss & Schmitt, Reference Gruss and Schmitt2015). Differences in pelvic anatomy and musculature between humans and chimpanzees pose different problems and involve different solutions when it comes to the shared problem of maintaining pelvic stability on one leg. As such, they exhibit two distinct mechanical environments about the hip during the single-support phase of bipedal walking: chimpanzees utilise a mechanism involving large internal rotation and adduction moments at the hip to keep the pelvis level, whereas humans employ a strong hip abduction moment (O'Neill et al., Reference O'Neill, Demes, Thompson, Larson, Stern and Umberger2022). Human-like walking mechanics thus cannot be applied to a chimpanzee, and we cannot necessarily assume that they are applicable to fossil bipeds either, given the wide range of variation in their pelvic traits (Lovejoy, Suwa, et al., Reference Lovejoy, Suwa, Spurlock, Asfaw and White2009; Lovejoy, Heiple, & Burstein, Reference Lovejoy, Heiple and Burstein1973; Stern & Susman, Reference Stern and Susman1983; Lovejoy, Reference Lovejoy2005; Berger et al., Reference Berger, Hawks, de Ruiter, Churchill, Schmid, Delezene and Zipfel2015; Jungers et al., Reference Jungers, Larson, Harcourt-Smith, Morwood, Sutikna, Due Awe and Djubiantono2009; Berge & Goularas, Reference Berge and Goularas2010; Berge, Reference Berge1984). This variation not only spans the range of variation seen in extant species, but it occasionally represents unique combinations of features as well (e.g. Berger et al., Reference Berger, Hawks, de Ruiter, Churchill, Schmid, Delezene and Zipfel2015).
A huge challenge with interpreting skeletal variation in the past using the form–function paradigm becomes evident when considering this mosaic morphology and hominin variability: a given function might be possible with a range of structurally different bones, and structurally similar bones could function differently depending on the overlying soft tissue. In their contribution to this Special Collection, Juliet McClymont et al. (Reference McClymont, Davids and Crompton2022) argue that a shift is needed in bioarchaeology and paleoanthropology, from a paradigm based on form–function to one based instead on degeneracy. Degeneracy is a mechanism of adaptation within a system whereby structurally different bones can function in a similar way, while simultaneously each having a range of independent functions (McClymont, Davids, & Crompton, Reference McClymont, Davids and Crompton2022). Viewed through the lens of degeneracy, mosaic morphology becomes less of a confusing contradiction: for example, the mosaic nature of early hominin foot morphology can be viewed as a flexible and highly degenerate system well suited for both arboreality and terrestrial bipedalism. The structurally different bones between species need not be viewed so much as specialised for dichotomous functions, but more so as part of a flexible system used to produce a shared function – bipedal walking – as well as other independent functions, like grasping or climbing. Importantly, this complexity in the relationship between structure and function is not necessarily discernible from skeletal remains alone.
2.1. Comparative behavioural approaches to thinking about the origins of bipedalism
The closest possible correlate of potential locomotor modes in the past is locomotion among extant species of apes and humans. As such, models of how and when hominin bipedalism emerged are frequently based on consideration of the characteristics and locomotor modes of extant apes. A long-standing and influential model sees the last common ancestor (LCA) of hominins and great apes as similar to an African ape, with a significant terrestrial knuckle-walking component to its locomotion (Richmond, Begun, & Strait, Reference Richmond, Begun and Strait2001; Washburn, Reference Washburn1967). When African apes move bipedally, they do so with a bent-hip–bent-knee posture that generates substantial torque about the flexed hip and knee that must be counteracted by sufficient muscle force to prevent the leg collapsing (Sockol, Raichlen, & Pontzer, Reference Sockol, Raichlen and Pontzer2007). Humans walk bipedally with an extended leg posture, reducing the muscle forces required and thus the associated energetic costs (Pontzer, Raichlen, & Sockol, Reference Pontzer, Raichlen and Sockol2009), providing a selection pressure that could theoretically drive the evolution of human-like bipedal walking from a knuckle-walking African-ape-like ancestor. The locomotion of Asian apes like hylobatids (gibbons and siamangs) and orangutans often involves arboreal bipedalism, or walking upright along the top of branches with an orthograde posture and an extended lower limb (Thorpe, Holder, & Crompton, Reference Thorpe, Holder and Crompton2007). Alternative models of the LCA that emphasise arboreal bipedalism, like those based on a hylobatian LCA (Tuttle, Reference Tuttle1974), see an easier transition to hominin bipedality if the LCA is already frequently using a bipedal posture and extended leg in the trees. The kinematics and locomotion of the LCA is thus a matter of keen debate: was it predominantly terrestrial or arboreal? When it stood upright, did it adopt the flexed with a bent-hip–bent-knee posture of an ape, or the more extended limb posture of a human?
Seeking answers to these questions from skeletal remains alone is not straightforward; as mentioned above, structures specialised for a variety of locomotor modes can function in multiple and overlapping ways that are not necessarily reflected in bone structure alone. In this Special Collection, Rosen and colleagues (2022) approach the question of the LCA's locomotor mode through the examination of bipedal frequency in extant zoo-housed primate taxa. The most arboreal among extant primates, hylobatids and orangutans, both utilise an orthograde posture and frequent arboreal bipedalism involving an extended leg posture. However, hylobatids have an additional trait key to human bipedalism: a long and flexible lumbar spine. It has previously been argued that these traits, shared by two taxa who now have distinct primary locomotor modes (bipedalism and brachiation), reflect the ancestral condition (e.g. hylobatian model; Tuttle, Reference Tuttle1974), but Rosen and colleagues explore whether or not it is arboreal individuals with these traits already who are most likely to move bipedally when on the ground. Among extant apes housed in zoos, they observed bipedal behaviour on the ground more often, and for longer per bout, among hylobatids than bonobos, chimpanzees, gorillas, orangutans or cercopithecines (Rosen et al., Reference Rosen, Jones and DeSilva2022). Of the 93 hylobatid individuals observed, bipedal bouts were documented among 83% of them, on average almost twice a day, and more than 35% of these bouts involved eight or more bipedal strides. Although strong selection could feasibly favour the evolution of obligate bipedalism from any of the observed taxa, as they all exhibited some bipedal behaviour, only the hylobatids already exhibited both an orthograde posture and a long and flexible lower back. An LCA with these traits as well may have been similarly predisposed to bipedal behaviour, in which case the orthograde posture and long lumbar spine of humans and hylobatids would be ancestral, and the short stiff lumbar spine and more pronograde posture of knuckle-walking apes would be the derived condition.
This behavioural work stimulates many interesting questions about the nature of the body form from which habitual bipedalism emerged, but also again highlights one of the main issues with the form–function paradigm that forms the central theme of this Special Collection: different skeletal structures can perform a given function reasonably well and can also simultaneously be used for a set of other independent functions. Even if a perfectly preserved fossil ape from exactly the right time was discovered, immediately before the divergence between hominin and great ape branches, and it had a long, flexible lumbar spine and seemingly an orthograde posture, this morphology can clearly be used in locomotor modes as diverse as habitual bipedalism and brachiation. The presence of one trait alone is not enough; approaches are necessary that can consider complexes of traits working together in flexible ways, as well as reconstruct soft tissue's role in both enabling functional diversity and generating structural variation in bone.
3. Bringing flesh upon you: reconstructing muscle's influence on bone structure and function
In bioarchaeology, inter- and intra-population variation in limb bone structural properties is often the starting point for informing inferences about mechanical loading, and thus activity, in the past (Ruff & Hayes, Reference Ruff and Hayes1983; Ruff et al., Reference Ruff, Holt, Niskanen, Sladek, Berner, Garofalo and Whittey2015; Macintosh, Pinhasi, & Stock, Reference Macintosh, Pinhasi and Stock2014; Bridges, Blitz, & Solano, Reference Bridges, Blitz and Solano2000; Sládek, Berner, Sosna, & Sailer, Reference Sládek, Berner, Sosna and Sailer2007; Stock & Pfeiffer, Reference Stock and Pfeiffer2001). A significant amount of the internal force to which limb bones are subject comes from the contraction of skeletal muscles (Burr, Reference Burr1997; Robling, Reference Robling2009), forces that can rotate joints about an axis or centroid, thus creating moments (torques) (Stewart & Hall, Reference Stewart and Hall2006) that lever the bones of the skeleton around to both generate desired movement and prevent it when undesired. These muscle-related moments have been associated with patterns of bone functional adaptation in athletes relative to non-athletes (Nikander, Sievänen, Uusi-Rasi, Heinonen, & Kannus, Reference Nikander, Sievänen, Uusi-Rasi, Heinonen and Kannus2006; Schipilow, Macdonald, Liphardt, Kan, & Boyd, Reference Schipilow, Macdonald, Liphardt, Kan and Boyd2013), explaining large proportions of variance in bone structural characteristics. For example, a proxy for muscle moment explained almost 50% of the variance in proximal tibial bending/torsional rigidity among a group of young adult female runners and soccer players, and over 80% of the variance in midshaft femoral bending/torsional rigidity in a group of young adult female control subjects (Murray & Stock, Reference Murray and Stock2020). The 30% difference in the explanatory power of muscle moments for bone strength among athletes relative to non-athletes highlights the importance of external forces, in addition to internal ones, in contributing to moments about a joint. One such external force is the ground reaction force (GRF) exerted on the limb when the foot hits the ground during locomotion (Stewart & Hall, Reference Stewart and Hall2006). Athletes experience more and larger external moments than do non-athletes, and thus external moments probably explain more substantial proportions of variance in their bone strength indices. This is particularly true among athletes in sports where GRFs would be especially large or multi-directional, like soccer, triple jump and racquet sports. These athletes exhibit much greater enhancement of bone strength indices relative to controls than do athletes in sports involving high muscle magnitudes (internal forces) but negligible ground impact and GRFs (external forces; e.g. powerlifting, rowing, swimming, cycling; Macintosh & Stock, Reference Macintosh and Stock2019; Niinimäki et al., Reference Niinimäki, Narra, Härkönen, Abe, Nikander, Hyttinen and Sievänen2017, Reference Niinimäki, Narra, Härkönen, Abe, Nikander, Hyttinen and Sievänen2019; Nikander et al., Reference Nikander, Sievänen, Uusi-Rasi, Heinonen and Kannus2006).
When making behavioural inferences from bone structure in the past, we do not necessarily know the moments required to move a particular joint during various activities practised, and we do not know the relative contribution of external and internal forces in generating these moments. Further, bone structure reflects adaptation to the external and internal forces it experiences, regardless of whether those come from physical activity or not (for example, body mass loads weight-bearing bones). Population-specific equations have been developed to estimate body mass from skeletal remains (Ruff, Reference Ruff2000; Squyres & Ruff, Reference Squyres and Ruff2015; Chevalier et al., Reference Chevalier, Clarys, Lefèvre, Beauthier, Louryan and Cattrysse2018; Ruff et al., Reference Ruff, Holt, Niskanen, Sladék, Berner, Garofalo and Tompkins2012; Ruff, Trinkaus, & Holliday, Reference Ruff, Trinkaus and Holliday1997) in order to remove its effect when interpreting activity from bone structure. However, the remaining functional signal in bone still reflects a range of external and internal forces, both of which can explain large portions of the variance in bone structure among humans, and neither of which are directly known in the past. As such, behavioural inferences are typically broad (more vs. less mobility, more vs. less asymmetrical etc.) and linked to archaeological or historical evidence of more specific activities when possible. Reconstructions and interpretations of the anatomy and behaviour of past hominins and humans would greatly benefit from an improved ability to estimate the external and internal forces, and the coordinated patterns of muscle activity, which may have been associated with particular activities in the past.
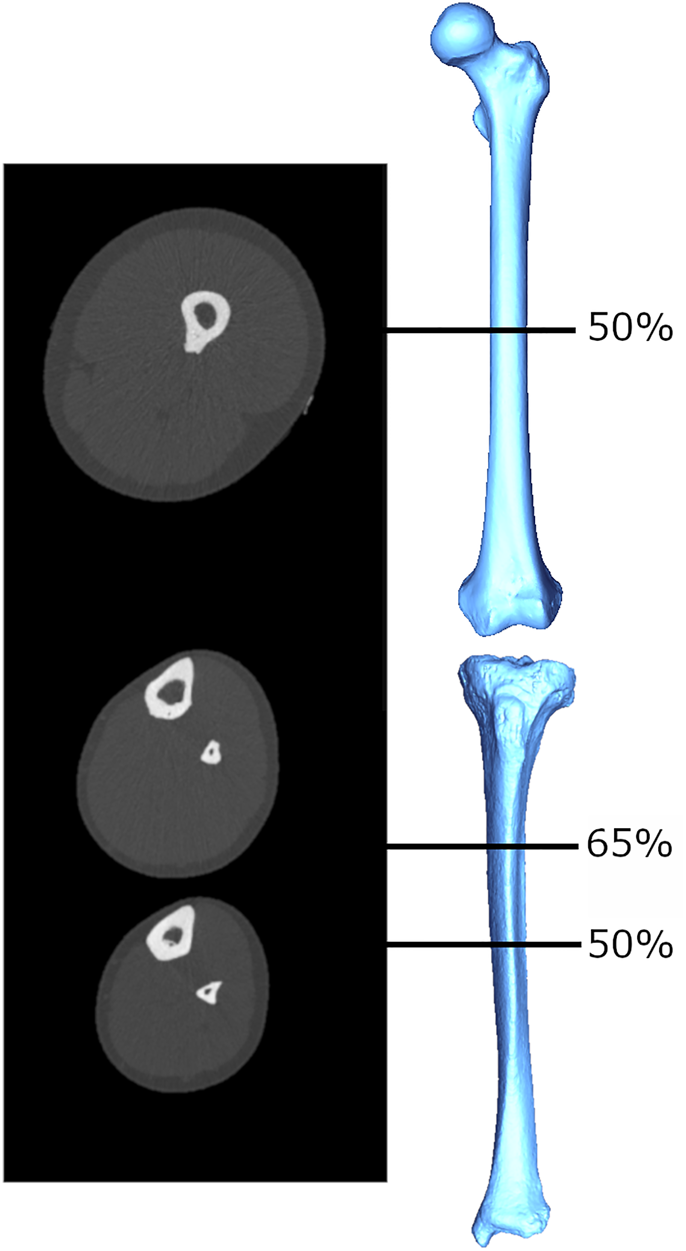
There have been several attempts in biological anthropology to estimate muscle size from bone structural properties. These attempts have their basis in the roughly proportional relationship between a muscle's cross-sectional area (MCSA) and its force production that has been documented among living humans (Maughan, Watson, & Weir, Reference Maughan, Watson and Weir1983). The MCSA exhibits strong correlations with measures like grip strength (Frank, Lorbergs, Chilibeck, Farthing, & Kontulainen, Reference Frank, Lorbergs, Chilibeck, Farthing and Kontulainen2010) and explains significant amounts of variance in limb bone cross-sectional bone areas and indices of bone strength (Frank et al., Reference Frank, Lorbergs, Chilibeck, Farthing and Kontulainen2010; Heinonen, Mckay, Whittall, Forster, & Khan, Reference Heinonen, Mckay, Whittall, Forster and Khan2001; Lorbergs, Farthing, Baxter-Jones, & Kontulainen, Reference Lorbergs, Farthing, Baxter-Jones and Kontulainen2011; Macdonald, Kontulainen, Petit, Janssen, & McKay, Reference Macdonald, Kontulainen, Petit, Janssen and McKay2006; Rantalainen, Nikander, Kukuljan, & Daly, Reference Rantalainen, Nikander, Kukuljan and Daly2013). Relationships between MCSA and commonly used cross-sectional geometric (CSG) properties in the upper limb bones (Shaw Reference Shaw2010; Slizewski, Onau, Shaw, & Harvati, Reference Slizewski, Onau, Shaw and Harvati2013) have been explored and used to estimate forearm MCSAs for a sample of Neolithic humans (Slizewski, Burger-Heinrich, Francken, Wahl, & Harvati, Reference Slizewski, Burger-Heinrich, Francken, Wahl and Harvati2014). However, the accuracy with which MCSAs predicted CSG properties were highly variable: percentage prediction errors ranged from 54% to as high as 85%, and percentage standard errors from ~8 to 19%, depending on sport, age, sex and slice location. This is potentially reflecting, at least in part, the need for an approach that considers functional relationships between bone and muscle complexes active during particular movements. The estimation of MCSA from CSG properties in the studies above was attempted within a given computed tomography (CT) slice location, either at the midshaft (Shaw, Reference Shaw2010; Slizewski et al., Reference Slizewski, Onau, Shaw and Harvati2013) or 65% of the bone length (Slizewski et al., Reference Slizewski, Onau, Shaw and Harvati2013). However, the musculature immediately adjacent to the bone at these locations is not necessarily all of, or even the main, musculature that is generating moments and load on the bone at that slice location. For example, the slice taken at 65% of the forearm length does not capture the muscle bellies of the major elbow flexors and extensors (triceps brachii, biceps brachii, and brachialis; An, Hui, Morrey, Linscheid, & Chao, Reference An, Hui, Morrey, Linscheid and Chao1981). Examples of CT slice images for the lower limb are provided in Figure 1; muscle area at a given slice location is computed as the area of the light grey (muscle) tissue in cross-section, and individual muscles are not differentiated. Mid-lower leg CSG properties did not exhibit any significant relationship with MCSA from the same section location (Shaw, Reference Shaw2010), but alternatively have exhibited significant relationships with MCSA more proximally in the limb, particularly at the mid-thigh (Rantalainen et al., Reference Rantalainen, Nikander, Kukuljan and Daly2013; Murray & Stock, Reference Murray and Stock2020). This is probably because many large muscles of the thigh insert on the lower leg bones, generating large bending moments about the knee joint that may result in tibial and/or fibular bone functional adaptation not explained well by calf muscle areas. In order to use limb bone structural geometry to predict or infer muscle size in the past and, following from that, force production, a functional approach is clearly necessary.
Example cross-sectional images obtained using peripheral quantitative computed tomography (pQCT), from which limb bone CSG properties and MCSAs are quantified. The mid-thigh image is taken at 50% of femoral length, and the lower leg images are taken at 65% and 50% of tibial length. Greyscale coloration represents tissue density: white (most dense) = bone, light grey = lean mass, dark grey (least dense) = fat mass.
3.1. Mapping functional patterns of muscle activity
The strains experienced by a bone in the performance of a given behaviour are generated by a complex pattern of coordinated muscle activity within limbs and across joints. However, the direct in vivo measurement of bone strain produced during the performance of a particular task in humans is understandably uncommon (see review in Al Nazer, Lanovaz, Kawalilak, Johnston, & Kontulainen, Reference Al Nazer, Lanovaz, Kawalilak, Johnston and Kontulainen2012). Electromyography (EMG) has proven useful over the past decade in biological anthropology in assessing experimentally measured patterns of muscle activity during the performance of tasks important among past populations, to which patterns of bone functional adaptation thought to be generated by that task can be compared. Most work to this end thus far has focused on inferred skeletal signatures of key hunting and food-processing technologies, like querns, spears and projectile weaponry. Such research has provided support for behavioural interpretations linking changes in humeral asymmetry among European agricultural women to technological shifts in grain-grinding technology (Sládek, Hora, Farkasová, & Rocek, Reference Sládek, Hora, Farkasová and Rocek2016), but it has also challenged influential and longstanding hypotheses about the role of underhanded spear thrusting (Churchill et al., Reference Churchill, Weaver and Niewohner1996) in the pronounced humeral asymmetry among Neanderthals (Shaw, Hofmann, Petraglia, Stock, & Gottschall, Reference Shaw, Hofmann, Petraglia, Stock and Gottschall2012).
The development of projectile weaponry like the bow and arrow represented both a shift in cognitive complexity, being made and used only by Homo sapiens, and a key piece of the toolkit enabling human dispersal and adaptive success (Williams, Burke, & Lombard Reference Williams, Burke and Lombard2014; Shea, Reference Shea2006). Being predominantly made from organic materials, archaeological evidence of archery usually relies on finding stone, bone or metal arrowheads. However, the use of the bow and arrow requires substantial muscle force production at the elbow and shoulder in the draw (dominant) arm, force known as the draw weight that, for composite and longbows in the past, is in the range 90–130 lb or 40–60 kg (Hardy, Reference Hardy1992; Karpowicz, Reference Karpowicz2007; Soar, Reference Soar2006). The bow (non-dominant) arm must brace against these large forces to keep the arm straight, so archery may be detectable in asymmetrical humeral functional adaptation. Among the humeri of males thought to have performed archery, a pattern of relatively symmetrical responses to loading intensity (limb bone bending strength, external dimensions, total areas etc.) but asymmetrical responses to loading directionality (limb bone shape ratio) has been documented (Rhodes & Knüsel, Reference Rhodes and Knüsel2005; Stirland, Reference Stirland1993). Whether or not the performance of archery actually does involve symmetrical upper limb load intensity but asymmetrical load directionality is unclear, however. In this Special Collection, Tabitha Dorshorst and colleagues (2022) utilised EMG analysis to investigate the patterns of muscle activity at the shoulder and elbow in both upper limbs of participants throughout the drawing of a bow. Peak percentages of maximum voluntary contraction in the muscles of the bow and draw arms were similar, but were generated by the joint agonist in one arm and its antagonist in the other arm (Dorshorst, Weir, Hamill, & Holt, Reference Dorshorst, Weir, Hamill and Holt2022). This pattern of muscle activity about the shoulder and elbow during archery is consistent with signatures of symmetrical loading intensity overall but asymmetrical directionality inferred from skeletal remains.
3.2. Modelling activity-related external and internal forces
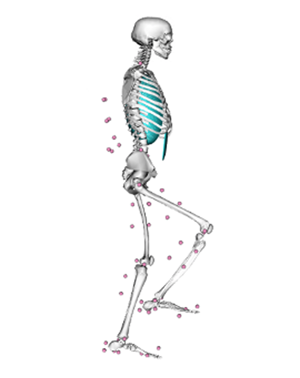
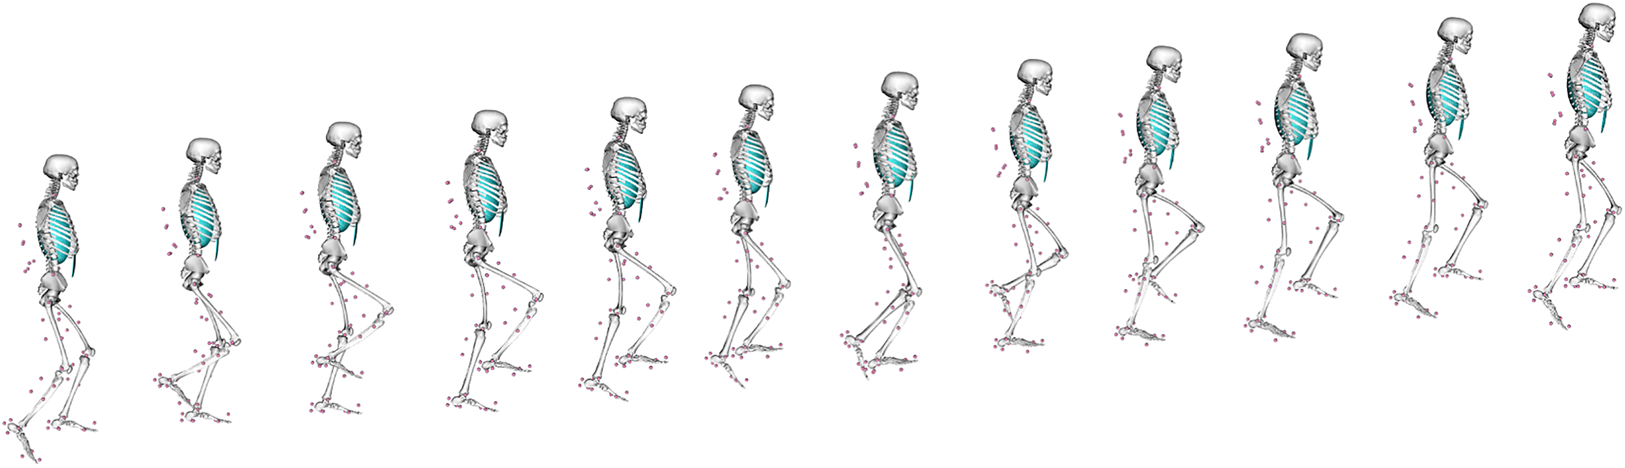
Although useful, EMG does not directly measure internal bone loading, as this is very difficult to measure in vivo. A variety of other parameters are also difficult to measure in vivo, like muscle–tendon lengths, moment arms and soft tissue deformation, all of which affect forces, kinematics and costs during locomotion. Musculoskeletal (MSk) modelling provides a computational means of estimating such parameters during the performance of a given movement (Arnold et al., Reference Arnold, Salinas, Hakawa and Delp2000; Wehner, Claes, & Simon, Reference Wehner, Claes and Simon2009; Baggaley et al., Reference Baggaley, Derrick, Vernillo, Millet and Edwards2022), so is a powerful tool in trying to better understand locomotor kinematics in the past. Using a combination of motion equations and muscle force prediction equations, MSk techniques can determine a range of kinematic and soft tissue parameters that would exist within a subject when conducting any specific activity that can be virtually defined or measured experimentally (e.g. walking). To do so, an MSk model typically requires detailed information on a subject's musculoskeletal anatomy, from cadaveric dissection, CT imaging, or magnetic resonance imaging. These anatomical data are then paired with experimental data on gait and muscle parameters to create a representative model of a subject moving; an MSk model climbing stairs is presented in Figure 2. The greatest accuracy is achieved by collecting all input data from the same individual (Charles, Grant, D'Août, & Bates, Reference Charles, Grant, D'Août and Bates2020), although this is not always possible. Even with a full subject-specific dataset, MSk models are sensitive to error in bony landmark identification, muscle tension and muscle geometries, all of which affect the calculated muscle and joint moments and forces (Broyde et al., Reference Broyde, Dempsey, Wang, Cox, Fagan and Bates2021; Martelli, Valente, Viceconti, & Taddei, Reference Martelli, Valente, Viceconti and Taddei2015; Valente et al., Reference Valente, Pitto, Testi, Seth, Delp, Stagni and Taddei2014). Even just the removal of soft tissue during dissection can change muscle/tendon paths enough to introduce large errors in muscle via points in an MSk model (Synek et al., Reference Synek, Lu, Vereecke, Nauwelaerts, Kivell and Pahr2019).
An example of a musculoskeletal model at different points in a stair-climbing simulation. Pink circles indicate the position of reflective motion capture markers placed at anatomical landmarks on the subject in life as they performed the movement.
Obviously, the sensitivity of even subject-specific models to estimation errors is a major challenge facing the effective use of MSk modelling among extinct fossil species, in whom bony preservation may be poor and muscle and gait variables are simply unknown. Existing efforts to simulate locomotor biomechanics in fossil hominins have faced difficulties in determining segment lengths, relative body segment inertial parameters, passive joint properties, muscle characteristics, muscle attachment locations and even the anatomy of entire limb segments that were missing (Nagano, Umberger, Marzke, & Gerritsen, Reference Nagano, Umberger, Marzke and Gerritsen2005; Wang et al., Reference Wang, Crompton, Carey, Günther, Li, Savage and Sellers2004). In order to overcome these issues, assumptions must be made that extant human or non-human primate data would have been similar enough to act as an appropriate substitute. Human or ape muscle, joint and relative body segment parameters can then be scaled to a given fossil's dimensions, and their experimentally collected gait data used to simulate a fossil walking (Nagano et al., Reference Nagano, Umberger, Marzke and Gerritsen2005; Wang et al., Reference Wang, Crompton, Carey, Günther, Li, Savage and Sellers2004). This practice can contribute to the already considerable disagreement that exists about hominin locomotion; for example, that australopithecines walked both with a flexed, bent-hip–bent-knee bipedal gait (Stern, Reference Stern2000; Stern & Susman, Reference Stern and Susman1983) and with an extended gait (Crompton, Yu, Weijie, Günther, & Savage, Reference Crompton, Yu, Weijie, Günther and Savage1998; DeSilva et al., Reference DeSilva, Holt, Churchill, Carlson, Walker, Zipfel and Berger2013; Raichlen, Gordon, Harcourt-Smith, Foster, & Haas, Reference Raichlen, Gordon, Harcourt-Smith, Foster and Haas2010), and that they walked bipedally both less efficiently than a human (Nagano et al., Reference Nagano, Umberger, Marzke and Gerritsen2005; Pontzer et al., Reference Pontzer, Raichlen and Sockol2009; Wang et al., Reference Wang, Crompton, Carey, Günther, Li, Savage and Sellers2004) and similarly or even more efficiently (Sellers, Cain, Wang, & Crompton, Reference Sellers, Cain, Wang and Crompton2005; Kramer, Reference Kramer1999; Kramer & Eck, Reference Kramer and Eck2000).
Considering reference data for something like muscle architecture from one species as representative of that of another is obviously not ideal, but is currently the only option available to us when considering extinct species. However, this is a problem even when modelling extant human kinematics: when collecting subject-specific datasets is not possible, most of the reference data for ‘generic’ human muscle parameters come from cadaveric dissections of elderly individuals (Klein Horsman, Koopman, van der Helm, Prosé, & Veeger Reference Klein Horsman, Koopman, van der Helm, Prosé and Veeger2007; Arnold, Ward, Lieber, & Delp, Reference Arnold, Ward, Lieber and Delp2010; Rajagopal et al., Reference Rajagopal, Dembia, DeMers, Delp, Hicks and Delp2016). These muscle parameters are probably not representative of most humans, as not only does muscle architecture (volume, length, cross-sectional area, fiber length, pennation angle, etc.) vary substantially, even among individual humans (Charles, Suntaxi, & Anderst, Reference Charles, Suntaxi and Anderst2019), it changes with age (Moore et al., Reference Moore, Caturegli, Metter, Makrogiannis, Resnick, Harris and Ferrucci2014; Narici, Maffulli, & Maganaris, Reference Narici, Maffulli and Maganaris2008). Compared with using elderly generic muscle architecture data, averaged data collected from young, healthy individuals (Charles et al., Reference Charles, Suntaxi and Anderst2019) does predict experimentally measured subject-specific isokinetic muscle torques to a higher degree of accuracy (Charles et al., Reference Charles, Grant, D'Août and Bates2020). However, even generic data from young adults still introduced error relative to subject-specific muscle data for some movements at the ankle, knee and hip. In this Special Collection, Patricia Kramer, Feuerriegel, Lautzenheiser, and Sylvester (2022) test the extent to which variation in the muscle architecture parameters of functional groupings of lower limb muscles influenced joint reaction force and muscle force estimates in complex movements. Kramer and colleagues modified a previously existing baseline MSk model to the size and proportions of 10 healthy volunteers, to which subject-specific motion and force data, and cadaveric muscle architecture parameters, were applied. The resulting joint and muscle forces of these models were compared with the same models but with generic young adult muscle architecture parameters applied instead (Charles et al. Reference Charles, Suntaxi and Anderst2019). Both across models and among individuals, muscle force patterns from the large lower limb functional muscle groups remained consistent across the gait, despite variation in the muscle architectural data used. However, the magnitude of those forces was affected by muscle parameter choices, with muscle and joint reaction forces varying as much as 15% depending on which muscle architecture dataset was applied. For some purposes, such as exploring shape differences in joint morphology among groups, this variation that muscle parameter choices induced in the resulting joint reaction forces may pose problems. In these instances, it is particularly important that the external kinematics, kinetics and muscle parameters used when comparing models are kept consistent (Kramer et al., Reference Kramer, Feuerriegel, Lautzenheiser and Sylvester2022).
4. Revising traditional models of form, function, and energetics
Although MSk models are becoming more common in biological anthropology, traditionally the impact of skeletal traits on the kinematics and costs of walking and running have been estimated or measured using either mathematical models or experimental studies. The resulting estimates/data have formed the basis of many influential hypotheses in biological anthropology, despite their conclusions being highly dependent on the accuracy and representativeness of the model and experimental conditions. When you change these, you can completely upend the conclusions. For example, although the overall costs of running among humans are high compared with walking (Biewener, Farley, Roberts, & Temaner, Reference Biewener, Farley, Roberts and Temaner2004), it is typically thought that these costs are relatively independent of speed (Bramble & Lieberman, Reference Bramble and Lieberman2004; Carrier, Reference Carrier1984; Kram & Taylor, Reference Kram and Taylor1990; Margaria, Cerretelli, & Sassi, Reference Margaria, Cerretelli and Sassi1963; Menier & Pugh, Reference Menier and Pugh1968). This is an important contrast to the curvilinear relationship between cost and speed among quadrupeds, a relationship first reported by Hoyt and Taylor (Reference Hoyt and Taylor1981) among ponies. This difference between the cost of transport curve in quadrupedal vs. human running forms the core of hypotheses proposing that endurance running was an important selection pressure shaping the evolution of the genus Homo (Bramble & Lieberman, Reference Bramble and Lieberman2004; Carrier, Reference Carrier1984). A linear cost of transport curve would allow a human hunter to sustain running speeds outside of the optimal speed of any quadrupedal prey (Carrier, Reference Carrier1984), and allow a persistence hunting strategy to be successful. There is no doubt that endurance running hypotheses have been extraordinarily influential in our view of human evolution, and have filtered into popular culture as well. Yet the models on which these costs of human and quadrupedal running are based suffer from the same issue as MSk models: they are built from a narrow set of input parameters that are not usually representative of variation in species- or group-level anatomy or of variation in the environmental, social and cultural conditions in which locomotion occurs in real life.
The curvilinear relationship between speed and cost of transport for quadrupeds first reported by Hoyt and Taylor (Reference Hoyt and Taylor1981) for ponies was based on data from only three individual animals, and the subsequent extrapolation of these results as typical of all quadrupedal species occurred despite being refuted on multiple occasions (Taylor, Heglund, & Maloiy Reference Taylor, Heglund and Maloiy1982; Taylor, Schmidt-Nielsen, & Raab Reference Taylor, Schmidt-Nielsen and Raab1970). Similarly, evidence of a linear relationship between human running speed and cost was derived sometimes from as few as two individuals, all male (Margaria et al., Reference Margaria, Cerretelli and Sassi1963). If these relationships are not accurate or widely applicable, our interpretation of the importance of endurance running in hominin activities becomes fuzzier. Interestingly, a carefully controlled experimental design aiming to test the fit of linear and curvilinear models to the energetic costs of human running at various speeds from 1.5 to 5.5 m/s among both males and females found a significantly better fit using a curvilinear model than a linear model, achieving an R 2 of 0.998 (Steudel-Numbers & Wall-Scheffler, Reference Steudel-Numbers and Wall-Scheffler2009). This stands in direct contrast to traditional models of independent running speeds and costs among humans on which endurance running hypotheses are based. Steudel-Numbers and Wall-Scheffler (Reference Steudel-Numbers and Wall-Scheffler2009) concluded that modern humans in fact do have an optimal running speed, and speeds above and below that are suboptimal in terms of energetic efficiency. If past hominins also had an optimal running speed, this would have increased the cost of persistence hunting so much that it may not actually have been feasible in the energy budget of past hominins.
Another of the most influential models that is fundamentally based on traditional models of locomotor efficiency and morphology is the Obstetrical Dilemma Hypothesis (ODH) (Washburn, Reference Washburn1960). The ODH posits that the female pelvis reflects an evolutionary trade-off where the locomotor efficiency of a narrow bipedal pelvis is compromised in order to accommodate the passage of a large-brained infant. The relationships between energetic efficiency and pelvic breadth on which this trade-off is based come from standard mathematical and biomechanical models of lower limb moments and forces during walking (Alexander & Jayes, Reference Alexander and Jayes1978; Alexander, Reference Alexander1980; Cavagna & Kaneko, Reference Cavagna and Kaneko1977; Lovejoy, Heiple, & Burstein, Reference Lovejoy, Heiple and Burstein1973; Ruff, Reference Ruff1995). These static models assume that external forces (GRFs) pass essentially vertically through the body's centre of gravity during the stance phase of walking, when the body is balanced on one leg – in other words, through the midline of the pelvis. As such, the moment arm of the GRFs that the hip abductors must counteract to keep the pelvis stable on one leg is taken as half of the bi-acetabular breadth of the pelvis (Lovejoy, Heiple, & Burstein, Reference Lovejoy, Heiple and Burstein1973; Ruff, Reference Ruff1995). Increasing bi-acetabular breadth (a wider pelvis) thus increases the GRF moment arm, and requires the hip abductors to exert more force to counteract it, increasing the cost of locomotion. However, more recent use of inverse dynamics paired with imaging, force plate and kinematic data from living subjects (Warrener, Lewton, Pontzer, & Lieberman, Reference Warrener, Lewton, Pontzer and Lieberman2015) found that pelvic breadth was not associated with the cost of locomotion or hip abductor mechanics in either sex. Experimentally measured muscle activity among males and females walking on a treadmill actually seemed to suggest that a broader pelvis may reduce the cost of transport, by requiring less hip adductor and hamstring activity, regardless of speed or incline (Wall-Scheffler, Chumanov, Steudel-Numbers, & Heiderscheit, Reference Wall-Scheffler, Chumanov, Steudel-Numbers and Heiderscheit2010). What this means for the ODH is a matter of debate, but the central tenet that a broader female pelvis reflects an evolutionary trade-off between locomotor efficiency and obstetric dimensions does not seem sufficient to explain variability in pelvic morphology, human gestation length or secular trends in cephalopelvic disproportion (Betti & Manica, Reference Betti and Manica2018; Dunsworth, Warrener, Deacon, Ellison, & Pontzer, Reference Dunsworth, Warrener, Deacon, Ellison and Pontzer2012; Fischer & Mitteroecker, Reference Fischer and Mitteroecker2015; Frémondière, Thollon, & Marchal, Reference Frémondière, Thollon and Marchal2022; Gruss & Schmitt, Reference Gruss and Schmitt2015; Kurki, Reference Kurki2013; Ricklan, Decrausaz, Wells, & Stock, Reference Ricklan, Decrausaz, Wells and Stock2021; Wells, Reference Wells2015; Wells, DeSilva, & Stock, Reference Wells, DeSilva and Stock2012)
4.1. The impact of walking with others and carrying load
Not only does a broad pelvis not necessarily sacrifice locomotor efficiency, it in fact provides a distinct advantage in two particular conditions: when walking with others and when carrying load. Neither of these conditions were considered in traditional biomechanically modelled or experimentally measured costs of locomotion, yet in reality, humans often walk with other humans, some or all of whom may be carrying loads while doing so. Both walking with others and carrying loads can affect the cost of walking: carrying reproductive-sized loads (pregnancy, child) slows your optimal walking speed, makes it more costly and increases the energetic penalty for walking at a suboptimal pace (Wall-Scheffler & Myers, Reference Wall-Scheffler and Myers2013), something which you may need to do when walking with other individuals (Wagnild & Wall-Scheffler, Reference Wagnild and Wall-Scheffler2013). These challenges are cross-cultural, and several solutions seem to have been universally converged upon. All societies have some type of infant-carrying device to reduce the cost of load carrying, like slings, wraps, cradleboards, etc. (Dettwyler, Reference Dettwyler1988; Konner, Reference Konner, Lee and DeVore1976; Lewis-Williams & Bannister, Reference Lewis-Williams and Bannister1991; van Hout, Reference van Hout2015), which can reduce the cost of carrying a child by 16% compared with carrying in the arms (Wall-Scheffler, Geiger, and Steudel-Numbers, Reference Wall-Scheffler, Geiger and Steudel-Numbers2007). Without an assistive device, the cost of carrying loads in the arms can be reduced instead by a broader pelvis, with savings of up to 12% (Wall-Scheffler et al., Reference Wall-Scheffler, Geiger and Steudel-Numbers2007). A broad pelvis also seems to confer greater speed flexibility (Wall-Scheffler & Myers, Reference Wall-Scheffler and Myers2013), which is important in keeping locomotor costs down when walking in a group. When the conditions of load-carrying and group mobility are incorporated into models of the cost of bipedal locomotion, a new perspective on the notably broad pelves of both male and female fossil hominins emerges (Wall-Scheffler, Reference Wall-Scheffler2012a; Wall-Scheffler et al., Reference Wall-Scheffler, Geiger and Steudel-Numbers2007; Wall-Scheffler & Myers, Reference Wall-Scheffler and Myers2013).
In this Special Collection, Cara Wall-Scheffler (Reference Wall-Scheffler2022) explores the extent to which the elevated metabolic costs of carrying a child in a sling are affected by interactions between the terrain over which you are carrying and the position of the child on the body while doing so. Over a 1000 m section of natural undulating terrain, a dorsal-carrying position was the least expensive for both sexes relative to front- or side-loading, and was the only position that did not require the parent to slow down their overall walking speed (Wall-Scheffler, Reference Wall-Scheffler2022). When encountering inclined sections of trail, parents carrying their children altered their kinematics regardless of load position, spending a significantly greater proportion of each stride in the stance rather than swing phase. This change was most dramatic for dorsal carrying, but for all positions, spending more time in stance phase probably enables better stability on a variable surface when carrying a precious cargo. In all positions (dorsal, side, front), mothers were able to carry their child more economically and more efficiently than fathers were, reflecting the relationship between a relatively wider pelvic breadth and reduced metabolic costs when carrying. The strategy that individuals employ to maximise their locomotor economy and efficiency is clearly highly variable, depending on their particular morphology, what they are carrying, where they are carrying it on their body, the terrain over which they are doing so and the kinematics that they employ. This complexity and also flexibility is simply not well captured in traditional biomechanical models of unloaded walking in fixed laboratory conditions.
4.2. The impact of substrate and terrain
Typically, locomotor costs when walking also tend to be derived from a subject moving not just alone and unloaded, but across a hard flat surface. On this substrate, long legs are associated with a lower cost of transport (Steudel-Numbers & Tilkens, Reference Steudel-Numbers and Tilkens2004; Steudel-Numbers, Weaver, & Wall-Scheffler, Reference Steudel-Numbers, Weaver and Wall-Scheffler2007). This aspect of the relationship between morphology and energetics has been influential in interpreting some of the earliest and most distinctive phenotypic changes associated with our genus Homo: the elongation of the lower limb and increases in stature. Based on the costs of moving on flat, hard surfaces, very short stature and short legs would reduce stride length, and thus increase the cost of moving the body a given distance. However, this makes it very difficult to explain the convergent evolution of particularly small body size repeatedly in modern humans independently in multiple different populations around the globe (Perry & Dominy, Reference Perry and Dominy2009), as well as among other hominins too, for example SE Asian hominins like Homo floresiensis (Brown et al., Reference Brown, Sutikna, Morwood, Soejono, Jatmiko, Saptomo and Due2004) and the recently discovered Homo luzonensis (Détroit et al., Reference Détroit, Mijares, Corny, Daver, Zanolli, Dizon and Piper2019). The answer may lie in the fact that not all substrates on which hominins and humans move(d) are hard and flat; when that condition changes, so too do the kinematics and energetic costs of locomotion.
Extinct and extant small-bodied populations have something in common: they live(d) in tropical rainforest, where vegetation is dense and the substrate is irregular and often compliant. Venkataraman et al. (Reference Venkataraman, Yegian, Wallace, Holowka, Tacey, Gurven and Kraft2018) used experimental data from the Batek and the Tsimane, two small-bodied human populations who forage in rainforest, to demonstrate that step length is constrained in such dense vegetation, forcing taller individuals to walk slower than their optimum speed. The energetic costs associated with constrained step length in this environment were not directly measured, but in a laboratory setting, walking on a soft, rather than hard, substrate eliminates the significant relationship between leg length and a lower cost of transport (Charles, Grant, D'Août, & Bates, Reference Charles, Grant, D'Août and Bates2021). Locomotion on variable surfaces is also associated with a range of kinematic alterations that affect the work done by the muscles. On soft surfaces like sand, although less muscular effort is required to provide cushioning (Tung, Franz, & Kram, Reference Tung, Franz and Kram2014), greater muscular work is required to control unwanted movement of the foot during footstrike and toe-off (Lejeune, Willems, & Heglund, Reference Lejeune, Willems and Heglund1998). The elastic recoil mechanisms of muscle–tendon units, crucial to human locomotor efficiency, are also dampened in substrates like sand (Lejeune et al., Reference Lejeune, Willems and Heglund1998), further increasing locomotor costs. Stride lengths tend to become shorter or more variable on soft or uneven surfaces (Dhawale & Venkadesan, Reference Dhawale and Venkadesan2021; Pinnington, Lloyd, Besier, & Dawson, Reference Pinnington, Lloyd, Besier and Dawson2005; Voloshina & Ferris, Reference Voloshina and Ferris2015; Voloshina, Kuo, Daley, & Ferris, Reference Voloshina, Kuo, Daley and Ferris2013), and leg posture can become more flexed (Pinnington et al., Reference Pinnington, Lloyd, Besier and Dawson2005). These kinematic changes in relation to substrate typically increase the metabolic costs of locomotion (Davies & Mackinnon, Reference Davies and Mackinnon2006; Gast, Kram, & Riemer, Reference Gast, Kram and Riemer2019; Lejeune et al., Reference Lejeune, Willems and Heglund1998; Lussiana, Fabre, Hébert-Losier, & Mourot, Reference Lussiana, Fabre, Hébert-Losier and Mourot2013; Voloshina & Ferris, Reference Voloshina and Ferris2015; Voloshina et al., Reference Voloshina, Kuo, Daley and Ferris2013), although not always (Dhawale & Venkadesan, Reference Dhawale and Venkadesan2021). However, the human locomotor system exhibits adaptability in key parameters like leg stiffness to accommodate changes in substrate and keep locomotor costs more stable: on uneven surfaces, runners reduce their joint stiffness (Dhawale & Venkadesan, Reference Dhawale and Venkadesan2021), but on soft substrates they increase it (Ferris, Louie, & Farley, Reference Ferris, Louie and Farley1998).
None of this variation in substrate, kinematics and costs is typically accounted for in traditional biomechanical models, highlighting the importance of research in more natural settings and conditions more typical of most of human evolution. In this Special Collection, Nick Holowka and colleagues (2022) explored how kinematics vary in relation to substrate in a natural forested setting, by assessing walking kinematics among the Tsimane of the Bolivian Amazon. Importantly, they quantified lower limb kinematics when walking not just across unbroken forest understory and an open hard-packed dirt field, but on forest trail as well. Trails are made and used by many human populations in heavily forested areas, probably because they provide some benefit to the energetic costs of locomotion and/or travel time, but these advantages are not well understood. Substantial changes in lower limb kinematics were evident when walking in unbroken forest compared with a hard-packed flat and open fields: the hips, knees and ankles were more flexed, the trunk more inclined, the foot swing higher and the foot strike flatter. These are in sharp contrast to the kinematics, like an extended leg, thought to be so crucial to energetically efficient bipedalism. Although walking with more flexed lower limb joints, inclined torso, a high-stepping gait and flatter foot strike would probably increase the cost of locomotion, in unbroken forest these changes help reduce the chances of tripping, lower the centre of gravity to aid balance and provide greater tactile sensitivity to the substrate, which are clear benefits when walking unshod on unstable and uneven surfaces. Forest trails mitigated some of the need for suboptimal walking kinematics, yet their construction and maintenance add their own energy costs, so more research is needed to determine how foraging strategies balance these costs and benefits in natural environments. However, for hominins moving on variable natural surfaces, some of them irregular, uneven, steep and/or slippery, it may be that the energetic advantages of bipedalism are more conservative, or at least more variable, than typical estimates of locomotor costs based only on walking over a flat open and hard substrate (Holowka, Kraft, Wallace, Gurven, & Venkataraman, Reference Holowka, Kraft, Wallace, Gurven and Venkataraman2022).
The importance of considering the environment in which a species moved when estimating the cost of locomotion is particularly crucial when interpreting the selective factors shaping diversity among hominins with wide geographic ranges, or between hominin species of African and Eurasian origins. For example, Homo neanderthalensis, a Eurasian species, had larger, broader bodies and relatively short legs and distal limb segments relative to Homo sapiens, a species of African origins (Holliday, Reference Holliday1997). As long distal limb segments, and relatively long limbs, are an advantage over flat terrain (Steudel-Numbers & Tilkens, Reference Steudel-Numbers and Tilkens2004; Steudel-Numbers et al., Reference Steudel-Numbers, Weaver and Wall-Scheffler2007), these differences are estimated to have increased locomotor costs for Neanderthals by up to 30% (Steudel-Numbers & Tilkens, Reference Steudel-Numbers and Tilkens2004). In contrast, short limbs, short distal limb segments and a large broad body provide a large volume of heat-generating tissue and minimal surface area through which to lose it, conferring a low surface-area-to-volume ratio that is a major advantage in cool conditions. Thus, the relative impact of thermoregulatory and locomotor selection pressures on the characteristic morphological differences between Neanderthals and humans is a matter of keen interest (Ocobock, Lacy, & Niclou, Reference Ocobock, Lacy and Niclou2021; Tilkens, Wall-Scheffler, Weaver, & Steudel-Numbers, Reference Tilkens, Wall-Scheffler, Weaver and Steudel-Numbers2007; Weaver & Steudel-Numbers, Reference Weaver and Steudel-Numbers2005). The interpretation of Neanderthal morphology must also take into account that some of the Neanderthals’ Eurasian range was not open and flat, but mountainous. Biomechanical modelling of lower limb forces when walking over uneven and steep terrain suggests that, in these conditions, having a shorter distal limb segment can be advantageous (Higgins & Ruff, Reference Higgins and Ruff2011). It is thus likely that Neanderthal limb and body proportions reflect optimisation to interrelating climatic and locomotion-related selection pressures. Among humans, this inter-relationship is probably even more complex, as we are a species of African origin now inhabiting every environment on the globe, and one for whom foraging strategies are extremely diverse and probably included a unique strategy: sustained running in the heat.
4.3. The interrelationship between locomotion and thermoregulation
Adaptations among humans enabling heat dissipation during sustained running are thought to have lifted one of the main constraints typically limiting the running abilities of other species (Carrier, Reference Carrier1984). Humans differ from most quadrupeds in the mechanisms through which we dissipate heat when running, including a prodigious ability to sweat that, unlike panting, has allowed evaporative heat loss over a large surface area independent of breathing (Taylor & Rowntree, Reference Taylor and Rowntree1973). The rate at which heat is lost is also maximised by our reduced body hair, enhancing both evaporative and convective cooling (Carrier, Reference Carrier1984). Ecogeographic patterning in surface-area-to-volume ratios of the body is also evident among humans globally, conforming broadly to Bergmann's and Allen's rules (Allen, Reference Allen1877; Bergmann, Reference Bergmann1847) and enhancing passive thermoregulation. Human physiology as well as body size, shape and proportions matter not just for locomotor efficiency while walking or running, but for our ability to efficiently dissipate the metabolic heat generated during locomotion in a particular environment as well. How are these costs reflected in the morphological variation of a single species with such a broad geographic range and diversity of foraging behaviours?
One unusual interdisciplinary way of investigating these questions is highlighted by a pair of papers originally published in 2019 and 2021 of which I was a part, which are included in this Special Collection as well. Together with Daniel Longman, Jay Stock and colleagues, we explored relationships between running performance and thermally optimised variation in body size, shape and proportions among ultrarunners racing in two extreme conditions: heat (southern Spain, Peruvian Amazon) and cold (Finnish Lapland, Nepalese Himalayas). Female athletes who successfully finished the hot races had significantly lower body mass and weight-for-height than those who finished the cold races, but significantly longer legs for a given height. On average then, female finishers in hot conditions had less tissue generating heat and more surface area through which to dissipate it, and the converse was true of finishers in cold conditions. Male athletes demonstrated similar patterns in relative leg length. However, participants racing in a given climate tended to have morphology more optimised for that climate in the first place, so these relationships could simply be reflecting self-selection. We thus also compared morphological traits among finishers and non-finishers in two consecutive years of the Al Andalus Ultimate Trail race, a multi-day 230 km semi-supported race. This race took place in hot, dry and relatively flat southern Andalucia at the height of summer, where daytime temperatures were in excess of 40°C. In these conditions, relationships between successful performance and morphology optimised for minimal heat generation and maximal heat loss were evident: all finishers had significantly longer legs for a given height than athletes who dropped out of the race (Longman et al., Reference Longman, Macintosh Murray, Roberts, Oakley, Wells and Stock2019), while female finishers were also significantly lighter and leaner than females who did not complete the race (Longman et al., Reference Longman, Murray, Roberts, Oakley, Wells and Stock2021). Thus, the morphological trends demonstrated between finishers of hot and cold races are probably reflecting at least some influence of thermally adapted morphology on performance.
Physical exertion for 230 km in temperatures exceeding 40°C clearly places individuals at the extremes of their thermoregulatory tolerance, where any trait that passively dissipates heat with minimal cost is likely to be an advantage. Morphology may reflect the costs of locomotion, but not independently of the environment in which that locomotion is occurring. The body size and proportions that were associated with better performance in the hot, dry and flat race described above (only 7.1 km of ascent over 230+ km of running) cannot be assumed to be the case in other environmental contexts. One of the races from which we recruited participants in the ‘cold’ group, the Everest Trail Race, starts at 2370 m of elevation, and over the course of 153 km racers climb 13.5 km and descend 13 km (Longman et al., Reference Longman, Murray, Roberts, Oakley, Wells and Stock2021). Sample sizes from this race were small, with seven females and 19 males taking part in the study, so relationships between performance and morphology were not explored in this group on its own. However, a brief perusal of trends among these mountain ultramarathon racers reveals that, for a given height, finishers were on average 8–8.5% heavier with 2.5% shorter legs relative to non-finishers of the same sex (unpublished data). If larger sample sizes demonstrated this to be a significant difference, it would be quite in opposition to the morphology that was associated with completion in the hot and flat conditions of the Al Andalus Ultimate Trail race.
Interestingly, the relationship between performance and thermally optimal morphology in a given set of environmental conditions may also vary by sex. In hot, dry and flat conditions, female ultramarathon runners demonstrated more widespread and pronounced relationships between performance and body size and limb proportions than males (Longman et al., Reference Longman, Murray, Roberts, Oakley, Wells and Stock2021). Differential reproductive endocrinology and energetics between males and females is well known (Bogin, Reference Bogin2021; Wells, Reference Wells2006), leading to characteristic patterns of sexual dimorphism in body size (Cutler, Reference Cutler1997; Eveleth, Reference Eveleth1975) and body composition (Norgan, Reference Norgan1997; Wells, Reference Wells2007) that emerge around puberty (Bogin, Reference Bogin2021). Across cultures, females tend to be smaller than males on average while carrying relatively less lean mass and relatively higher levels of peripheral subcutaneous fat (Taylor, Grant, Williams & Goulding, Reference Taylor, Grant, Williams and Goulding2010; Eveleth, Reference Eveleth1975). In endurance activities in the heat then, the smaller body size and lower lean mass for a given height of females relative to males should minimise locomotor and thermoregulatory costs, while their large reproductive fat reserves should maximise the relevant energy supply (Wall-Scheffler, Reference Wall-Scheffler2012b; Schütz et al., Reference Schütz, Billich, König, Würslin, Wiedelbach, Brambs and Machann2013). Among the athletes racing in the hot-weather ultramarathon who participated in our study, 65% of the 20 females who started the race completed it, while only half of the 38 males who started the race successfully completed it (Longman et al., Reference Longman, Macintosh Murray, Roberts, Oakley, Wells and Stock2019, 2021).
Ultraendurance racing is still quite a male-dominated sport (Zingg, Knechtle, Rosemann, & Rüst, Reference Zingg, Knechtle, Rosemann and Rüst2015), with participation rates for females typically around ~10–20% (da Fonseca-Engelhardt et al., Reference da Fonseca-Engelhardt, Knechtle, Rüst, Knechtle, Lepers and Rosemann2013; Peter, Rust, Knechtle, Rosemann, & Lepers, Reference Peter, Rust, Knechtle, Rosemann and Lepers2014; Shoak et al., Reference Shoak, Knechtle, Knechtle, Rüst, Rosemann and Lepers2013). However, despite this much lower participation, the performance gap between male and female finishing times in ultraevents can be extremely low, from around 4–6% in ultrarunning and ultraswimming (Waldvogel, Nikolaidis, Gangi & Rosemann, Reference Waldvogel, Nikolaidis, Gangi and Rosemann2019; Peter et al., Reference Peter, Rust, Knechtle, Rosemann and Lepers2014; Zingg et al., Reference Zingg, Rüst, Rosemann, Lepers and Knechtle2014) to virtually non-existent in ultra-long-distance cycling races of 400+ miles (Baumgartner, Victor Sousa, Nikolaidis, & Knechtle, Reference Baumgartner, Victor Sousa, Nikolaidis and Knechtle2020). Females are particularly more likely to match or even outperform men among the oldest age groups (Baumgartner et al., Reference Baumgartner, Victor Sousa, Nikolaidis and Knechtle2020; Stöhr et al., Reference Stöhr, Nikolaidi, Villiger, Sousa, Scheer, Hill and Knechtle2021; Waldvogel et al., Reference Waldvogel, Nikolaidis, Gangi and Rosemann2019), the longest races (Waldvogel et al., Reference Waldvogel, Nikolaidis, Gangi and Rosemann2019) and the races with the highest overall female participation (Knechtle, Valeri, Nikolaidis, Zingg, & Rosemann, Reference Knechtle, Valeri, Nikolaidis, Zingg, Rosemann and Rüst2016; Senefeld, Smith, & Hunter, Reference Senefeld, Smith and Hunter2016). The reasons why are not well understood, although differences in muscle characteristics, pacing strategies, oxygen and substrate utilisation, gastrointestinal physiology and endocrine function have all been implicated (for example, Tiller et al., Reference Tiller, Elliott-Sale, Knechtle, Wilson, Roberts and Millet2021). Interestingly, when it comes to ultrarunning, nearly all semi- or self-supported events in any environment require participants to run while wearing a backpack containing all of their supplies, nutrition, water and safety equipment. This dorsal load-carrying can alter the kinematics of the trunk and lower limb and increase the cost of running (Liew, Netto, & Morris, Reference Liew, Netto and Morris2017; Brown, O'Donovan, Hasselquist, Corner, & Schiffman, Reference Brown, O'Donovan, Hasselquist, Corner and Schiffman2014), costs that could potentially be mitigated by the broader female pelvis, assuming similar relationships in loaded running as documented in loaded walking (Wall-Scheffler, Reference Wall-Scheffler2012b).
4.4. Culture's impact on locomotor kinematics
The development of ever-more dynamic biomechanical models and experimental designs is necessary to incorporate thermoregulatory costs into our understanding of variation in structure and what it means for kinematics and locomotion in a given set of environmental and social conditions. The latter of these is perhaps more difficult to reconstruct in the past than terrain or climate, but is no less important in shaping the locomotor kinematics of a given morphology. Whether or not a behaviour is important for survival, group cohesion or play and/or is otherwise considered culturally and socially important can have an enormous impact on functional ability that is not necessarily reflected in the skeleton alone. Conversely, just because humans as a species have musculoskeletal adaptations that confer a superior capacity for sustained running (Bramble & Lieberman, Reference Bramble and Lieberman2004; Eng, Arnold, Biewener, & Lieberman, Reference Eng, Arnold, Biewener and Lieberman2015; Holowka & Lieberman, Reference Holowka and Lieberman2018; Rolian, Lieberman, Hamill, Scott, & Werbel, Reference Rolian, Lieberman, Hamill, Scott and Werbel2009; Venkadesan et al., Reference Venkadesan, Yawar, Eng, Dias, Singh, Tommasini and Mandre2020), that does not mean that endurance running is an important part of the locomotion of all humans or that, when we do run, we are any good at it.
Both a rearfoot strike pattern, where the foot contacts the ground heel-first, and ‘overstriding’, where it does so too far out in front of the body, are considered aspects of poor running technique, as they have been shown to reduce running economy and increase the risk of injury (Daoud et al., Reference Daoud, Geissler, Wang, Saretsky, Daoud and Lieberman2012; Folland, Allen, Black, Handsaker, & Forrester, Reference Folland, Allen, Black, Handsaker and Forrester2017; Lieberman, Warrener, Wang, & Castillo, Reference Lieberman, Warrener, Wang and Castillo2015). Among non-industrialised societies for whom running is a famously important part of cultural and spiritual identity, such as the Kalenjin in Kenya and the Tarahumara in Mexico, a rearfoot strike pattern or overstriding are rare (Lieberman, Reference Lieberman2014; Lieberman, Castillo, et al., Reference Lieberman, Castillo, Otarola-Castillo, Sang, Sigei, Ojiambo and Pitsiladis2015; Lieberman et al., Reference Lieberman, Venkadesan, Werbel, Daoud, Dandrea, Davis and Pitsiladis2010, Reference Lieberman, Mahaffey, Quimare, Holowka, Wallace and Baggish2020). However, this good running technique is not necessarily reflecting an evolved and naturally gifted running ability common to the human species, but rather the result of substantial learning, effort and practice. The standard approach utilised by inexperienced runners, in both industrialised and non-industrialised societies alike, seems to be to run with their natural walking kinematics: hitting the ground heel first, with the foot out in front of the body. This is documented both among non-industrialised societies in which running is uncommon, like the Daasanach of Ethiopia and Kenya and the Hadza of Tanzania (Hatala, Dingwall, Wunderlich, & Richmond, Reference Hatala, Dingwall, Wunderlich and Richmond2013; Pontzer et al., Reference Pontzer, Suchman, Raichlen, Wood, Mabulla and Marlowe2014), and among recreational runners in industrialised societies relative to elite competitive runners (Hasegawa, Yamauchi, & Kraemer, Reference Hasegawa, Yamauchi and Kraemer2007; Larson et al., Reference Larson, Higgins, Kaminski, Decker, Preble, Lyons and Normile2011). In this Special Collection, Ian Wallace and colleagues (Reference Wallace, Kraft, Venkataraman, Davis, Holowka, Harris and Gurven2022) explored running prevalence and kinematics for the first time among another non-industrialised society for whom running is uncommon: the Tsimane. Their walking kinematics are explored by this team elsewhere in this Special Collection (Holowka et al., Reference Holowka, Kraft, Wallace, Gurven and Venkataraman2022). Despite their excellent lifelong cardiovascular and physical fitness, and high levels of physical activity at all ages (Gurven, Jaeggi, Kaplan, & Cummings, Reference Gurven, Jaeggi, Kaplan and Cummings2013; Kaplan et al., Reference Kaplan, Thompson, Trumble, Wann, Allam, Beheim and Thomas2017), running is extremely uncommon: under 2.5% of their active movement over the course of three consecutive days was done at running pace. As inexperienced runners, not surprisingly they exhibited poor kinematics in unshod running trials: a rearfoot strike pattern was observed in 99% of running trials and overstriding in 98% of trials. This technique is optimal when walking, but not running; optimal running technique clearly requires learning and practice. If running is not a necessary or valuable activity in your society, this learning and practice is unlikely to happen. On the limited occasions where running is required, neither minimising risk of repetitive use injury nor maximising performance are likely to be major concerns, and suboptimal kinematics get the job done. However, if endurance running is a crucial part of your foraging strategy, is essential for survival in the environment in which you live and/or is culturally important in some way, enhancing performance and minimising injury become important. Wallace and colleagues (2022) suggest that individuals probably develop better running kinematics through both a process of unconscious natural self-optimisation and through social learning and observation.
The fact that we all share these adaptations to running, and that so too did other members of the genus Homo, suggests that running had a shared importance in our survival strategy at some point in our evolutionary history. Yet to run frequently and efficiently for sustained periods of time without getting injured, skeletal morphology on its own is not enough; humans must adjust their walking kinematics through social learning and practice, aided by a cultural identity that values and promotes that learning and practice. While it is impossible to know if endurance running was part of the cultural identity of past hominin and early human groups, it is quite possible that, just as its importance varies among cultures today, this may also have been the case in the past.
5. Concluding remarks
Making inferences about behaviour in the past from skeletal remains is challenging, given the variability possible in relationships between structure and function among humans, apes and probably hominins too. The nine papers in this Special Collection showcase the strength of an interdisciplinary methodology in addressing this challenge in evolutionary biomechanics, and provide a range of theoretical, comparative, experimental and modelling approaches to consider, characterise and incorporate variability in the relationship between bone form and function. Together, this work is helping to create a more nuanced framework through which to interpret morphology in the past, one that understands and incorporates diversity and complex relationships that exist between bone/body form, soft tissue, environment, culture and locomotor function.
Acknowledgements
I would like to thank all of the authors for their time and generosity in contributing to this Special Collection and for sharing their work in this way.
Author contributions
AM conceived of the paper and wrote the manuscript.
Financial support
The author received no financial support for writing this paper.
Conflict of interest
The author declares no conflicts of interest.
Research transparency and reproducibility
No data are associated with this article.


 Open access