


Introduction
Wheat (Triticum aestivum L.) is one of the topmost staple cereals in sub-Saharan Africa (SSA) with over 10 million ha of land under production. In terms of per capita calories consumed, food supply, and value of imports in Africa, wheat is ranked number one among the crops (Sileshi and Gebeyehu, Reference Sileshi and Gebeyehu2021). Its demand has considerably increased in the past 20 years as a result of growing population, changing food preferences, and socioeconomic change associated with urbanization (Macauley and Ramadjita, Reference Macauley and Ramadjita2015). Since domestic wheat production in SSA is unable to meet the demand, about 41 million metric tons (t) of wheat valued at US$ 12 billion are imported annually (Sileshi and Gebeyehu, Reference Sileshi and Gebeyehu2021). Annual wheat imports account for 25.4% of wheat imports on the global market (Sileshi and Gebeyehu, Reference Sileshi and Gebeyehu2021), thus making this region the world’s biggest wheat importer (Mason et al., Reference Mason, Jayne and Shiferaw2012). Ethiopia is the second largest wheat producer in Africa following South Africa (FAO 2016). With Ethiopia’s rising population and urbanization, the demand for wheat has surpassed the national supply making the current production insufficient to meet domestic needs. This has forced the country to import up to 50% of the domestic demand to fill the gap (Minot, Reference Minot2014). Wheat is mainly cultivated as mono-crops and usually involved in crop rotations (tef-wheat-food legumes) in Ethiopia. It is the major cereal crop grown in the major AEZs of Ethiopia, with an estimated area of 1.7 million ha of land and production of 4.64 million tons per year (CSA, 2018). However, the national average yield is 2.74 t ha−1 (CSA, 2018), which is lower than the experimental yield of over 5 t ha−1 and the world average yield of 4 t ha−1 (FAO, 2016).
The low wheat yield is mainly associated with the depletion of soil fertility and soil acidity (Agegnehu et al., Reference Agegnehu, Yirga and Erkossa2019; Regassa and Agegnehu, Reference Regassa, Agegnehu, Mulatu and Grando2011), continuous nutrient offtake by crops, mono-cropping in the major wheat-growing areas, lack of supply of improved seed varieties, improper use of fertilizer and low fertilizer use efficiency (Tarekegne and Tanner Reference Tarekegne and Tanner2001; Yirga et al., Reference Yirga, Tesfaye, Agegnehu, Keneni, Kassa and Asefa2002), and occurrence of disease and insect pests (Oerke, Reference Oerke2006; Sileshi and Gebeyehu, Reference Sileshi and Gebeyehu2021). To meet the growing demand, either the area under wheat production and/or productivity per unit area should be markedly increased (Sharma et al., Reference Sharma, Tyagi, Singh, Venkatesh and Gupta2015). Varietal development and adoption of improved agricultural technologies including soil fertility management are among the key interventions to improve the productivity of wheat.
Current fertilizer recommendations in Ethiopia are based on very general and a blanket recommendation of 64 N-20 P-0 K kg ha−1 in the form urea and Diammonium Phosphate (DAP). This blanket recommendation often fails to take into consideration differences in agroecology and soil type, which are key determinants of nutrient use efficiency and productivity (Sileshi et al., Reference Sileshi, Kihara, Tamene, Vanlauwe, Phiri and Jama2022). It also does not make allowances for dramatic changes in input/output price ratio, thereby discouraging farmers from fertilizer application. Moreover, the nutrients in the blanket recommendation are not well balanced, and their continued use will gradually exhaust soil nutrient reserves. Therefore, neither yields nor profits can be sustained by using unbalanced fertilizer applications, as the practice results in accelerated deficiencies of other essential nutrients. Absence of one or more nutrients or imbalances can significantly depress yield. Deficiencies of N and P, S, B, and Zn are widespread in Ethiopian soils, while some soils are also deficient in K, Cu, Mn, and Fe (Habte and Boke, Reference Habte and Boke2017). This could explain, in part, the modest crop yield improvements observed over the decades despite significant increases in fertilizer use in the country (Zeleke et al., Reference Zeleke, Agegnehu, Abera and Rashid2010).
There is an urgent need to develop crop-specific nutrient recommendations that are rationally differentiated according to AEZs, soil type, nutrient uptake, and socioeconomic circumstances of farmers. Better matching of fertilizers and balanced application of nutrients at rates suitable to the local climate and soil type can increase the productivity of wheat and can optimize nutrient use efficiency and productivity (Sileshi et al., Reference Sileshi, Kihara, Tamene, Vanlauwe, Phiri and Jama2022). However, wheat yield response and agronomic efficiency of different rates of N, P, K, and S fertilizers under balanced fertilization have not been studied on different soil types and AEZs in Ethiopia. Therefore, the objectives of this study were to (1) determine soil-specific responses of wheat to N, P, K, and S under balanced fertilization, (2) quantify agroecology-specific N, P, K, and S response of wheat under balanced fertilization, and (3) to determine nutrient use efficiency of wheat on different soil types under balanced fertilization.
Materials and Methods
Site description
Field trials were conducted over three cropping seasons from 2013 to 2017 on 24 sites distributed across 4 regions in Ethiopia. The experimental sites were Habru Seftu, Dambel, Gedeb Assasa, Ilu Sambtu, Selka Jafara, Selka Mazoria, and Selka Odda in Oromia region; Adigolo, Ayba, Embahsti, Freweyni, and Mesanu in Tigray region; Debre Guracha, Faji, and Meja in Amhara region, and Alarigeta, Angecha, Abagada, Asheba, Bobicho, Boka, Hakmura, Mera, and Shomora in the Southern Nations, Nationalities, and Peoples (SNNP) region. The sites are located within a range of 1000–3000 m above sea level, with the annual mean temperature range of 11–27.5°C and annual mean rainfall of <900 to >1000 mm (Table 1), with some areas characterized by bimodal rainfall. The study sites fall under the following agroecological zones (AEZs): tepid sub-moist mid-highlands (SM3), warm sub-moist lowlands (H3), cool sub-moist mid-highlands (SM4), tepid moist mid-highlands (M3), and tepid sub-humid mid-highlands (SH3) (Table 1). The dominant soil types in the study sites are Vertisols, Cambisols, Fluvisols, and Nitisols according to IUSS Working Group World Reference Base (WRB) classification (IUSS Working Group WRB, 2015) (Table 1).
Table 1. Characteristics of the study sites in terms of agroecological zones (AEZs) and selected soil chemical characteristics

Experimental design and treatment
The study was conducted on farmers’ fields. As indicated in Table 2, the treatments included six rates of N (0, 23, 46, 69, 92, 115, and 138 kg N ha−1), six rates of P (0,10, 20, 30, 40, and 50 kg P ha−1), eight rates of K (0, 15, 30, 45, 60, 75, 90, and 105 kg K ha−1), and six rates of S (0, 10, 20, 30, 40, and 50 kg S ha−1), all combined with the micronutrients boron (B) and zinc (Zn). The recommended NP rates of 46 kg N ha−1 and 46 kg P2O5 ha−1 and the control with no applied nutrients were included as the standard and negative control treatments, respectively. The treatments were laid out in randomized complete block design with three replications. On all sites, the plot size was 4 m by 3 m (12 m2), and the spacing between rows, plots, and blocks were 20 cm, 1 m, and 1.5 m, respectively. Nitrogen was applied in two splits, that is, half at planting and the other half at 35–45 days after planting, while the full doses of P, K, or S were applied at planting close to the seed drilling row. Urea, triple superphosphate, murate of potash (KCl), and gypsum (CaSO4.2H2O) were used as source of N, P, K, and S, respectively. Improved wheat varieties recommended for the area were sown at the seed rate of 125 kg ha−1 by using manual row maker. All other agronomic practices for wheat were applied as per the recommendation for the area.
Table 2. Treatment setup for each nutrient and basal fertilizer application rates

Data collection and statistical analysis
To measure total above-ground biomass and grain yields, the central seven rows of each plot (5 m × 1.4 m) were harvested at soil level when the crop reached physiological maturity. The harvested plants were then weighed to determine the biomass yield and threshed and weighted to determine the grain yield of each plot. Total biomass (dry matter basis) and grain yields (adjusted to a moisture content of 12.5%) were recorded on plot basis and then converted to kg ha−1 for statistical analysis.
A linear mixed model framework was used to determine the variation in yield with the different levels of N, P, K, and S by soil type and AEZ over study locations and years. The linear mixed model framework (PROC MIXED of the SAS system) was chosen for the different levels of analyses, because it allows the analysis of hierarchical or clustered data arising from observational studies through inclusion of both fixed and random effects. The mixed model approach was also chosen to account for the imbalance in terms of sample size and confounding of responses by uncontrolled variables. The fixed effects in the model were agroecology, soil type, nutrient rate, and their interactions, while location was the random effect. In mixed models, the random component specifies that the linear predictor contains a term that randomly varies with one or more ecological correlates of crop yield, for example, location within an AEZ or soil type. This helps to account for correlation, that is, observations in the same AEZ are likely to be more related than observations in other zones, and that locations are nested within AEZs or soil types. The initial model was of the following form:
 $$Y = \mu + AEZ + Soiltype + rate + AEZ * rate + Soiltype * rate + Location + \varepsilon$$
where μ is the grand mean yield (kg ha−1), AEZ is agroecological zone, soil type is the soil type of the location according to the WRB classification and correlation system (IUSS Working Group WRB, 2015), rate is the nutrient application rate (kg ha−1) for the nutrient under study, location is the random component, and ϵ is the error term. In many cases, however, sample sizes were not adequate to accommodate this model, and parameters were not correctly estimated. In addition, recent analyses show that the effect of soil type and AEZ cannot be separated because many soil types are found in specific climatic zones (Sileshi et al., Reference Sileshi, Kihara, Tamene, Vanlauwe, Phiri and Jama2022). Consequently, analyses were done in two steps, that is, for agroecology and soil type separately. As such, the models used were as follows:
For AEZs:
 $$Y = \mu + AEZ + rate + AEZ * rate + Location + \varepsilon$$
For soil type:
 $$Y = \mu + Soiltype + rate + Soiltype * rate + Location + \varepsilon$$
The variations in yield with fixed effects were considered significant when P ≤ 0.05. Least square estimates and their 95% confidence intervals (CIs) were used for statistical inference (Supplementary Table S1 and S2). This is because the 95% CI functions as a very conservative test of hypothesis, and it also attaches a measure of uncertainty to sample statistic (du Prel et al., Reference du Prel, Hommel, Röhring and Blettner2009). The means for two or more levels of a fixed effect were considered to be significantly different from one another only if their 95% CI were non-overlapping.
In order to determine the optimum rate of the nutrient in question, nutrient dose–response functions were compared and used as deemed appropriate. The first function chosen was the asymptotic function given as yield (Y): $Y = a - b{c^N}$
, where a is yield at the plateau (i.e., expected maximum), b is the amplitude (the gain in yield due to nutrient application), and c is a curvature coefficient, and X is the nutrient rate applied. When the asymptotic function fails to converge, other similar models, such as Mitscherlich, Gompertz, and logistic functions, which assume that dose–responses follow Mitscherlich the law of diminishing return, were also applied (Sileshi, Reference Sileshi2021). In addition, the quadratic function was compared with the other functions and the model that fits the data well was chosen for determination of the optimum nutrient rate. The agronomic optimum was defined as the nutrient rate at which the highest grain yield was obtained on the dose–response curve, whereas the agronomic optimum is the rate at which the highest grain yield was obtained, at the optimum pick on data point of response curve.
$Y = a - b{c^N}$
, where a is yield at the plateau (i.e., expected maximum), b is the amplitude (the gain in yield due to nutrient application), and c is a curvature coefficient, and X is the nutrient rate applied. When the asymptotic function fails to converge, other similar models, such as Mitscherlich, Gompertz, and logistic functions, which assume that dose–responses follow Mitscherlich the law of diminishing return, were also applied (Sileshi, Reference Sileshi2021). In addition, the quadratic function was compared with the other functions and the model that fits the data well was chosen for determination of the optimum nutrient rate. The agronomic optimum was defined as the nutrient rate at which the highest grain yield was obtained on the dose–response curve, whereas the agronomic optimum is the rate at which the highest grain yield was obtained, at the optimum pick on data point of response curve.
The agronomic efficiency of N (AEN) and P (AEP), defined as grain yield per unit of N or P applied, was computed as follows:
 $$AEN{\rm{\;}}\left( {kg{\rm{\;}}k{g^{ - 1}}} \right){\rm{\;}} = {{G{Y_{f - }}G{Y_u}} \over {{N_a}}}$$
 $$AEP{\rm{\;}}\left( {kg{\rm{\;}}k{g^{ - 1}}} \right){\rm{\;}} = {{G{Y_{f - }}G{Y_u}} \over {{P_a}}}$$
where GYf is the grain yield of the fertilized plot (kg ha−1), GYu is the grain yield of the unfertilized plot (kg ha−1), and Na or Pa is the quantity of N or P applied as N or P fertilizer (kg ha−1). Agronomic efficiency is the amount of additional yield obtained for each additional kg of nutrient applied (Agegnehu et al., Reference Agegnehu, Nelson and Bird2016; Fageria and Baligar, Reference Fageria and Baligar2005).
Results
Response to N rates
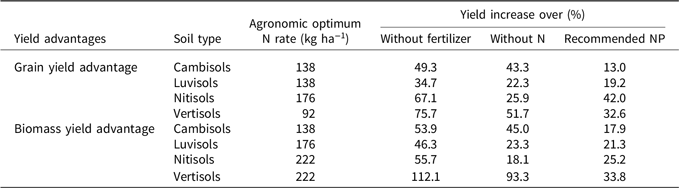
The application of N fertilizer at the different rates significantly (p < 0.01) increased grain yield of wheat across soil types compared to the recommended NP rate (Supplementary Table S3). However, yield increments were not consistent with the increase in N rate across soil types, rather yield declined at the highest N rate (222 kg N ha−1) except on Vertisols (Table 3). The lowest yield was recorded in the control (without N fertilizer) across soil types (Table 3). Higher yield increments were recorded on Cambisols and Vertisols, while yield increment was very low on Luvisols (Supplementary Table S2). Compared to the control, N application increased grain yield by 43% on Cambisols and 22% on Luvisols at 138 kg N ha−1, 26% on Nitisols at 176 kg N ha−1, and 51% on Vertisols at 92 kg N ha−1. The asymptotic dose–response function was found to be appropriate for describing yield response to N on Cambisols, Nitisols, and Vertisols, while a polynomial function was more suitable on Luvisols (Figure 1). The optimum wheat grain yields were obtained with 138 kg N ha−1 on Cambisols and Luvisols, 176 kg N ha−1 on Nitisols, and 92 kg N ha−1 on Vertisols (Figure 1).
Table 3. Response of wheat grain yield (kg ha−1) to N, P, K, and S fertilizer (see Supplementary Table S1 and 2 for details)


Figure 1. Dose–response of wheat N rates in different soil type in Ethiopia. Circles represent measured yield, while black solid lines and gray dotted lines represent the predicted yields and their 95% confidence limits, respectively.
The N dose–response curve showed a similar trend on Cambisols and Nitisols where distinct increases were observed up to 46 kg N ha−1 and then leveled off until it reached the maximum yield. In contrast, on Luvisols a gradual increase was observed in yield response to N rate until the optimum grain yield was attained at ∼92 kg N ha−1 followed by a decrease consistent with a quadratic function. On Vertisols, the yield response to N rate sharply increased up to ∼90 kg N ha−1 and continued with a slight increase up to the maximum N application rate of 222 kg ha−1 (Figure 1).
Wheat grain yield significantly (p ≤ 0.01) varied among AEZs with N rates. Yield increment due to applied N relative to the control was higher in M3 than all other AEZs (Supplementary Table S3). The highest yield of 4046 kg N ha−1 was attained in SM4 at 176 kg N ha−1, while lowest grain yield was recorded in SM3 (Table 3).
The results revealed a significant (p < 0.01) variation in total biomass yield with N rates across soil types. Total biomass yield increased with N application rates, and the highest values were recorded at 176 kg N ha−1 on Cambisols, 138 kg ha−1 on Luvisols, and at 222 kg ha−1 on both Nitisol and Vertisols. Generally, the higher biomass yield was obtained on Cambisols (Table 4). Total biomass yield response to N also significantly varied (p < 0.01) with AEZs. As in grain yield, highest total biomass yield was recorded in SH3 compared to SM3.
Table 4. Yield advantages recorded due to the application of agronomic optimum N rate over the control, without N only and with recommended NP fertilizer
Response to P rates
The mean wheat grain yield varied significantly (p < 0.05) with P application rates under balanced fertilization across soil types and AEZs (Table 3). However, total biomass yield did not significantly vary with P rates across soil types and AEZs. Across soil types, increasing P rates increased wheat grain yield by 5–27% compared to the control. Higher yield increments were recorded on Cambisols followed by Nitisols, while yield increment was very low on Luvisols and Vertisols (Supplementary Table S2). The highest yield increment (30.1%) was recorded with 50 kg P ha−1 on Cambisols, followed by 50 kg P ha−1 on Nitisol. The highest grain yield was recorded at the highest P rate on Nitisols. On all soil types, significant yield increments were not observed with P rates beyond 30 kg P ha−1 (Table 3). The leveling of response for yield with increased rates of P fertilizer application resulted in a significant quadratic component to the model. However, the patterns of variation were also similar for Cambisols, Nitisols, and Vertisols (Table 3. b). On Cambisols and Luvisols, the highest grain yield was obtained from the application of 20 kg P ha−1. However, yields consistently and linearly increased as the P rate increased on Nitisols and Vertisols; thereby, the diminishing rate of return was not reached (Figure 2).

Figure 2. Dose–response of wheat P rates in different soil type in Ethiopia. Circles represent measured yield, while black solid lines and gray dotted lines represent the predicted yields and their 95% confidence limits, respectively.
Wheat grain yield response to P also significantly varied (p ≤ 0.01) with AEZs. Yield increment due to applied P relative to the control was higher in SM3 than the other AEZs (Supplementary Table S3).
Response to K rates
The mixed-effect model analysis results did not reveal significant (p = 0.37) variation in yield with K. The 95% confidence limits of grain yields of wheat with the different K rates overlapped with yields of the control yields and the recommended NP rate on all soil types and AEZs (Table 3). The changes in yield over the control were very small (<10%) on all soil types except on Vertisols, where K application increased yields by up to 19% (Supplementary Table S3). Similarly, the changes in yield over the control were very small in all AEZs except in M3, where K application increased yields by up to 50%. The K dose–response curve also did not reveal clear trends either with soil type or AEZ (Supplementary Figure S1). Consequently, the optimum K rate could not be determined on all soil types.
Response to S rates
The application of S fertilizer at different rates had no significant effect on grain yield of wheat across the different soil types and AEZs (Table 3). The yields recorded at different S rates also did not show clear trends on the different soil types and AEZs (Supplementary Figure S1). Overall, the changes in yield over the control due S application were negligible (<5%) on the different soil types (Supplementary Table S3). Similarly, the changes in yield over the control were negligible in the different AEZs except in M3, where S application increased yields by up to 20%.
The dose–response curves also did not reveal any clear pattern for S on all soil types and AEZs (Supplementary Figure S1). Consequently, the optimum S rate could not be determined on all soil types.
Agronomic efficiency of N and P
The AEN and AEP significantly (p ≤ 0.05) varied with N and P application rates across soil types and AEZs. The mean AEN varied from 1.3 to 15.2 kg grain kg−1 N applied across soil types, with the highest value being on Vertisols (15.2 kg grain kg−1 N) followed by Cambisols (14.7 kg kg−1). Similarly, the AEP ranged from 1.2 to 49 kg grain kg−1 P, with the highest value being on Cambisols (49 kg grain increase kg−1 P) followed by Nitisols (21 kg grain kg−1 P) (Figure 3). The highest AEN and AEP were obtained with the application of 92 kg N ha−1. The agronomic efficiency increments over the highest N rate (222 kg N ha−1) were 177%.

Figure 3. Nutrient use efficiency of bread wheat under balanced fertilization in four soil types in Ethiopia.
Agronomic efficiency decreased with N rates on all soil types (Figure 3). Except on Vertisols, the highest agronomic efficiency of wheat was recorded at 46 kg N ha−1, which then decreased with increase in N rate. On Luvisols, application of at 222 kg N ha−1 resulted in the lowest AEN. Similarly, AEP decreased with increasing P rates, with the lowest AEP being on Luvisols, Vertisols, and Nitisols (Figure 3). Low amount of available soil P on Luvisols (Table 1) possibly contributed to the low AEP. On Cambisols, application of 10 kg P ha−1 resulted in the highest AEP. On Cambisols, the highest AEP was recorded with the application rate of 10 kg P ha−1.
Discussion
Deficiencies of N and P, S, B, and Zn are widespread in Ethiopian soils, while some soils are also deficient in K, Cu, Mn, and Fe (Habte and Boke, Reference Habte and Boke2017). Nitrogen (N) is often the most limiting nutrient for crop yield in Ethiopia. The present study has demonstrated significant improvement in wheat grain and total biomass yield with increasing rates of N application on different soil types. The results are consistent with previous research documenting significant responses in wheat grain yield to N application on different soil types (Guarda et al., Reference Guarda, Padovan and Delogu2004; Mansoor et al., Reference Mansoor, Ndondi, Tanner, Ndakidemi and Ngatokewa2000). The remarkable yield increments registered by the new wheat cultivars have been enhanced by the progressively higher N-inputs (Guarda et al., Reference Guarda, Padovan and Delogu2004). The results of this study show that N rates as high as 222 kg N ha−1 give substantial yield increments on some soils (e.g., Vertisols). Mansour et al. (Reference Mansour, Merwad, Yasin, Abdul-Hamid, El-Sobky and Oraby2017) similarly reported that increasing N level up to 280 kg N ha−1 significantly increased grain yield.
This study also revealed significant increases in grain yield with increasing P rates on all soils except Luvisols. Agegnehu et al. (Reference Agegnehu, Nelson, Bird and vanBeek2015) similarly found that application of P fertilizer at different rates increased wheat grain yield, up to 30% over the control. However, our results indicate that P levels between 10 and 30 kg ha−1 may be adequate, depending on soil type. P rates above 30 kg ha−1 appear to depress yields on Luvisols,
The application of different rates of K fertilizer did not significantly improve grain yields of wheat on most soils except on Vertisols, which had a slightly lower K than the other soils (Table 1). This is probably because the test soil already had sufficient K for plant growth and might be some of K+ released from non-exchangeable sources. According to the EthioSIS soil map, most Ethiopian soils are not deficient in K. This result is in agreement with the finding of Amare et al. (Reference Amare, Feyisa, Gebreselasie, Yitaferu, Tesema and Ayalew2010) who reported that application of K fertilizer on maize grain yield had no significant effect. Another study also reported that application of K did not significantly affect wheat yield (Tariq and Shah Reference Tariq and Shah2002), as the experimental soil already had sufficient K for plant growth. However, we recommend application of the minimum rate of 15 kg K ha−1 for maintenance of soil K reserves.
The results showed negligible improvement in grain yields of wheat with the different S application rates on all soils and AEZ, except in M3. This is probably because the sites have adequate soil S contents. According to Itanna (Reference Itanna2005), all soil types other than Nitisols, Andosols, and Vertisols contain soluble sulfate in adequate amount for crop production in Ethiopia. However, Nitisols had the lowest soluble sulfate, which is below the critical level for crop production (Itanna, Reference Itanna2005). Previous studies have indicated that land degradation, removal of crop residues, crop uptake, and use of non-S fertilizers are major causes of sulfur deficiency (Dibabe et al., Reference Dibabe, Bekele and Assen2007; Itanna, Reference Itanna2005). According to Weil and Mughogho (Reference Weil and Mughogho2000), failure to supply S in the form of urea or diammonium phosphate, which contain little S, contributes to S deficiency in Africa. Therefore, we recommend application of S at the minimum rate of 10 kg ha−1 for maintenance of soil S reserves and sustain wheat production.
The AEN recorded on Cambisols and Vertisols with application of 46 and 92 kg N ha−1 was in the range of commonly reported values (Agegnehu et al., Reference Agegnehu, Nelson and Bird2016; Tarekegne and Tanner, Reference Tarekegne and Tanner2001). Dargie et al. (Reference Dargie, Wogi and Kidanu2018) also reported that the AEN decreased with increasing rates of N on Vertisols and Cambisols of Tigray. The highest AEP obtained at 20 kg P ha−1 may be due to the high amount of active iron and aluminum which often results in P-fixation (Agegnehu et al., Reference Agegnehu, Yirga and Erkossa2019; Batjes, Reference Batjes2011).
The agronomic efficiency of wheat recorded in this study up to 92 kg N ha−1 falls within the range of value reported for cereals (Dobermann (Reference Dobermann2005) and wheat elsewhere. For wheat, Guarda et al. (Reference Guarda, Padovan and Delogu2004) found mean agronomic efficiency of 2–18 kg kg−1 N, while Tarekegne and Tanner (Reference Tarekegne and Tanner2001) reported agronomic efficiency of 12.6–29 and 15–26 kg yield increase kg−1 applied N on a Vertisols and Nitisol, respectively. Similar research was also reported by Haileselassie et al. (Reference Haileselassie, Habte, Haileselassie and Gebremeskel2014), where AE of wheat decreases with P rates in sandy soils. The highest agronomic efficiency was obtained at a rate of 20 kg P ha−1.
Conclusions
From the results of this study, it can be concluded that the balanced application of N, P, K, S combined with B and Zn significantly increases wheat yield. Across all four soil types and AEZs, application of 46–92 kg N ha−1 and 10–30 kg P ha−1 with balanced application of K, S, B, and Zn could be sufficient. The application of 20 kg P ha−1 was optimum for wheat production on Cambisols and Luvisols. Application of K and S at different rates did not show clear trends on the different soil types. However, application of K and S at their minimum rates of 15 kg K ha−1 and 10 kg S ha−1 should be promoted for the maintenance of soil K and S reserves and sustain productivity.
We recommend further field trials involving different N and P levels under balanced fertilization, climatic conditions, and soil types to enhance our understanding of limiting factors and facilitate formulation of site-specific fertilizer recommendations.
Supplementary material
To view supplementary material for this article, please visit https://doi.org/10.1017/S0014479722000151
Acknowledgement
The authors would like to acknowledge the Ethiopian Institute of Agricultural Research (EIAR), Oromia, Amhara, Southern and Tigray Agricultural Research Institutes (RARIs) for funding this research and generating data. The International Center for Tropical Agriculture (CIAT) and Deutsche Gesellschaft für Internationale Zusammenarbeit (GIZ) are highly appreciated for organizing the data, and facilitating and financing the preparation of this manuscript.
Funding Support
Funding for this work came from the Ethiopian Institute of Agricultural Research (EIAR), Oromia, Amhara, Southern and Tigray Agricultural Research Institutes (RARIs), the International Center for Tropical Agriculture (CIAT), and Deutsche Gesellschaft für Internationale Zusammenarbeit (GIZ). This work was supported, in whole or in part, by the Bill & Melinda Gates Foundation [INV-005460]. Under the grant conditions of the Foundation, a Creative Commons Attribution 4.0 Generic License has already been assigned to the Author Accepted Manuscript version that might arise from this submission.
Competing Interest
No competing interest among the authors and the organization.


 Open access