


Impact Statement
This study brings out a quantitative mechanistic insight into the dynamics of migrating lipid vesicles through a constricted microfluidic passage. Having a direct similitude with the movement of red blood cells in human microvascular pathways, the mapping between the initial shape and membrane bending rigidity modulus of a vesicle with three distinct dynamics (stretching, rolling and tumbling) provides cues for understanding the healthy and diseased states of cellular entities and establish exclusive connectivity of the same with the cellular membrane mechanics as well as its cytoplasm properties, an aspect that has hitherto remained unaddressed. This, in turn, may lead to a novel approach towards label-free disease detection based on exclusive image analytics, for which the current understanding is mostly empirical rather than fundamental.
1. Introduction
Comprehending the fluid dynamics of human microcirculation and its implication on various aspects of health and diseases involves delving critically into understanding the morphodynamic evolution of different cellular matters in physiologically relevant fluidic pathways (Reference Koeppen and StantonKoeppen & Stanton 2009). Whereas red blood cells (RBCs) have complexities that cannot be represented by mechanistic considerations alone, their model idealizations, such as lipid vesicles, have emerged to be enormously effective in offering valuable insights into their interactions with the surrounding fluidic media (Reference FaivreFaivre 2006; Reference KaouiKaoui 2009). These encapsulations, akin to cells, are liquid-filled globules made of a phospholipid bilayer membrane, encapsulating internal fluidic matter analogous to the cytoplasm (Reference Mader, Vitkova, Abkarian, Viallat and PodgorskiMader et al. 2006; Reference Kahali, Santra and ChakrabortyKahali, Santra & Chakraborty 2022). Despite a gross simplistic idealization, the dynamics of such model vesicles has been established to mimic quite closely the dynamics of RBCs and other similar active biological encapsulations and thus have remained at the forefront of biofluid mechanics research over the last two decades (Reference Beaucourt, Rioual, Séon, Biben and MisbahBeaucourt et al. 2004; Reference Abkarian, Faivre and ViallatAbkarian, Faivre & Viallat 2007).
The quest for understanding the fundamental interactions between vesicle dynamics and viscous stresses in the surrounding medium motivated several early studies to probe the underlying transport phenomena in steady linear shear flows, from both theoretical (Reference Fischer, Stöhr-Liesen and Schmid-SchönbeinFischer et al. 1978; Reference Keller and SkalakKeller & Skalak 1982; Reference Tran-Son-Tay, Kan, Udaykumar, Damay and ShyyTran-Son-Tay et al. 1998; Reference Biben and MisbahBiben & Misbah 2003; Reference Beaucourt, Rioual, Séon, Biben and MisbahBeaucourt et al. 2004; Reference Kantsler and SteinbergKantsler & Steinberg 2005; Reference Mader, Vitkova, Abkarian, Viallat and PodgorskiMader et al. 2006; Reference MisbahMisbah 2006; Reference KantslerKantsler 2007; Reference Noguchi and GompperNoguchi & Gompper 2007) and experimental (Reference Haas, De Blom, Duits and MellemaHaas et al. 1997; Reference Abkarian and ViallatAbkarian & Viallat 2005; Reference Kantsler and SteinbergKantsler & Steinberg 2006; Reference Christopher, Noharuddin, Taylor and AnnaChristopher et al. 2008) perspectives. These studies reveal three distinct types of vesicle motion (depending upon the magnitude of viscosity ratio between the inner and suspending fluid and the shear rate), namely tank treading (Reference Beaucourt, Rioual, Séon, Biben and MisbahBeaucourt et al. 2004; Reference Biben, Kassner and MisbahBiben, Kassner & Misbah 2005), tumbling (Reference Rioual, Biben and MisbahRioual et al. 2004) and an intermediate stage between tumbling and tank treading, known as vacillating breathing (Reference MisbahMisbah 2006). A few studies were complemented by experiments (Reference Vitkova, Mader and PodgorskiVitkova, Mader & Podgorski 2004; Reference Coupier, Farutin, Minetti, Podgorski and MisbahCoupier et al. 2012) and theories (Reference Fedosov, Peltomäki and GompperFedosov, Peltomäki & Gompper 2014; Reference Guckenberger, Kihm, John, Wagner and GekleGuckenberger et al. 2018; Reference Reichel, Mauer, Nawaz, Gompper, Guck and FedosovReichel et al. 2019; Reference Agarwal and BirosAgarwal & Biros 2020, Reference Agarwal and Biros2022) on vesicle dynamics in pressure-driven flows as well, having conceptual resemblance to physiological pumping (Reference Santra and ChakrabortySantra & Chakraborty 2020). These studies could bring out unique shape transitions of a vesicle (bullet, croissant, parachute and slipper), which could be related to its initial deflation (deviation in shape from sphericity) and domain confinement (ratio of vesicle size to channel width) of the exterior fluidic media.
In a realistic physiological microenvironment, cells do not encounter an idealized uniformity in terms of channel cross-section as considered in many of the early studies but rather confront inevitable variabilities in the flow geometry, commonly resulting from typical pathophysical scenarios such as stenosis and aneurysms. In addition, metabolic abnormalities are also believed to be linked with the reduced deformability of RBCs upon entering a constriction (Reference Zeng, Mancuso, Zivkovic, Smilowitz and RistenpartZeng et al. 2016). Further, constriction in human vasculature has an established influence on the clustering of biochemically active particles, including drug delivery agents or activated platelets, having far-reaching consequences in forming blood clots (thrombus) in stenosed blood vessels (Reference Bächer, Schrack and GekleBächer, Schrack & Gekle 2017). Furthermore, constriction-induced elongation of cells is also linked with the mechanical transduction of biological signals, alternatively known as mechanotransduction, in choked flow passages (Reference Wan, Ristenpart and StoneWan, Ristenpart & Stone 2008; Reference Mancuso and RistenpartMancuso & Ristenpart 2018). From a fundamental fluid dynamic perspective, all these scenarios inevitably feature abrupt constrictions in the flow passage that lead to the rapid convergence of the flow streamlines and thus result in drastic variations in the hydrodynamic shear stress in the exterior medium. The mechanism adopted by the deformable cellular entities to cope with this dynamic alteration in the fluidic microenvironment depends critically on the viscosity contrast between the interior and the exterior fluids, the membrane bending rigidity (Reference Marella and UdaykumarMarella & Udaykumar 2004; Reference Wang, Satoshi, Sugiyama, Noda, Jing, Liu, Che and GongWang et al. 2023) and the initial shape deflation. While it is unfeasible to study detailed hydrodynamics of the observed shape transition by probing human vasculature in vivo, essential mechanical insights of the same may be obtained via in vitro bioengineered microsystems. These systems provide explicit handles of flow control in feasible limits towards deciphering the input–output mapping, unlike what could be done on living beings with challenging invasive procedures. The advent of various microfabrication techniques over recent years has intensified research endeavours towards in vitro studies of the morphodynamics of deformable particles in microenvironments having a high level of similitude with physiological systems under the intended design controls. Several of these studies focused on studying cellular dynamics in constricted microchannels. Particular examples include real-time deformability cytometry for a continuous mechanical characterization of biological cells via illumination and imaging (Reference OttoOtto et al. 2015) and the dynamics of shear-induced ATP release from human RBCs (Reference Wan, Ristenpart and StoneWan et al. 2008), among others. These early studies were subsequently extended to characterize the mechanical behaviour of RBCs (Reference Zeng and RistenpartZeng & Ristenpart 2014) in pressure-driven flow, including their classical stretching behaviour (Reference Mancuso and RistenpartMancuso & Ristenpart 2017).
Reported research reveals that while the dynamics of deformable cells in a constricted passage has been studied, the resulting inferences drawn appear to be primarily subjective and qualitative as opposed to providing the means of arriving at comprehensive quantitative insights. As a consequence, the particular parametric regimes that influence the exclusive morphological transitions of vesicles at microfluidic constrictions remain largely unexplored. This deficit stems from the complexities in providing precise experimental and theoretical evidence under controlled kinematic conditions. Circumventing those deficits, here we capture quantitatively the unique role of membrane bending rigidity and initial shape deflation of a lipid vesicle as it transits along a geometrical constriction from stretching to tumbling motion with an intermediate rolling motion under an applied pressure gradient. The present experimental and theoretical studies converge to a regime map that provides precise quantitative insight into these dynamic transitions in terms of the relevant normalized physical parameters. Furthermore, our findings decipher the effect of viscosity contrast between the inner and the outer fluid on the extent of maximum stretching of the vesicle. These quantitative findings hold the potential of providing mechanistic insights into cellular aging (cytoplasmic viscosity increases with respect to normal healthy conditions) on its dynamic responses, for which the current state-of-the-art understanding is primarily empirical.
2. The physical problem: materials and methods
We consider a neutrally buoyant vesicle, filled with Newtonian fluid (density  ${\rho _1}$, viscosity ${\eta _1}$), suspended in another Newtonian fluid medium (density ${\rho _2}$, viscosity ${\eta _2}$), and subjected to a Poiseuille flow profile with centreline velocity ${u_c}$ in a converging microchannel, as shown in figure 1. Both fluids are assumed to be incompressible. A typical experiment starts with the release of an initially ellipsoidal vesicle with unstretched major axis length L 0, from an off-centreline position (non-dimensionally denoted by eccentricity $e = 2y/{W_d}$) at the wider section (width Wd) of the channel and observing its dynamics as it migrates through the tapered section (QR) before the constricted channel (width Wc) as demarcated by the blue dotted line in figure 1. The constriction ratio of the channel is defined as $\alpha = ({W_d}/{W_c})$. The inlet (PV), outlet (ST) and wall (PQRSTUV) boundaries are demarcated as Si, So and B, respectively (see figure 1). The orientation angle $(\theta )$ of the vesicle is defined as the angle between its major axis and the direction of flow. The Cartesian coordinate axis is located at the channel's central axis. To gain insight into the quantitative variation in stretching, we define a parameter termed stretch ratio (λ), which is the ratio of the instantaneous length of the major axis to the initial unstretched length of the vesicle, assuming a nearly ellipsoidal vesicle shape.

Figure 1. Schematic illustration of the flow domain depicting an initially elliptic vesicle, placed at an off-centre position, migrating through a constricted channel in plane Poiseuille flow at the inlet (S i).
2.1 Numerical modelling
The vesicle morphodynamics has been studied using a combination of two- (2-D) and three-dimensional (3-D) numerical simulations, which allows us to understand and confirm that the essential physics can be represented by a 2-D model that would otherwise avoid expensive computations. Moreover, the 2-D model assumption is perfectly justified from a physical perspective (from experimental findings), as the rectangular cross-section of the microchannel used for experimentation obeys the law W/h ≤ 3 (Reference Coupier, Kaoui, Podgorski and MisbahCoupier et al. 2008; Reference Santra, Mandal and ChakrabortySantra, Mandal & Chakraborty 2018), where W and h are, respectively, the width and height of the microchannel under consideration. Furthermore, in previously reported literature, several studies have demonstrated the potential of 2-D numerical models in capturing several aspects of 3-D dynamics of vesicles and RBCs, such as dynamics in a shear flow (Reference Beaucourt, Rioual, Séon, Biben and MisbahBeaucourt et al. 2004; Reference Noguchi and GompperNoguchi & Gompper 2007; Reference Dupire, Socol and ViallatDupire, Socol & Viallat 2012), cross-streamline migration in a parabolic flow (Reference Coupier, Kaoui, Podgorski and MisbahCoupier et al. 2008; Reference Kaoui, Ristow, Cantat, Misbah and ZimmermannKaoui et al. 2008) and deformation due to fluid flow (Reference Farutin and MisbahFarutin & Misbah 2011; Reference Coupier, Farutin, Minetti, Podgorski and MisbahCoupier et al. 2012; Reference Agarwal and BirosAgarwal & Biros 2022). Hence, in the present study, we have proceeded with the 2-D model to generate all the numerical results subjected to validation with the 3-D model.
2.1.1 The 3-D model
We employ a projective dynamics framework (Reference Bouaziz, Martin, Liu, Kavan and PaulyBouaziz et al. 2014), which is based on a Hamiltonian dynamics interpretation of Newton's laws of motion (Reference Liu, Bouaziz and KavanLiu, Bouaziz & Kavan 2017). In this method, the vesicle membrane is modelled as a surface embedded in 3-D space, and the positions of the interfacial marker points (obtained by triangulation of the surface) are advanced by minimizing the total energy of the vesicle, which is due to external forces on the membrane on account of interaction with the carrier fluid and internal energies which arise from constraints enforced to represent the membrane properties of the vesicle. For a detailed discussion on these constraint-based representations of the membrane properties, the reader is referred to Reference Kotsalos, Latt and ChopardKotsalos, Latt & Chopard (2019). The fluid flow is simulated using the lattice Boltzmann method, using a D3Q19 lattice structure and Bhatnagar–Gross–Krook collision operator (Reference Bhatnagar, Gross and KrookBhatnagar, Gross & Krook 1954). Further details on the different aspects of the numerical method are presented in the supplementary material (§ 1) available at https://doi.org/10.1017/flo.2024.1. The mapping between simulation parameters and their physical values is tabulated in supplementary material, table S1. A long enough (length ~ 2.72 cm) microchannel with inlet and outlet was considered in the microfluidic circuit design in order to avoid the entry and exit effect. The test section is located far enough from the inlet and the outlet. In numerical simulations, the initial position of the vesicle is adjusted in a manner such that it is at a distance of approximately five times the diameter of the vesicle, from the inlet of the channel, and similarly, the zone of observation is truncated at a distance which is of the order of five times the diameter of the vesicle, from the channel outlet.
2.1.2 The 2-D model
In an effort to explore computational economy, we use a boundary element method (Reference PozrikidisPozrikidis 2002) for 2-D simulations, which numerically evaluates the following expression for the velocity (uj) at a point (x 0) lying on a boundary of the fluid domain:
 \begin{align}\begin{aligned}
{u_j}({x_0}) & = u_j^\infty ({x_0}) - \dfrac{1}{{8{\rm \pi}
{\mu _2}}}\int_M
{{f_i}(x){G_{ij}}(x,{x_0})\,\textrm{d}S(x)} + \dfrac{{1 -
\lambda }}{{8{\rm \pi} }}\int_M^{PV}
{{u_i}(x){T_{ijk}}(x,{x_0}){n_k}(x)\,\textrm{d}S(x)} \\
& \quad + \dfrac{1}{{8{\rm \pi} }}\int_{B \cup {S_i} \cup {S_o}}
{{g_i}(x){G_{ij}}(x,{x_0})\,\textrm{d}S(x)} + \int_{B \cup
{S_i} \cup {S_o}}
{{u_i}(x){T_{ijk}}(x,{x_0}){n_k}(x)\,\textrm{d}S(x)} .
\end{aligned}\end{align}
\begin{align}\begin{aligned}
{u_j}({x_0}) & = u_j^\infty ({x_0}) - \dfrac{1}{{8{\rm \pi}
{\mu _2}}}\int_M
{{f_i}(x){G_{ij}}(x,{x_0})\,\textrm{d}S(x)} + \dfrac{{1 -
\lambda }}{{8{\rm \pi} }}\int_M^{PV}
{{u_i}(x){T_{ijk}}(x,{x_0}){n_k}(x)\,\textrm{d}S(x)} \\
& \quad + \dfrac{1}{{8{\rm \pi} }}\int_{B \cup {S_i} \cup {S_o}}
{{g_i}(x){G_{ij}}(x,{x_0})\,\textrm{d}S(x)} + \int_{B \cup
{S_i} \cup {S_o}}
{{u_i}(x){T_{ijk}}(x,{x_0}){n_k}(x)\,\textrm{d}S(x)} .
\end{aligned}\end{align}
Here,  $u_j^\infty$ denotes the imposed velocity, λ is the viscosity ratio $({\eta _1}/{\eta _2})$, nk denotes the unit normal vector, M denotes the vesicle membrane, Si and So denote the inlet and outlet of the channel, respectively, B represents the channel boundary and Gij and Tijk are the free-space Green's function and corresponding stress tensor for the Stokes equation (Reference PozrikidisPozrikidis 1992). The key term in (2.1), which accounts for the complex elastodynamic response of the membrane, is the vector fi(x), which denotes the jump in hydrodynamic traction at the vesicle membrane and can be expressed as follows (Reference PozrikidisPozrikidis 2010):
 \begin{equation}{f_i} = {-} \left( {{E_B}\frac{{\partial {\lambda_S}}}{{\partial l}} + {E_B}\kappa \frac{{\partial (\kappa - {\kappa_B})}}{{\partial l}}} \right){t_i} + \left( {{E_D}({\lambda_S} - 1)\kappa - {E_B}\frac{{{\partial^2}(\kappa - {\kappa_B})}}{{{\partial^2}l}}} \right){n_i},\end{equation}
where ED and EB denote the dilatational and bending moduli of the membrane,  ${\lambda _s}$ denotes the local stretching of the membrane, $\kappa $ denotes the local membrane curvature and ${\kappa _B}$ is the membrane curvature at equilibrium. The arc length parameter is denoted using l, and the tangential and normal vectors are denoted by ti and ${n_i}$, respectively. The motivation for choosing this constitutive relation is due to the fact that it can be applied to a variety of encapsulated entities like vesicles, capsules and RBCs, upon a suitable choice of model parameters (Reference PozrikidisPozrikidis 2010).
The last two terms appearing on the right-hand side of (2.1) denote the contributions to the interfacial velocity due to channel confinement. Since the velocity satisfies no-slip and no-penetration boundary conditions at the walls, so the last term is identically zero on the channel walls. Further, since the channel inlet and outlet (Si, So) are distanced sufficiently far from the vesicle interface, the double-layer potential becomes vanishingly small as compared to the other terms (Reference Leyrat-Maurin and Barthes-BieselLeyrat-Maurin & Barthes-Biesel 1994). Therefore, the last term can be completely dropped from the right-hand side of (2.1). The traction exerted by the channel walls on the adjacent fluid is denoted by gi(x), which is unknown a priori. The channel traction (gi) is obtained by solving the boundary integral equation (2.1) by letting x 0 be on the boundary (BUSiUSo). A similar approach was previously adopted for studying the dynamics of capsules (Reference Leyrat-Maurin and Barthes-BieselLeyrat-Maurin & Barthes-Biesel 1994) and droplets (Reference Martinez and UdellMartinez & Udell 1990). The numerical algorithm initiates by assuming an initial shape and zero interfacial velocity at time t = 0. We then obtain the interfacial traction from (2.2). Based on the same, we solve (2.1) for the channel traction by letting x 0 be located on the domain boundary. As the next step, we obtain the interfacial velocity from (2.1) by letting x 0 lie on the vesicle membrane. Subsequently, we advance the interfacial maker points using an explicit Runge–Kutta scheme. We then proceed back to the interfacial traction calculation using (2.2) and repeat the procedure until the entire domain is traversed. For detailed derivation of (2.1), the reader is referred to chapter 5 of Reference PozrikidisPozrikidis (1992). The computations are performed, starting from the ‘rbc_2d’ MATLAB script available from the open-source BEMLIB package (Reference PozrikidisPozrikidis 2002).
2.1.3 Velocity profile approximation at inlet
A 2-D, nearly parabolic fluid velocity profile (in the XY plane) at the inlet has been assumed, which is justified, since the rectangular cross-section of the 3-D channel geometry obeys the law  $W/h \le 3$ (Reference Coupier, Kaoui, Podgorski and MisbahCoupier et al. 2008), where W and h are the minimum width and height of the channel geometry under consideration. In the present experimental study, the channel dimensions are W ~ 80 μm and h ~ 30 μm, showcasing the validity of the inequality law mentioned above. Moreover, during the experiments, we waited for the flow to be established for a long time, resulting in preliminary centring of the vesicles in the z-direction.
2.2 Experimental procedure
2.2.1 Vesicle synthesis
The giant lipid vesicles (GUVs) were synthesized in the laboratory, following the standard electroformation (Reference Dimitrov and AngelovaDimitrov & Angelova 1988; Reference Angelova, Soléau, Méléard, Faucon and BothorelAngelova et al. 2007) protocol at a temperature of 25 °C. To initiate the synthesis process, firstly, a lipid stock solution was prepared by adding 2.5 mg ml−1 of DOPC (Sigma-Aldrich) phospholipids to a chloroform–methanol solution (2 : 1 v/v). Then, the stock solution was spread uniformly over an electrically conductive indium-tin-oxide (ITO)-coated glass (resistivity < 100 Ω (sq. cm)−1; Sigma Aldrich) slide using a spin coater. Sucrose (Sigma-Aldrich) aqueous solution (400 mM) was used as the inner phase of vesicles. After drying of the stock solution under vacuum for 6.5–7 hours, the sucrose solution was electro-swelled for nearly 2 hours using an AC arbitrary waveform generator (Agilent, model no. 33250A), operating at a peak-to-peak voltage of 2.5–2.6 Vpp and a frequency of 10 Hz inside a closed chamber consisting of the ITO-coated glass electrodes separated by a non-conductive polydimethylsiloxane (PDMS) spacer. This results in the formation of GUVs of size ranging between ~6 μm and 40 μm in diameter (see supplementary material, figure S4, for more details on the yield and the size distribution of electroformed vesicles).
An intended viscosity contrast (different from unity) between inner and outer fluid was achieved by adding dextran (500 kDa, Hi-media) at 1 %, 2 % and 3.3 % (w/w) to the inner sucrose solution prior to the electroformation process. See figure S5 in the supplementary material, which presents the variation in dynamic viscosity of the inner solution as a function of concentration of dextran added. Next, the vesicle solution was centrifuged (three times) at a very gentle speed (15g–30g) for 30–35 minutes to achieve sedimentation of vesicles at the bottom of the Eppendorf tube due to the action of centrifugal force. Centrifugation process is important to wash out the outer medium (dextran added) and replace it with glucose aqueous solution of slightly higher osmolarity (Reference Kantsler and SteinbergKantsler & Steinberg 2006) to achieve shape deflation. The shear viscosities of the inner and the suspending phase liquids were measured using a stress-imposed rheometer (Anton-Paar, MCR 302; TA Instruments) running in the cone and plate configuration at a constant and controlled temperature of  $25 \pm 0.6^{\circ }\textrm{C}$ with the help of a Peltier temperature controller. The properties of the reagents used as inner and suspending phase fluids are listed in table S3 in the supplementary material. Further, to alter membrane bending rigidity modulus, glutaraldehyde (Hi-media) aqueous solution was added to the electroformed vesicle solution in the range 0.5 % to 10 % (v/v) (Reference Forsyth, Wan, Ristenpart and StoneForsyth et al. 2010). For more details, see supplementary material, figure S3 and table S2.
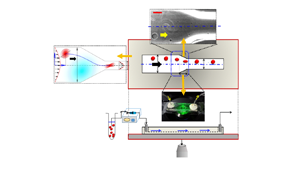
2.2.2 Microfluidic experiments and flow visualization
The microfluidic channels were fabricated using PDMS as the base material, mixed with a cross-linker (curing agent) at a ratio of 10 : 1 (w/w) following a standard soft lithography protocol. The master mould used was obtained via conventional photolithography techniques, performed using a negative photoresist (SU8 2050, Mirco-Chem). Post-curing, the microchannels were plasma-bonded (Harrick plasma) to a glass coverslip to facilitate the experimental study and flow visualization. All the experimental runs on the microfluidic test bench were performed at a controlled temperature of 25 °C. The flow rates were tuned selectively to impose precise variations in the extensional strain on the deforming vesicles (see the experimental set-up in figure 2). Representative widths of the microchannel upstream of the convergent section (Wd) and the constricted section (Wc) are  $165 \pm 2\ \mathrm{\mu }\textrm{m}$ and ~80 μm, respectively. The height of the channel was maintained at $h = 30 \pm 3\ \mathrm{\mu m}$. The convergent section has a typical length of ~180 μm, out of a total axial length of the test rig of about 2.75 cm. The distance from the inlet to the converging section is about 1.52 cm (see figure 1), which is large enough as compared to the hydrodynamic entry length in the Stokes flow limit.

Figure 2. The physical system. (a,b) Experimental set-up having flow inlet (1), outlet (3) and the test section (2). The transport phenomena are observed under an inverted, transmission-type microscope operated in phase-contrast mode. The direction of flow is shown using arrows. (c 1) A schematic of the flow domain. Wd and Wc denote the width of the diverging section (AB) and constricted section (CD), respectively. Region BC denotes the tapered region. (c 2) The experimental viewgraph with scale bar. (d) Top view and (e) front view of the experimental set-up under consideration. The coordinate axis is located at the channel centreline. The normalized distance of the observed cell centroid from the channel centreline is denoted by eccentricity e. Angle  $\theta $ denotes the initial inclination angle.
To begin the experiment (see figure 2), the vesicle suspension was first loaded in an air-tight Hamilton glass syringe, and any existing gas bubbles were purged out. Next, the syringe was connected to a syringe pump (PHD 2000, Harvard Apparatus) operating in the infuse mode to inject the sample at the microfluidic test section at a range of controlled flow rates  $\textrm{(}Q\textrm{)}\sim 30- 180\ \mathrm{\mu }\textrm{L}\ {\textrm{h}^{ - 1}}\ (Re\sim O({10^{ - 2}}- {10^{ - 1}}))$. The respective shear rates, $\dot{\gamma }\sim \bar{u}/h$ (where h is the channel height and $\bar{u}$ is the cross-sectionally averaged flow velocity) are O(10) and O(100) s−1, respectively. The vesicle dynamics was visualized with an inverted microscope (Olympus IX71, Japan) operated in phase-contrast mode (× 40 magnification, 1.6 × NA) and coupled with a high-speed camera (Phantom-v7). The high-speed camera was set to capture time sequence images at a frequency of 4000–9100 Hz. The obtained time-series image sequences were subsequently interpreted using a MATLAB GUI (Reference BasuBasu 2013) to trace the contour, centroids, trajectory, velocity and orientation angle of the moving object.
3. Results and discussion
The observed vesicle dynamics can be mapped to one among three regimes, namely ‘stretching’, ‘rolling’ and ‘tumbling’. In the stretching regime, the vesicle undergoes an elongation about its major axis as it passes through the constriction and thereafter relaxes to an equilibrium shape. On the other hand, the tumbling regime is characterized by rotation of the vesicle about an axis perpendicular to the plane of flow and negligible shape elongation. In the rolling regime, the vesicle exhibits characteristics of both stretching and tumbling motion as it is associated with a simultaneous shape elongation and rotation about its major axis. While the above shapes were qualitatively observed in the past, here we aim to put forward their quantitative depiction as mapped with the relevant physical properties. Towards this, we identify two important non-dimensional parameters responsible for these shape transitions, namely: (a) reduced area  $({\tau _{2d}})$ or reduced volume and (b) normalized bending rigidity modulus ${\tilde{E}_B} = {E_B}/{E_D}R_0^2$, where ${E_B}$ is the modulus of membrane bending rigidity, ${E_D}$ is the dilatation modulus of the vesicle membrane and R 0 is the effective radius of the vesicle, which is defined to be the radius of a circle having an equivalent surface area and can be expressed as ${R_0} = \sqrt {A/{\rm \pi} } $ (for two dimensions) or ${R_0} = \sqrt {{A_s}/4{\rm \pi} } $ (for three dimensions). Reduced area refers to the ratio of actual surface area of the vesicle to the area of a circle having the same perimeter as the vesicle, i.e. ${\tau _{2\textrm{D}}} = A/{\rm \pi} (p/2{\rm \pi} {\textrm{)}^2}$. The 3-D analogue of reduced area is known as reduced volume (ν) which refers to the ratio of the actual volume of a vesicle to the volume of a sphere having an equivalent surface area to the vesicle, i.e. $\nu = 3V/4{\rm \pi} {({A_s}/4{\rm \pi} )^{3/2}}$. The parametric dependence of τ2d and ${\tilde{E}_B}$ on the shape dynamics is elucidated using a regime diagram.
We observe that the transition from stretching to tumbling can be identified as belonging to a well-known family of dynamical transitions known as saddle-node bifurcations. Another important dimensionless parameter is the confinement ratio,  ${C_n} = 2{R_0}/{W_c}$, defined as the ratio of the effective radius R 0 of the vesicle to the half-width of the constricted channel. We also quantify the effect of the ratio of cytoplasm (inner) to extracellular (outer) fluid viscosity, ${\eta _r} = {\eta _{in}}/{\eta _{out}}$, on the extent of stretching. As quantified by stretch ratio, λ = L/L 0, where L and L 0 are the instantaneous and the initial length of the major axis of an equivalent ellipsoid-shaped vesicle under consideration. The maximum stretch ratio (λmax) is accordingly obtained as the ratio of the maximum instantaneous distance (Lmax) between a point on the vesicle contour and its centroid to its initial unstretched distance (L 0). Our computational studies are aimed to mimic the experiments with a set of property variations having established similitude with the movement of RBCs. For the same, we consider the reduced area to vary between 0.6 and 1 (Reference Abkarian, Faivre and ViallatAbkarian et al. 2007; Reference Dupire, Socol and ViallatDupire et al. 2012) and normalized bending modulus ${\tilde{E}_B}$ to vary between O(10−6) and O(10−2). These normalized parameters physically correspond to established membrane properties of vesicles and RBCs with ${E_B}\sim 3 \times {10^{ - 19}}\ \textrm{J}$; ${E_D}\sim {10^{ - 7}}- {10^{ - 1}}\ \textrm{N}\ {\textrm{m}^{ - 1}}$; ${R_0}\sim 3- 40\ \mathrm{\mu }\textrm{m}$ (Reference PozrikidisPozrikidis 2010). The physical range of v is 0.89–0.99, for experiments. All the results are obtained in the creeping flow regime conforming to hydrodynamics of low Reynolds number (Re), where $Re\sim O({10^{ - 2}}- {10^{ - 1}})$ is calculated based on the suspending fluid properties.
3.1 Stretching, rolling and tumbling dynamics prior to the constriction
Figure 3(a–c) illustrate different morphodynamic features as the lipid vesicles pass through the tapered region before the constriction (see the schematic of figure 3d). While describing these motions, the vesicles are considered without any viscosity contrast (Reference SrivastavSrivastav 2013)  $({\eta _r}\sim 1)$, to bring out exclusive influences of the bending rigidity of the membrane. In the stretching motion (figure 3a), the vesicles experience geometric constriction-induced elongational strain due to the reduction in the cross-sectional area resulting in a smooth elongation in their shape in the direction of flow, quantified by stretch ratio (λ). This reaches a maximum at the end of the tapered region (corresponding to the maximum extensional rate) and then gradually reduces to a steady value as it reaches an equilibrium shape inside the constricted channel. The insets in figure 3(a) delineate the viewgraphs obtained from experiment and 2-D simulation corresponding to the evolution of vesicle contours as a function of axial distance for a representative vesicle of reduced volume ~0.99 and ${R_0}\sim 12.1\ \mathrm{\mu }\textrm{m}$. The magnitude of the shear rate at the constricted section is maintained nearly the same by adjusting the flow velocity and the transverse position of the vesicle. In the absence of any viscosity contrast between the inner and the outer fluids, it is the confluence of membrane bending rigidity modulus $({\tilde{E}_B})$ and initial shape deflation $({\tau _{2d}})$ that controls the dynamic transition (see the regime plot in figure 4). Figure 3(c) represents the tumbling motion of a vesicle $(\nu = 0.97;{R_0} = 11.25\ \mathrm{\mu }\textrm{m})$, akin to rigid-body rotation represented by the variation in its orientation angle (θ) along the axial position, exhibiting characteristic spatiotemporal discontinuity. The rolling motion features a continuous periodic variation of θ versus x/R 0 $({R_0} = 11\ \mathrm{\mu }\textrm{m})$ (see figure 3b), showing the combined characteristics of stretching and tumbling, akin to saddle-node bifurcations where the fixed points are either created or destroyed along with a parametric sweep. On comparison with the numerical simulation results, it is evident from figure 3(a–c) that our 2-D model is in good agreement with the experimental findings. These results clearly validate that the physics of dynamical evolution of a single-out vesicle can be reliably captured via 2-D computations and also in good agreement with the 3-D lattice Boltzmann model (see supplementary material, §2(a,b), for more details on the validation of both 2-D and 3-D numerical models with our experimental observations). Therefore, to arrive at an optimal balance of physical consistency and computational economy, 2-D numerical simulations may be adhered to.

Figure 3. Three different vesicle dynamics observed prior to the constriction. (a) Stretching dynamics demarcated by stretch ratio (λ) as a function of normalized axial displacement  $(\nu = 0.99;{\tau _{2D}} = 0.99)$. The insets represent the contours (from both experiment and 2-D simulation) at different axial locations. The inset at bottom right depicts the evolution of orientation angle with axial position for stretching. Evolution of the vesicle orientation angle as a function of normalized axial displacement obtained for (b) rolling and (c) tumbling $(\nu = 0.97;{\tau _{2D}} = 0.96)$ motions. Open symbols denote the experimental results while lines represent the simulations. (d) Schematic representation of the three different motions (tumbling (T), stretching (S), rolling (R)) at the converging section prior to the constricted channel. The scale bars are mentioned on each experimental viewgraph. See supplementary movies S1–S6 for more details.

Figure 4. Transition of motion features as a function of reduced area (volume) and normalized membrane bending modulus. The S (stretching), R (rolling) and T (tumbling) regimes map quantitatively with the membrane rigidity. All the data points representing the regime map are obtained from 2-D simulations and validated against experiments.
3.2 Vesicle membrane-stiffness-mediated stretching–rolling–tumbling transition in the microfluidic constriction
We further traverse the entire dynamic regime, starting from a stretching regime, with controlled alterations in the vesicle membrane stiffness via an optimized experimental protocol. For example, in an effort to stiffen the vesicle membrane against bending, they are first incubated for 20 minutes at room temperature (~26 °C) (Reference Forsyth, Wan, Ristenpart and StoneForsyth et al. 2010) with 5 % to 10 % (v/v) glutaraldehyde (Sigma-Aldrich) solution and then used immediately for experimentation. The addition of glutaraldehyde helps polymerize the lipid membrane and thus altering its bending rigidity modulus to an extent that it can arrest the extent of stretching to a desired degree. The vesicles having controlled variations in membrane stiffness are thus functionalized to exhibit different extents of stretching (see supplementary material, figure S3).
Figure 4 showcases the different dynamic regimes that are traversed in the process, for a representative scenario having no viscosity contrast between the inner and the outer fluid. The results clearly demonstrate the interplay between the membrane bending rigidity modulus  ${\tilde{E}_B}$ and its initial shape deflation towards transiting from one dynamic regime to another. From figure 4, it may be observed that for $0.6 < {\tau _{2D}} < 0.91$, an increase in ${\tilde{E}_B}$ beyond a threshold limit results in a smooth transition from stretching to rolling to tumbling motion, for a given shear rate. For lower values of ${\tilde{E}_B}$, the membrane can restore to its original shape upon removal of external stress via elastic recovery (Reference Skotheim and SecombSkotheim & Secomb 2007). For sufficiently larger values of ${\tilde{E}_B}$, the elastic energy rise may endure tumbling as an energetically more favourable proposition as compared to the energy-expensive stretching. For the intermediate values of ${\tilde{E}_B}$, combined rotation and stretching is accompanied by a smooth variation in the orientation angle under rolling motion. Quantitatively, the resulting shape alterations are manifested by a continuous change in the orientation angle (θ) made by the major axis of the vesicle with the flow direction with reference to its normalized axial position. The corresponding numerical predictions agree well with the experimental trends as depicted in figure 3(a–c).
The observed shape transitions may be rationalized by introducing a parameter ϕ(t), denoting the instantaneous phase angle of an infinitesimal membrane element, so that its time rate of change,  $\textrm{d}\phi /\textrm{d}t$, may be linearly mapped with the frequency of the observed motion (Reference Keller and SkalakKeller & Skalak 1982). Accordingly, the following inequalities hold: ${(\textrm{d}\phi /\textrm{d}t)_{Tumbling}} < {(\textrm{d}\phi /\textrm{d}t)_{Rolling}} < {(\textrm{d}\phi /\textrm{d}t)_{Stretching}}$. For a model encapsulation having an ellipsoidal boundary (Reference Keller and SkalakKeller & Skalak 1982), one may get $\textrm{d}\phi /\textrm{d}t\sim 1/({r^{ - 1}} - r)$, where r is the ratio of the minor axis to the major axis length of the ellipse. Physically, a decrease in r would indicate declining $\textrm{d}\phi /\textrm{d}t$, resulting in a reduction in the frequency of equivalent tank-treading motion. A sharp increase in the tank-treading frequency may further be observed as the value of r approaches unity, leaving apart the singularity at r = 1. Further, for a fixed magnitude of the bending modulus of the membrane, since ${\tau _{2d}}$ decreases with a decrease in r from pure geometric considerations, it follows that $\textrm{d}\phi /\textrm{d}t$ also decreases with a decrease in ${\tau _{2d}}$. See supplementary material, §5, for a detailed derivation of the same. Furthermore, the orientation angle (θ) is observed to remain nearly constant (see figure 3(a), inset) over the stretching regime (see supplementary material, figure S1(a,d)) but exhibits a discontinuous yet periodic behaviour during tumbling. Hence, both stretching and tumbling events are fixed-point solutions in the (ϕ–θ) plane, and their basins of attraction may be demarcated exclusively by two parameters, namely the normalized bending modulus and the degree of initial deflation (see figure 4).
3.3 Effect of viscosity contrast on stretching dynamics
Figure 5 depicts that the maximum stretch ratio (λmax) increases sharply with a marginal increase in the inner-to-outer fluid viscosity ratio ηr, until an optimal value  ${\eta _{opt}}\sim 5.8$ is reached. Beyond that limit, λmax attains an asymptotic saturation. The inset of figure 5 shows the variation in stretch ratio as a function of axial position for two different viscosity ratios (ηr = 1 and 8). The experimental and simulation viewgraphs represent the vesicle contours at the different axial positions prior to the constriction. It is evident from figure 5 that the simulation results agree well with the experimental findings. The increase in λmax with ηr (see figure 5) can be explained in the light of excess viscous stress exerted by the inner fluid on the lipid bilayer membrane of the vesicle, leading to subsequent stretching and deformation of the bilayer membrane. Since the viscous stresses scale linearly with the fluid viscosity, the same would intuitively facilitate stretching. However, on increasing ηr beyond ηopt, the fluid circulation inside the vesicle gets attenuated to the extent that the same behaves effectively like a rigid particle. For a quantitative mechanistic insight on the same, see supplementary material, figure S6, which reveals that for a fixed position on the interface (corresponding to a fixed polar angle θ), the magnitude of the traction force increases with the increase in viscosity ratio, realizing an enhanced stretching ratio with an increase in ηr until ηopt is reached.

Figure 5. Variation in the maximum stretch ratio (λmax) as a function of viscosity contrast (ηr) between inner and outer fluids of the vesicles for reduced volume ~0.95 (experiment) and reduced area (2-D numerical) ~0.94. Open symbols demarcate experimental results, while blue solid lines represent numerical simulation results. The inset shows the variation in the stretching ratio (λ) as a function of axial position for viscosity contrasts: ηr = 1 and 8.
The above results obtained via modulation of the viscosity ratio appear clear in explaining the altered dynamics of the RBCs in human vascular pathways with ageing, on the account of an increase in cytosolic viscosity (Reference Ma, Wang, Qi, Han, Jin, Li, Hu and LiMa et al. 2022) due to the increased concentration of haemoglobin molecules, to an extent up to three- to fivefold with reference to the average value of the same over the healthy life cycle of RBCs (~5.5 mPa s). Similar phenomenology may manifest in certain diseased conditions (for example, malaria) due to the polymerization of haemoglobin as a common pathological artefact in infected RBCs. While these observables are reported as potential disease markers in the medical literature, their fundamental mechanophysical routes, which remained elusive thus far, may be potentially addressed by the approach outlined in this work.
4. Conclusions
We investigate the dynamics of a deformable lipid vesicle flowing through a constricted microfluidic pathway using a combination of experiments and numerical simulations. The primary contribution of this study is to develop a quantitative mapping between membrane mechanical properties and initial deflation of the vesicle from its dynamics, namely stretching, rolling and tumbling. This mapping has been established with the help of a regime diagram which predicts stretching for high values of reduced area (volume), tumbling for high membrane rigidity and an intermediate rolling regime. Finally, we have examined the effect of viscosity contrast of the inner and outer fluid over the stretching regime. The maximum stretching ratio, in the process, was shown to increase by about five times, before attaining saturation. This could hallmark the transition of the flexible vesicle to a nearly rigid entity that inhibited further shape transitions.
In addition to providing quantitative mechanistic insights into the vesicle dynamics, we believe that our study could act as a prelude to explaining various cellular morphologies observed in human microvascular physiology. While qualitatively, many such observations on altered morphology of different cells, typically RBCs, were previously reported as pathophysical alterations on account of various diseases or aging, no effective quantitative rationalization on the same could be arrived at because of a lack of precise mapping between the geometrical and physical properties and the observed morphologies, rendering the state of the art on the same to be primarily phenomenological and empirical rather than fundamental. In that perspective, our results offer a natural promise of establishing a quantitative connection between the observed cellular features and their properties, hallmarking various aspects of health and disease. Proceeding further forward, with unprecedented recent advancements in high-speed and high-resolution imaging, photographs of the dynamic images of identified cells may be potentially utilized to predict the mechanophysical properties of the same under dynamic conditions as an alternative to traditional rheometry that may not depict the realistic straining conditions as a living cell traverses complex physiological pathways having inevitable undulations and constrictions.
Supplementary material and movies
Supplementary material and movies are available at https://doi.org/10.1017/flo.2024.1.
Acknowledgements
T.K. thanks Dr G. Coupier (CNRS researcher at Liphy, France), Dr M. Abkarian (Montpellier Structural-Biology-Center), Dr C. Misbah (Director of research at CNRS, France) and Dr V. Kantsler (University of Warwick, UK) for sharing their insightful suggestions via email. T.K. conveys his sincere gratitude to Professor S. Lal Das (IIT Palakkad) for his help on the lipid vesicle synthesis via electroformation method at the early phase of learning. T.K. acknowledges helpful discussions with Mr Banuprasad T.N. (Research Scholar, IIT Kharagpur) regarding experimental issues. D.P.P. is grateful to Dr C. Kotsalos for his help in the implementation of the PALABOS library. This work used the supercomputing facility of IIT Kharagpur, established under the National Supercomputing Mission (NSM), Government of India, and was supported by the Centre for Development of Advanced Computing (CDAC), Pune.
Funding statement
S.C. gratefully acknowledges the SERB, Department of Science and Technology, Government of India, for Sir J.C. Bose National Fellowship.
Declaration of interests
The authors declare no conflict of interest.
Author contributions
T.K., D.P.P. and S.C. designed the research problem. T.K. performed all the experiments and image analytics. D.P.P. performed numerical simulations. T.K., D.P.P. and S.C. analysed the data and wrote the paper.
Data availability statement
All study data, calculation and derivations are included in the article and supplementary material.
Ethical standards
The research meets all ethical guidelines, including adherence to the legal requirements of the study country.


 Open access