


Impact Statement
This study significantly advances the understanding of droplet breakup dynamics at the second junction in microfluidic devices with two flow-focusing junctions, particularly in channels with different aspect ratios. Through experimental observations and numerical simulations, three distinct flow regimes are defined, and the relationship between droplet length, flow parameters and channel aspect ratios is thoroughly analysed. Additionally, the dynamic characteristics of droplet breakup are examined in detail, with the evolution of the droplet interface profile extracted and the three-dimensional curvature of the fluid interface calculated. It is found that the scaling exponent of the minimum neck thickness increases with the continuous phase flow rate. The scaling exponent of the mean radius of curvature in a channel with an aspect ratio of 1 differs from that in a channel with an aspect ratio of less than 1. This study holds significant fundamental research value, providing mechanical and quantitative theoretical foundations for droplet microfluidic technology. It offers theoretical guidance for the design optimisation and innovative improvement of microfluidic devices and has broad application prospects in fields such as biomedical engineering, chemical analysis and materials science.
1. Introduction
Droplet-based microfluidic technology enables precise manipulation of small fluid volumes and has found widespread application in fields such as biological detection (Pekin et al. Reference Pekin, Skhiri, Baret, Le Corre, Mazutis, Salem and Taly2011; Schaerli et al. Reference Schaerli, Wootton, Robinson, Stein, Dunsby, Neil and Hollfelder2009), chemical engineering (Roumpea et al. Reference Roumpea, Kovalchuk, Chinaud, Nowak, Simmons and Angeli2019; Wang et al. Reference Wang, Liu and Pang2018), pharmaceutical manufacturing (Windbergs et al. Reference Windbergs, Zhao, Heyman and Weitz2013; Xu et al. Reference Xu, Hashimoto, Dang, Hoare, Kohane, Whitesides and Anderson2009) and cell analysis (Abate et al. Reference Abate, Chen, Agresti and Weitz2009; Wen et al. Reference Wen, Yu, Zhu, Jiang and Qin2015), playing an increasingly significant role. The first step in microdroplet-related applications is the generation of microdroplets. It is a crucial flow phenomenon in droplet-based microfluidics, exhibiting highly nonlinear and complex dynamic behaviours influenced by both geometric structures and flow conditions (Anna, Reference Anna2016). Enhancing our understanding of interface evolution in droplet-based microfluidic technology not only advances our knowledge of fluid interface dynamics but also provides valuable insights for the design, optimisation and innovation of microfluidic devices.
The formation of droplets or bubbles in microfluidic channels occurs through the squeezing or shearing of the continuous phase, causing the dispersed phase to break up at a channel intersection and produce microdroplets or bubbles. As a typical device configuration, flow-focusing devices have been widely applied to generate microfluidic droplets. The interface evolution of the dispersed phase in flow-focusing devices usually forms a neck-shaped region. The deformation dynamics of the neck region is affected by the channel structure. A key parameter of the channel structure is the aspect ratio $\varepsilon$
, which is the ratio of the channel height and width. In square channels with
$\varepsilon$
, which is the ratio of the channel height and width. In square channels with $\varepsilon$
of 1, Lu et al. (Reference Lu, Fu, Zhu, Ma and Li2013) divided the evolution of the neck into two stages. The first stage is the liquid squeezing stage and the second stage is the free pinch-off stage, where the droplet breaks up rapidly due to Rayleigh–Plateau instability (Plateau, Reference Plateau1873; Rayleigh, Reference Rayleigh1878). In rectangular channels with
$\varepsilon$
of 1, Lu et al. (Reference Lu, Fu, Zhu, Ma and Li2013) divided the evolution of the neck into two stages. The first stage is the liquid squeezing stage and the second stage is the free pinch-off stage, where the droplet breaks up rapidly due to Rayleigh–Plateau instability (Plateau, Reference Plateau1873; Rayleigh, Reference Rayleigh1878). In rectangular channels with $\varepsilon$
less than 1, Dollet et al. (Reference Dollet, van Hoeve, Raven, Marmottant and Versluis2008) divided the evolution of the neck into two stages, including a slow two-dimensional collapse stage and a fast three-dimensional pinch-off. The thickness of the neck centre measured from a top view of the channel is usually used as a characteristic parameter to understand the evolution of the neck. The thickness typically follows a power-law relationship with the remaining breakup time, and the scaling exponent
$\varepsilon$
less than 1, Dollet et al. (Reference Dollet, van Hoeve, Raven, Marmottant and Versluis2008) divided the evolution of the neck into two stages, including a slow two-dimensional collapse stage and a fast three-dimensional pinch-off. The thickness of the neck centre measured from a top view of the channel is usually used as a characteristic parameter to understand the evolution of the neck. The thickness typically follows a power-law relationship with the remaining breakup time, and the scaling exponent $\alpha$
of the power-law relationship has been widely studied. Garstecki et al. (Reference Garstecki, Fuerstman, Stone and Whitesides2006) studied the generation of microbubbles under
$\alpha$
of the power-law relationship has been widely studied. Garstecki et al. (Reference Garstecki, Fuerstman, Stone and Whitesides2006) studied the generation of microbubbles under $\varepsilon$
less than 1 and found that if the gas thread is always confined, then the thickness of the neck centre decreases with time at a constant rate, and this is independent of interfacial tension. Fu et al. (Reference Fu, Funfschilling, Ma and Li2010) found in a square channel with
$\varepsilon$
less than 1 and found that if the gas thread is always confined, then the thickness of the neck centre decreases with time at a constant rate, and this is independent of interfacial tension. Fu et al. (Reference Fu, Funfschilling, Ma and Li2010) found in a square channel with $\varepsilon$
of 1 that
$\varepsilon$
of 1 that $\alpha$
of the bubble pinch-off stage is 1/3. Van Hoeve et al. (Reference van Hoeve, Dollet, Versluis and Lohse2011) discovered that
$\alpha$
of the bubble pinch-off stage is 1/3. Van Hoeve et al. (Reference van Hoeve, Dollet, Versluis and Lohse2011) discovered that $\alpha$
transitions from 1/3 to 1/2 during different stages in a square channel. The early stages are dominated by continuous-phase fluid volume filling the interface, and later stages are driven primarily by inertial forces.
$\alpha$
transitions from 1/3 to 1/2 during different stages in a square channel. The early stages are dominated by continuous-phase fluid volume filling the interface, and later stages are driven primarily by inertial forces.
The droplets generated by microfluidic devices can further break up into smaller droplets in a channel junction downstream. For example, Link et al. (Reference Link, Anna, Weitz and Stone2004) passively split long droplets into precisely controlled daughter droplets in a T-junction device. The droplet breakup process allows the formation of droplets in various sizes. Cubaud (Reference Cubaud2009) studied the deformation and breaking behaviour of highly viscous droplets in a microchannel with two flow-focused junctions. In the first junction, droplets are continuously produced. In the second junction, droplets significantly deform and break up. The authors defined different flow patterns and analysed the effects of initial droplet length and viscosity ratio on deformation. Our recent study (Chen et al. Reference Chen, Xue and Hu2019) investigated the breakup of confined long droplets in circular channels at low capillary numbers and revealed the breakup mechanism of confined liquid threads in the flow-focusing microchannel. The liquid thread interface deforms quasi-statically and eventually becomes unstable with the capillary pressure gradient induced by the confining geometry and the external flow. The deformed interface is usually a constant mean curvature, which is a constant-mean-curvature surface. The study also showed that the first radius of curvature of the neck centre cannot characterise the dynamic deformation at the neck centre, as three-dimensional effects must be considered and represented by the mean radius of curvature. Subsequent work (Wang et al. 2009) also focused on the problem of long droplet breakup in circular channels, determining the critical geometric conditions of long droplet breakup. Currently, research on droplet breakup in square or rectangular channels is limited. Studying the breakup process of confined droplets in channels with different aspect ratios is significant. The confined breakup of droplets in microfluidic devices has significant applications across various fields. For instance, Panwar et al. (Reference Panwar, Utharala, Fennelly, Frenzel and Merten2023) demonstrated that microdroplets encapsulating cells, generated at flow-focusing junctions, split downstream into two distinct parts: droplets encapsulating cells and waste droplets without encapsulated cells, thereby enabling effective droplet sorting. In secondary oil recovery, Singh et al. (Reference Singh, Jung, Brinkmann and Seemann2019) investigated the displacement process of immiscible fluids in porous media. During this process, droplets may break up into smaller units, potentially increasing the contact area between the displacing fluid and the oil, which could enhance microscopic oil displacement efficiency.
In this study, microfluidic devices with two flow-focusing junctions and different aspect ratios are designed. Confined droplets are generated at the first flow-focusing junction and they break up at the second junction. The study combines both experimental and numerical methods to analyse the deformation and breakup processes of droplets. It focuses on revealing the interface evolution and dynamic behaviour of droplets under different flow conditions and geometric configurations. Various flow patterns and regime diagrams are studied in detail, along with the evolution patterns of the neck shape and curvature distribution.
2. Method of solution
2.1. Experimental method
The fabrication of microfluidic channels is carried out using a standard soft lithography method (McDonald et al. Reference McDonald, Duffy, Anderson, Chiu, Wu, Schueller and Whitesides2000; Whitesides & Stroock, Reference Whitesides and Stroock2001). First, polydimethylsiloxane (PDMS) is mixed with a curing agent (Sylgard 184, Dow Corning Inc., USA) in a 10:1 ratio. After mixing, the mixture is degassed in a vacuum desiccator to remove any bubbles. Next, a silicon wafer (Suzhou, Chip Technology Corp. Ltd, China) with an etched channel pattern is placed flat in a tin foil box, ensuring the bottom is level and the prepared liquid PDMS is poured over it. The PDMS is heated at 80 $^{\circ } \mathrm {C}$
for 2 hours to solidify. After cooling, the PDMS is peeled off from the silicon wafer and tin foil, and the channel model is cut to the desired dimensions. Holes are punched at the inlet and outlet positions of the PDMS channels using a flat-tipped needle. Separately, a glass slide is spin-coated with a layer of PDMS and placed in a high-speed centrifuge for 2 minutes to ensure even coverage, followed by baking at 80
$^{\circ } \mathrm {C}$
for 2 hours to solidify. After cooling, the PDMS is peeled off from the silicon wafer and tin foil, and the channel model is cut to the desired dimensions. Holes are punched at the inlet and outlet positions of the PDMS channels using a flat-tipped needle. Separately, a glass slide is spin-coated with a layer of PDMS and placed in a high-speed centrifuge for 2 minutes to ensure even coverage, followed by baking at 80 $^{\circ } \mathrm {C}$
for 30 minutes. Subsequently, the PDMS channel and the coated glass slide are treated with air plasma for 1 minute and immediately bonded together. To enhance the bonding strength and the hydrophobicity of the channel walls, the assembly is heated at 80
$^{\circ } \mathrm {C}$
for 30 minutes. Subsequently, the PDMS channel and the coated glass slide are treated with air plasma for 1 minute and immediately bonded together. To enhance the bonding strength and the hydrophobicity of the channel walls, the assembly is heated at 80 $^{\circ } \mathrm {C}$
for 1 hour and left overnight. Finally, plastic tubes are inserted and sealed, completing the fabrication of the microfluidic chip. A schematic diagram of the channel structure is shown in figure 1. It adopts a symmetric layout with two cross-junctions. The dispersed phase
$^{\circ } \mathrm {C}$
for 1 hour and left overnight. Finally, plastic tubes are inserted and sealed, completing the fabrication of the microfluidic chip. A schematic diagram of the channel structure is shown in figure 1. It adopts a symmetric layout with two cross-junctions. The dispersed phase $Q_1$
and the continuous phase
$Q_1$
and the continuous phase $Q_2$
form a droplet of finite length at the first junction. The droplet then deforms when it meets the continuous phase
$Q_2$
form a droplet of finite length at the first junction. The droplet then deforms when it meets the continuous phase $Q_3$
at the second junction. We fabricate three different microfluidic channels with varying aspect ratios, where the channel height
$Q_3$
at the second junction. We fabricate three different microfluidic channels with varying aspect ratios, where the channel height $h$
is uniformly set to 100 μm. The widths of the side and main channels
$h$
is uniformly set to 100 μm. The widths of the side and main channels $w$
are 100, 200 and 300 μm, respectively. The channel aspect ratio is defined as
$w$
are 100, 200 and 300 μm, respectively. The channel aspect ratio is defined as $\varepsilon$
=
$\varepsilon$
= $h / w$
, corresponding to 1:1, 1:2 and 1:3.
$h / w$
, corresponding to 1:1, 1:2 and 1:3.
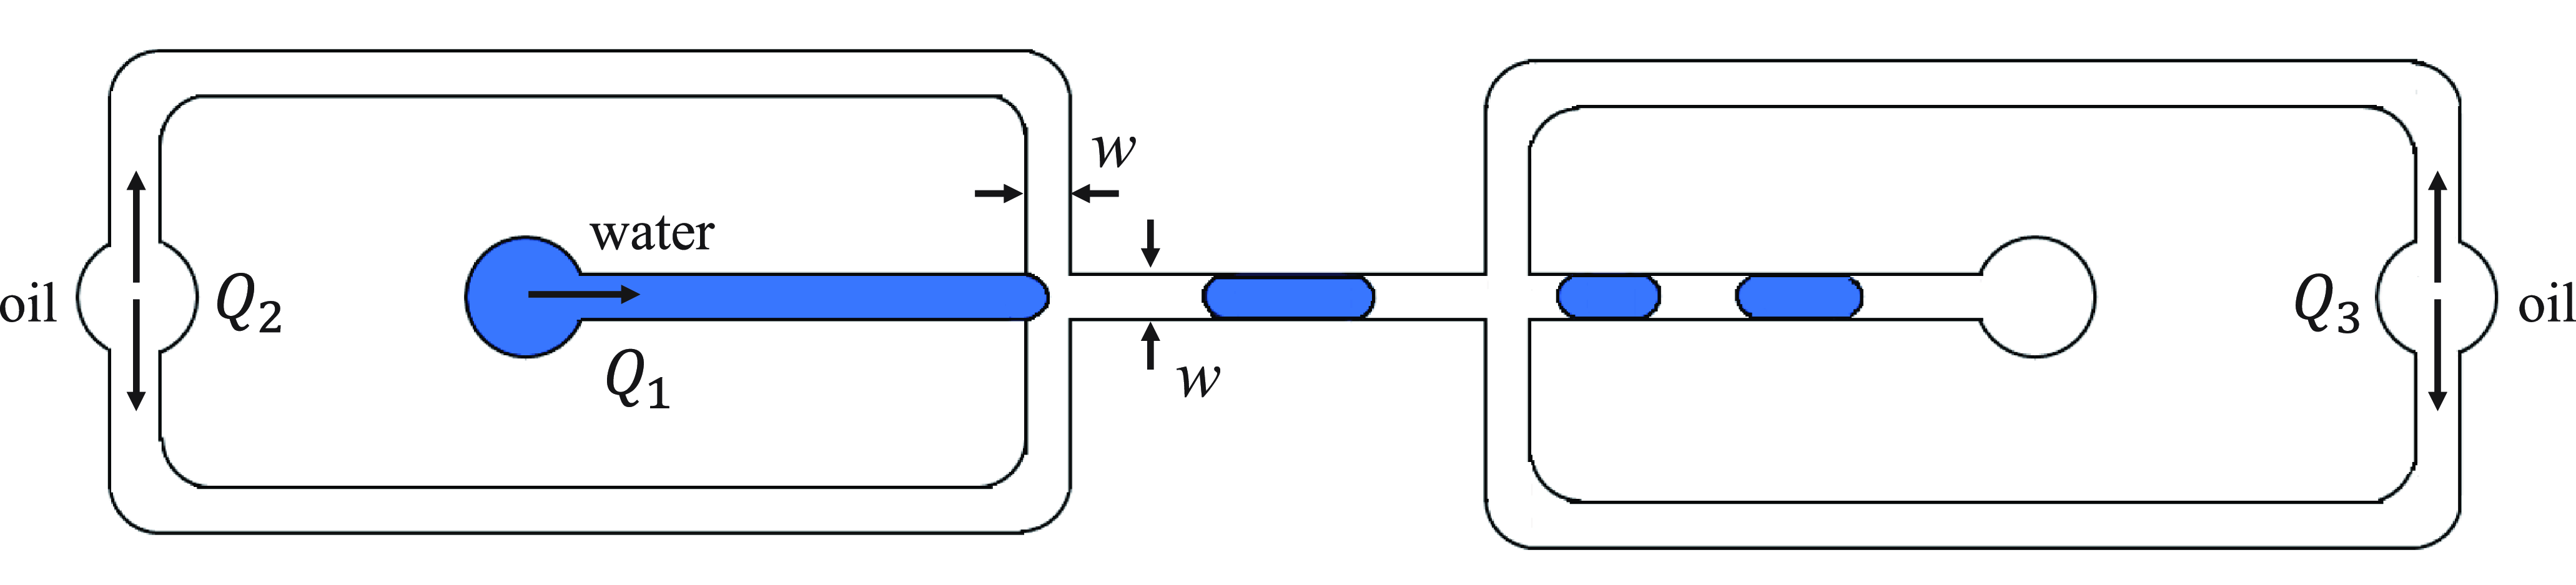
Figure 1. Schematic diagram of microfluidic device with two flow-focusing channel junctions. The droplet forms at the first junction and deforms at the second junction.
In the experiment, deionised water is used as the dispersed phase. In contrast, the continuous phase consists of mineral oil (M8410, Sigma-Aldrich Trading Co., USA) with $3\, \%\ (\mathrm {w} / \mathrm {w})$
Span 80 (S6760, Sigma-Aldrich (Shanghai) Trading Co. Ltd, China) (Bashir et al. Reference Bashir, Solvas, Bashir, Rees and Zimmerman2014). The surfactant concentration is significantly higher than the critical micelle concentration of the mineral oil. To stably form water-in-oil emulsions and improve imaging clarity, the hydrophobicity of the microchannel walls is enhanced by filling the channels with Aquapel rain repellent (Pittsburgh Glass Works LLC, USA) for 40 s, followed by flushing with mineral oil and drying with compressed air (Haringa et al. Reference Haringa, De Jong, Hoang, Portela, Kleijn, Kreutzer and van Steijn2019). The densities of the dispersed and continuous phases are 998.0 and 843.1
$3\, \%\ (\mathrm {w} / \mathrm {w})$
Span 80 (S6760, Sigma-Aldrich (Shanghai) Trading Co. Ltd, China) (Bashir et al. Reference Bashir, Solvas, Bashir, Rees and Zimmerman2014). The surfactant concentration is significantly higher than the critical micelle concentration of the mineral oil. To stably form water-in-oil emulsions and improve imaging clarity, the hydrophobicity of the microchannel walls is enhanced by filling the channels with Aquapel rain repellent (Pittsburgh Glass Works LLC, USA) for 40 s, followed by flushing with mineral oil and drying with compressed air (Haringa et al. Reference Haringa, De Jong, Hoang, Portela, Kleijn, Kreutzer and van Steijn2019). The densities of the dispersed and continuous phases are 998.0 and 843.1 $\mathrm {kg}\, \mathrm {m}^{-3}$
, respectively, with viscosities of 1.0 and 24.1 cSt, and an interfacial tension
$\mathrm {kg}\, \mathrm {m}^{-3}$
, respectively, with viscosities of 1.0 and 24.1 cSt, and an interfacial tension $\sigma$
of 4.3
$\sigma$
of 4.3 $\mathrm {mN}\, \mathrm {m}^{-1}$
(Bashir et al. Reference Bashir, Solvas, Bashir, Rees and Zimmerman2014). The two liquids are injected into the channels using a syringe pump (Pump 11p Plus Elite Dual, Harvard Apparatus Inc., USA). Before the experiment, air is purged from the syringes and tubing, and the channels are flushed with the dispersed phase to remove any potential bubbles or impurities. The dynamics of the droplet breakup is recorded using a PCO.dimax HS1 high-speed camera (PCO Imaging, Germany) connected to an inverted microscope (Nikon Ti2-U, Japan) at a maximum frame rate of 12 000 Hz. After each flow rate adjustment, a waiting period of 1–2 minutes is observed to ensure the fluid thread size stabilises before recording.
$\mathrm {mN}\, \mathrm {m}^{-1}$
(Bashir et al. Reference Bashir, Solvas, Bashir, Rees and Zimmerman2014). The two liquids are injected into the channels using a syringe pump (Pump 11p Plus Elite Dual, Harvard Apparatus Inc., USA). Before the experiment, air is purged from the syringes and tubing, and the channels are flushed with the dispersed phase to remove any potential bubbles or impurities. The dynamics of the droplet breakup is recorded using a PCO.dimax HS1 high-speed camera (PCO Imaging, Germany) connected to an inverted microscope (Nikon Ti2-U, Japan) at a maximum frame rate of 12 000 Hz. After each flow rate adjustment, a waiting period of 1–2 minutes is observed to ensure the fluid thread size stabilises before recording.
2.2. Numerical method
The numerical simulation is conducted using OpenFOAM® v2306, solving the incompressible, variable-density Navier–Stokes equations with surface tension consideration:
 \begin{equation} \rho \left (\partial _{t} \mathbf {u}+\mathbf {u} \cdot \nabla \mathbf {u}\right)=-\nabla p+\nabla \cdot (2 \mu \mathbf {D})+\sigma \kappa \delta _{s} \mathbf {n}, \end{equation}
 \begin{equation} \nabla \cdot \mathbf {u}=0. \end{equation}
The advection equation for the density is the following:
 \begin{equation} \partial _{t} \rho +\nabla \cdot (\rho \mathbf {u})=0, \end{equation}
where $\mathbf {u}$
is the velocity vector,
$\mathbf {u}$
is the velocity vector, $\rho$
is the fluid density,
$\rho$
is the fluid density, $\mu$
is the dynamic viscosity and
$\mu$
is the dynamic viscosity and $\mathbf {D}$
is the strain-rate tensor, with its components defined as
$\mathbf {D}$
is the strain-rate tensor, with its components defined as $D_{i j}=\left (\partial _i u_j+\partial _j u_i\right) / 2$
. Parameter
$D_{i j}=\left (\partial _i u_j+\partial _j u_i\right) / 2$
. Parameter $\sigma$
represents the surface tension at the interface and the Dirac delta function
$\sigma$
represents the surface tension at the interface and the Dirac delta function $\delta _{s}$
indicates that
$\delta _{s}$
indicates that $\sigma$
is only present at the interface. Parameter
$\sigma$
is only present at the interface. Parameter $\kappa$
is the curvature of the interface and
$\kappa$
is the curvature of the interface and $\mathbf {n}$
is the unit normal vector pointing outward from the interface.
$\mathbf {n}$
is the unit normal vector pointing outward from the interface.
For the generation of single emulsion droplets in a two-phase fluid, the volume-of-fluid method can capture the interface between the two phases by introducing the volume fraction of the fluid $c(x, t)$
. The density and viscosity of the fluid can then be expressed as
$c(x, t)$
. The density and viscosity of the fluid can then be expressed as
 \begin{equation} \rho (c) \equiv c \rho _1+(1-c) \rho _2, \end{equation}
 \begin{equation} \mu (c) \equiv c \mu _1+(1-c) \mu _2, \end{equation}
where $\rho _1$
,
$\rho _1$
, $\rho _2$
and
$\rho _2$
and $\mu _1$
,
$\mu _1$
, $\mu _2$
are the densities and viscosities of the first and second phases, respectively. Equation (2.4) can be further transformed into the convection equation for the volume fraction:
$\mu _2$
are the densities and viscosities of the first and second phases, respectively. Equation (2.4) can be further transformed into the convection equation for the volume fraction:
 \begin{equation} \partial _{t} c+\nabla \cdot (c \mathbf {u})=0. \end{equation}

Figure 2. Mesh and boundary conditions for the quarter-section numerical model of the microfluidic channel with $\varepsilon$
= 1/2.
$\varepsilon$
= 1/2.
For the volume-of-fluid algorithm, this study employs the piecewise linear interface reconstruction scheme (PLIC) based on the reconstructed distance function (RDF). The conventional Multidimensional Universal Limiter for Explicit Solver (MULES) has limitations in capturing sharp two-phase flow interfaces due to the trade-off between interface sharpening and maintaining a bounded volume fraction, which can lead to unrealistic fluctuations. The PLIC–RDF scheme excels at maintaining interface sharpness even on high-resolution or unstructured meshes, and it can significantly reduce spurious currents caused by inaccurate interface reconstruction (Gamet et al. Reference Gamet, Scala, Roenby, Scheufler and Pierson2020; Scheufler & Roenby, Reference Scheufler and Roenby2019; Siriano et al. Reference Siriano, Balcázar, Tassone, Rigola and Caruso2022). As a result, this method enables more accurate and efficient simulations of multiphase flow problems. Time discretisation is handled using the explicit Euler method, gradient terms are discretised using the Gauss linear scheme (a second-order-accurate and unbounded method) and Laplacian terms are treated with the Gauss linear corrected scheme (a second-order-accurate method). The convection term in the momentum equation is discretised using the Gauss upwind scheme (a first-order-accurate and bounded method), while the convection term for the volume fraction $\alpha$
is treated with the van Leer scheme. The convection term of the redistributed
$\alpha$
is treated with the van Leer scheme. The convection term of the redistributed $\alpha$
is discretised using the Gauss linear scheme to better capture the interface. The decoupling of velocity and pressure is achieved using the PIMPLE algorithm, which combines the semi-implicit method for pressure-linked equations (SIMPLE) and pressure implicit with splitting of operators (PISO) algorithms, with the pressure term solved by the generalised geometric-algebraic multi-grid (GAMG) linear solver, utilising the diagonal incomplete-Cholesky (DIC) smoother. The velocity field is solved using the smoothSolver combined with Gauss–Seidel smoothing. An adaptive time-stepping approach is employed, with the maximum Courant number kept below 0.2. For details of the above mentioned numerical methods in OpenFOAM, we refer the reader to the OpenFOAM user guide (OpenFOAM 2023).
$\alpha$
is discretised using the Gauss linear scheme to better capture the interface. The decoupling of velocity and pressure is achieved using the PIMPLE algorithm, which combines the semi-implicit method for pressure-linked equations (SIMPLE) and pressure implicit with splitting of operators (PISO) algorithms, with the pressure term solved by the generalised geometric-algebraic multi-grid (GAMG) linear solver, utilising the diagonal incomplete-Cholesky (DIC) smoother. The velocity field is solved using the smoothSolver combined with Gauss–Seidel smoothing. An adaptive time-stepping approach is employed, with the maximum Courant number kept below 0.2. For details of the above mentioned numerical methods in OpenFOAM, we refer the reader to the OpenFOAM user guide (OpenFOAM 2023).
The mesh and boundary conditions of the computational domain are shown in figure 2, illustrating a quarter-section model of the microchannel with symmetry planes and an aspect ratio of $\varepsilon = 1/2$
. Since our primary focus is on the droplet breakup at the second junction, only the model containing that junction is constructed. The simulation applies a uniform velocity boundary condition at the inlet, while a reference pressure and zero-gradient volume fraction are prescribed at the outlet. A no-slip boundary condition is used at the wall, with a static contact angle of
$\varepsilon = 1/2$
. Since our primary focus is on the droplet breakup at the second junction, only the model containing that junction is constructed. The simulation applies a uniform velocity boundary condition at the inlet, while a reference pressure and zero-gradient volume fraction are prescribed at the outlet. A no-slip boundary condition is used at the wall, with a static contact angle of $\theta$
= 180
$\theta$
= 180 $^{\circ }$
. The flow field is first stabilised in the oil-only channel by simulating for a sufficient time, after which a rectangular droplet of a certain length is initialised. The process of the droplet relaxing to its equilibrium shape, passing through the cross-junction and finally exiting the computational domain is recorded. The computational domain is divided using hexahedral elements, inspired by the method proposed by Sontti & Atta (Reference Sontti, Atta and Research2019), with refinement starting 40 μm from the wall. Additionally, to effectively capture the liquid film between the droplets and the microchannel wall (Chen et al. Reference Chen, Song, Li and Hu2015), the minimum mesh size near the wall is set to
$^{\circ }$
. The flow field is first stabilised in the oil-only channel by simulating for a sufficient time, after which a rectangular droplet of a certain length is initialised. The process of the droplet relaxing to its equilibrium shape, passing through the cross-junction and finally exiting the computational domain is recorded. The computational domain is divided using hexahedral elements, inspired by the method proposed by Sontti & Atta (Reference Sontti, Atta and Research2019), with refinement starting 40 μm from the wall. Additionally, to effectively capture the liquid film between the droplets and the microchannel wall (Chen et al. Reference Chen, Song, Li and Hu2015), the minimum mesh size near the wall is set to $\varDelta$
= 1 μm.
$\varDelta$
= 1 μm.
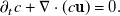
As shown in figure 3, a grid independence study is conducted to evaluate the time evolution of half the neck thickness, $T_n$
, and the droplet interface shape near the onset of breakup. Three grid resolution models with cell sizes of
$T_n$
, and the droplet interface shape near the onset of breakup. Three grid resolution models with cell sizes of $\varDelta = 2.5\ \mu \text{m}$
,
$\varDelta = 2.5\ \mu \text{m}$
, $\varDelta = 5\ \mu \text{m}$
and
$\varDelta = 5\ \mu \text{m}$
and $\varDelta = 10\ \mu \text{m}$
are established in the central region of the cross-junction, all with identical initial droplet lengths and maintaining a consistent minimal mesh size near the walls. Figure 3(a) presents the evolution of the
$\varDelta = 10\ \mu \text{m}$
are established in the central region of the cross-junction, all with identical initial droplet lengths and maintaining a consistent minimal mesh size near the walls. Figure 3(a) presents the evolution of the $T_n$
with respect to the remaining time until breakup,
$T_n$
with respect to the remaining time until breakup, $\tau$
, for models with different grid resolutions in a channel with an aspect ratio of
$\tau$
, for models with different grid resolutions in a channel with an aspect ratio of $\varepsilon = 1$
. The numerical results for
$\varepsilon = 1$
. The numerical results for $\varDelta$
= 2.5 μm and
$\varDelta$
= 2.5 μm and $\varDelta$
= 5 μm are generally consistent. Figure 3(b) compares the droplet interface shape near the onset of breakup under different grid resolutions. It can be seen that the three simulation results show little difference; however, the interface boundary for
$\varDelta$
= 5 μm are generally consistent. Figure 3(b) compares the droplet interface shape near the onset of breakup under different grid resolutions. It can be seen that the three simulation results show little difference; however, the interface boundary for $\varDelta$
= 10 μm is not sufficiently sharp, and the larger mesh size cannot effectively capture the droplet when it becomes thinner. The droplet shape and boundary for
$\varDelta$
= 10 μm is not sufficiently sharp, and the larger mesh size cannot effectively capture the droplet when it becomes thinner. The droplet shape and boundary for $\varDelta$
= 5 μm closely resemble those for
$\varDelta$
= 5 μm closely resemble those for $\varDelta$
= 2.5 μm. Therefore, considering both computational accuracy and time, the mesh element size used in this study is set to
$\varDelta$
= 2.5 μm. Therefore, considering both computational accuracy and time, the mesh element size used in this study is set to $\varDelta$
= 5 μm in the central region of the junction and
$\varDelta$
= 5 μm in the central region of the junction and $\varDelta$
= 1 μm near the wall.
$\varDelta$
= 1 μm near the wall.
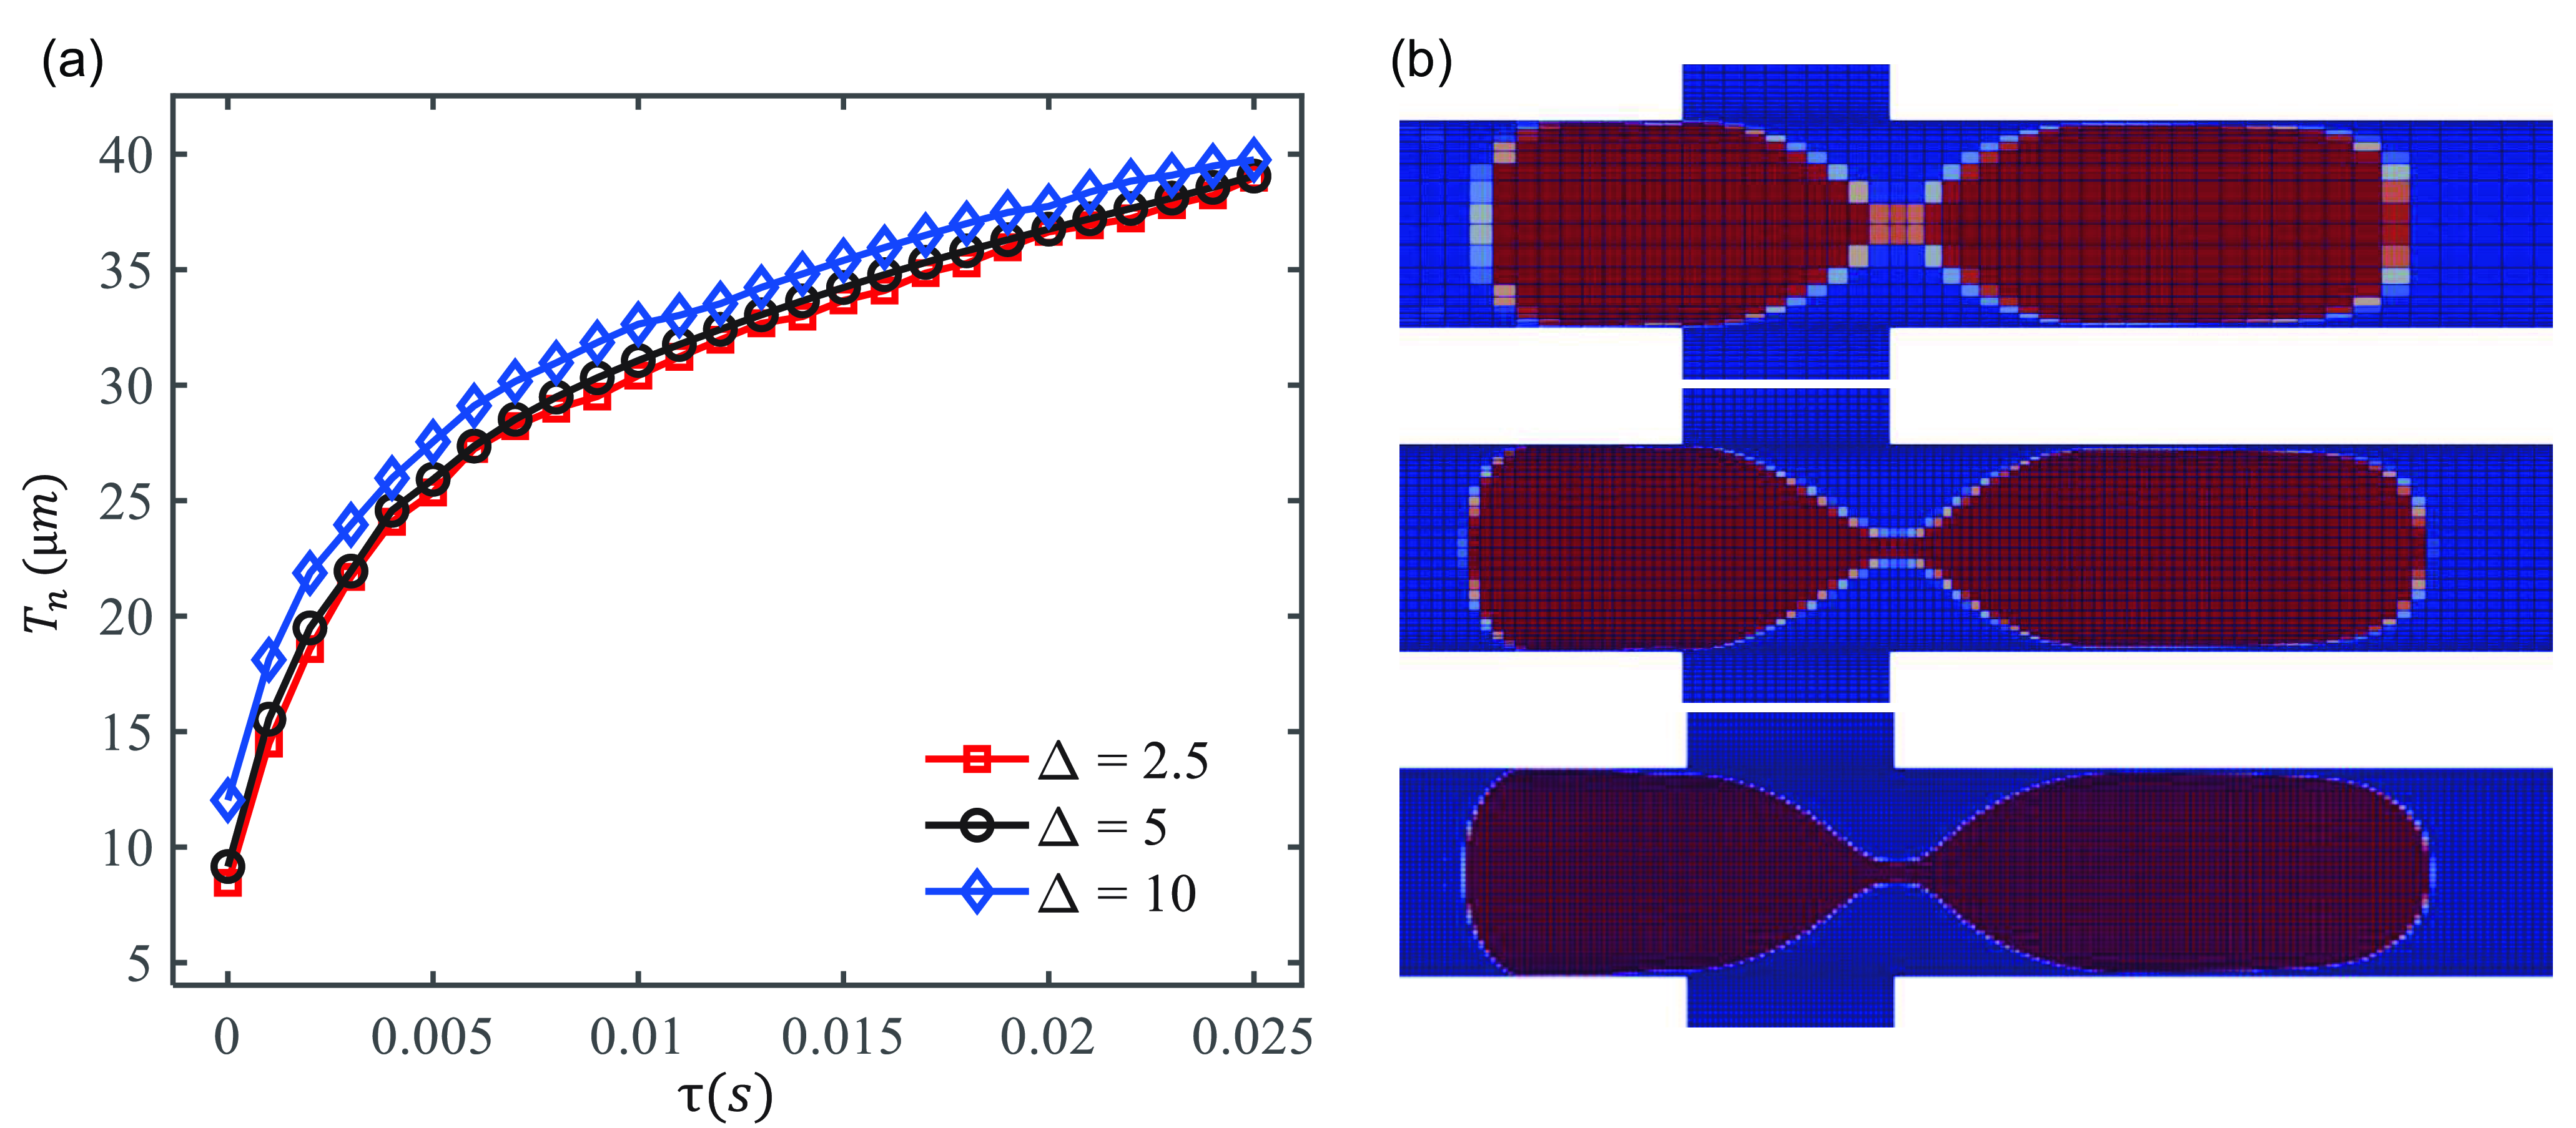
Figure 3. The effect of grid resolutions on (a) the time evolution of $T_n$
and (b) the droplet interface shape near the onset of breakup in a channel with
$T_n$
and (b) the droplet interface shape near the onset of breakup in a channel with $\varepsilon = 1$
.
$\varepsilon = 1$
.
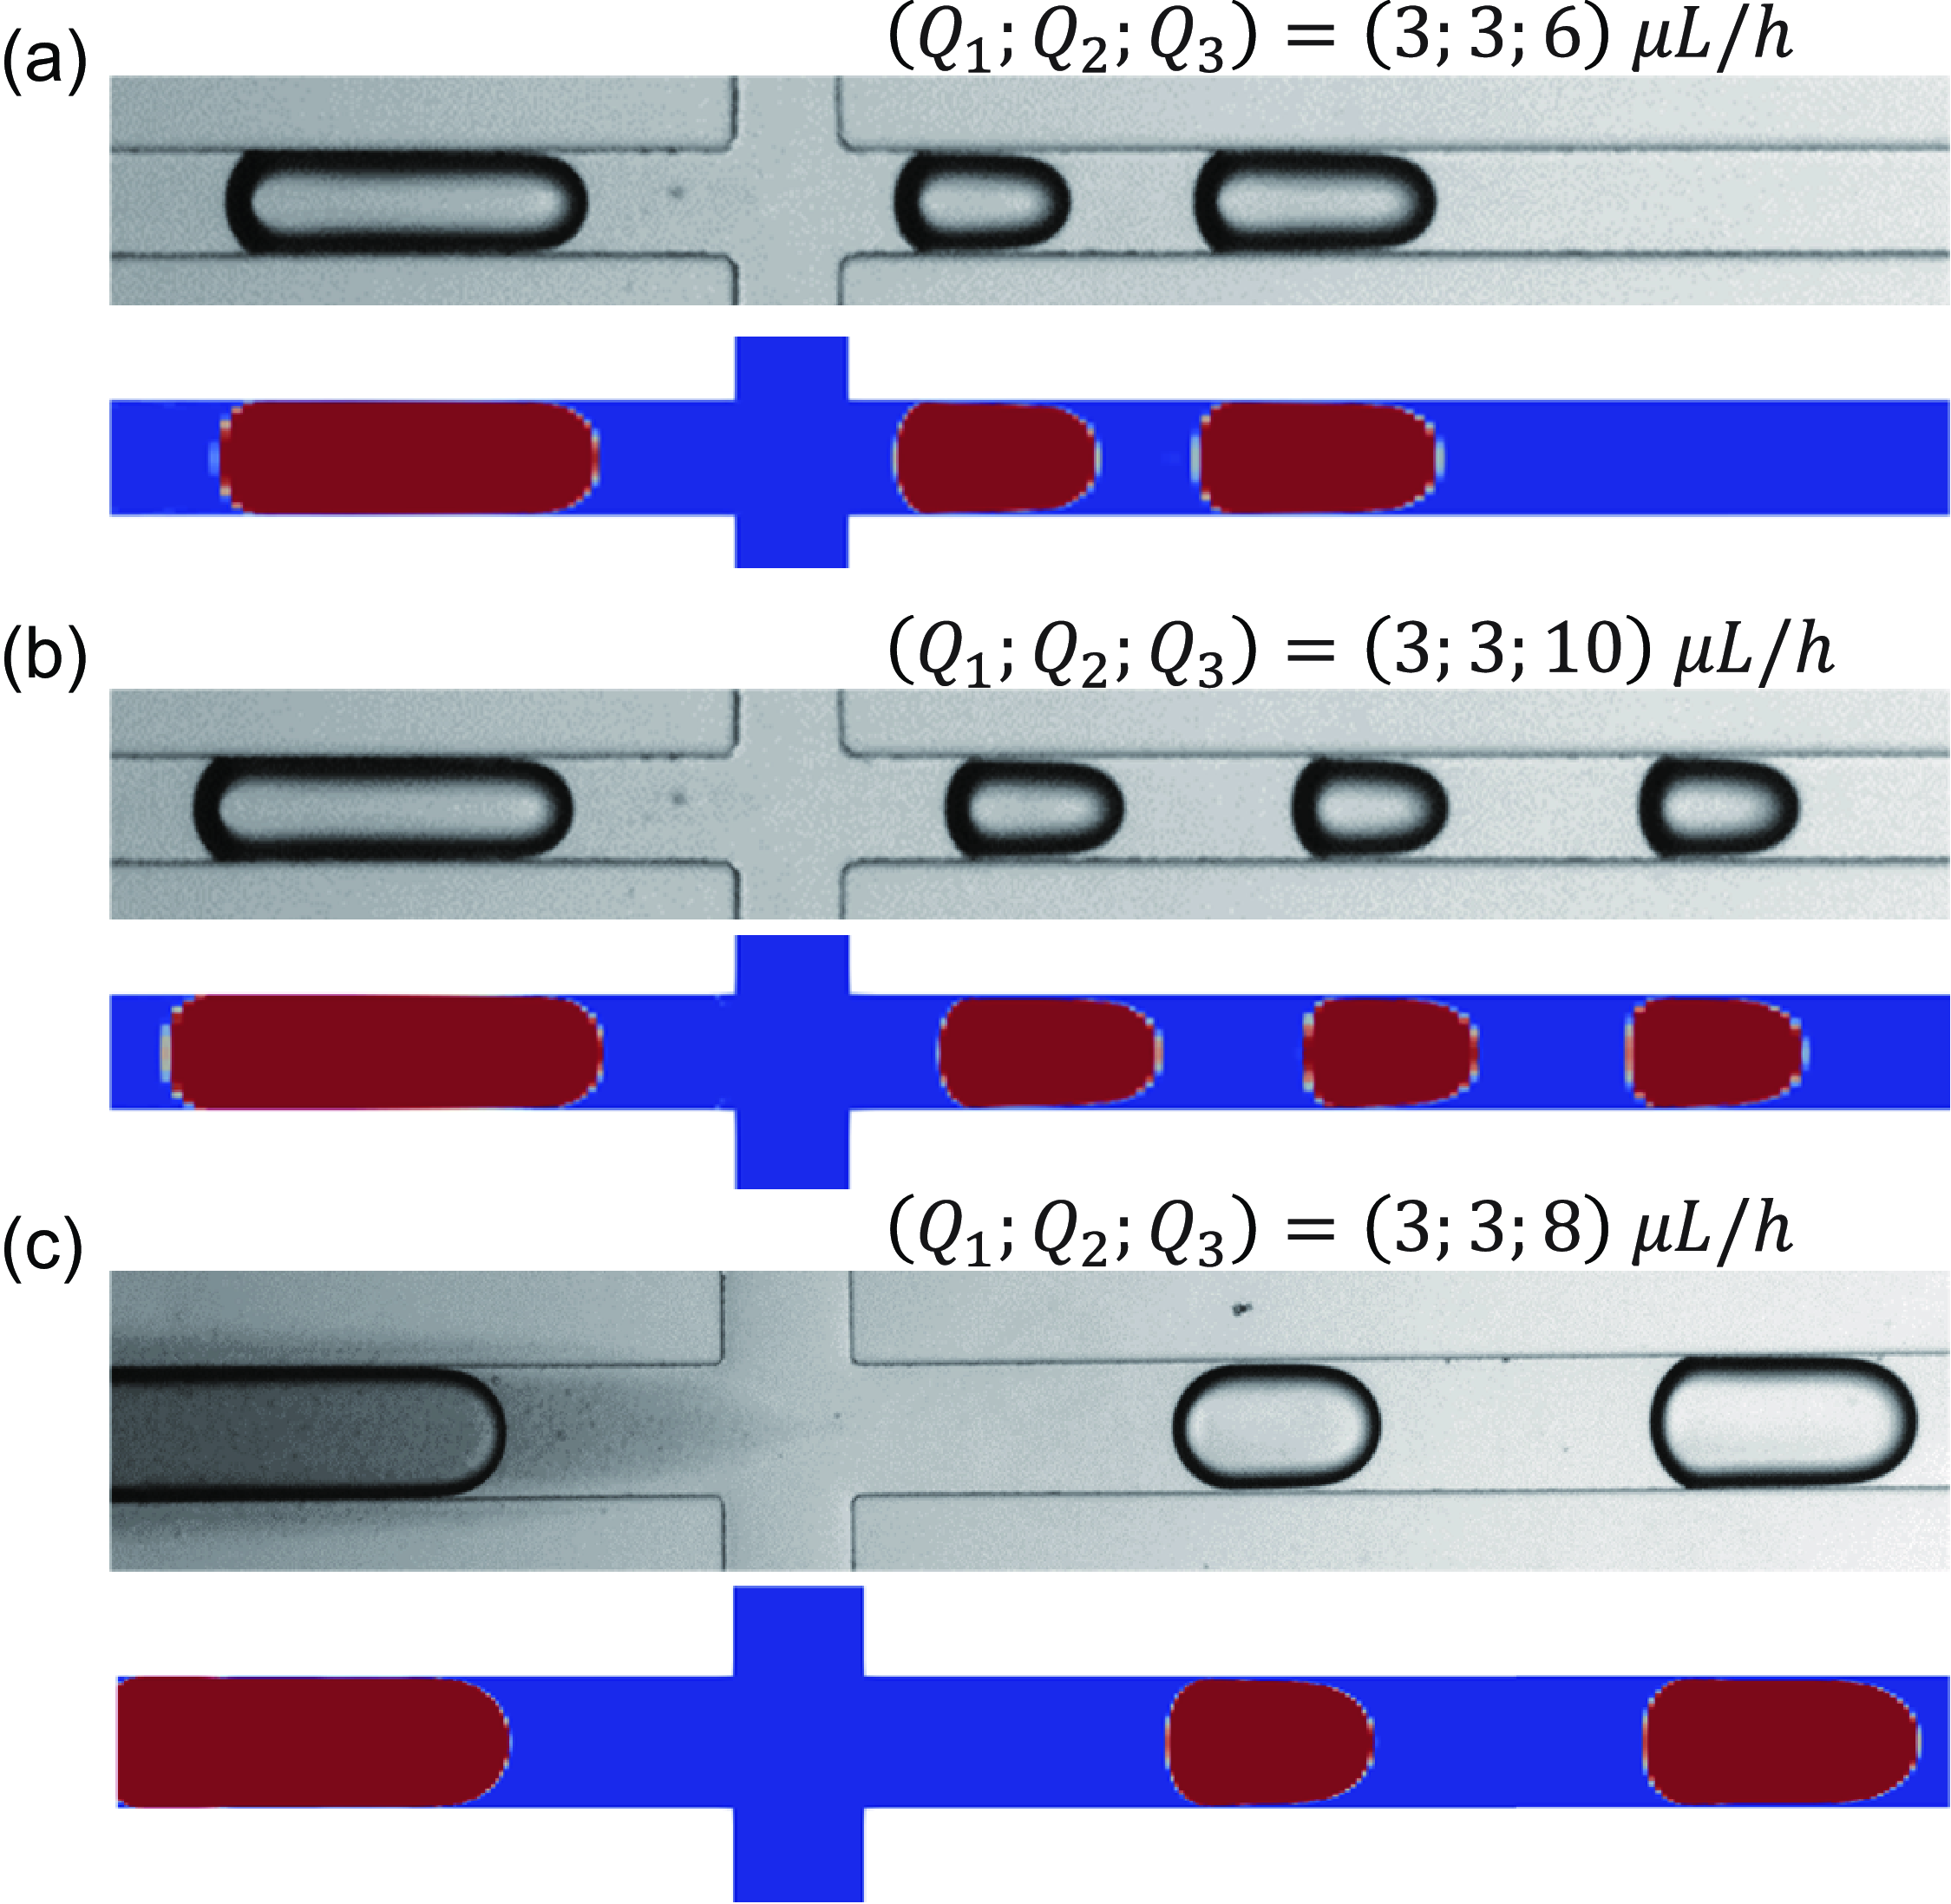
Figure 4. Comparison and validation of numerical simulations and experimental images under different flow rates and channel aspect ratios as follows: (a) $\varepsilon =1$
,
$\varepsilon =1$
, $(Q_1; Q_2; Q_3) = (3; 3; 6) \, \mathrm {\mu l\, h}^{-1}$
; (b)
$(Q_1; Q_2; Q_3) = (3; 3; 6) \, \mathrm {\mu l\, h}^{-1}$
; (b) $\varepsilon =1$
,
$\varepsilon =1$
, $ (Q_1; Q_2; Q_3) = (3; 3; 10) \, \mathrm {\mu l\, h}^{-1}$
; (c)
$ (Q_1; Q_2; Q_3) = (3; 3; 10) \, \mathrm {\mu l\, h}^{-1}$
; (c) $\varepsilon =1/2$
,
$\varepsilon =1/2$
, $(Q_1; Q_2; Q_3) = (3; 3; 8) \, \mathrm {\mu l\, h}^{-1}$
.
$(Q_1; Q_2; Q_3) = (3; 3; 8) \, \mathrm {\mu l\, h}^{-1}$
.
The accuracy of the numerical simulation is validated through experiments, as demonstrated in figure 4. As shown in figure 4(a,b), under varying flow rate conditions, both experimental and simulation results indicate that the droplet transitions from a single breakup to two breakups. Figure 4(a,c) illustrates that by altering the channel aspect ratio, the droplet morphology and breakup position change, with the interface obtained from both experiments and simulations being largely consistent. These results demonstrate that under different flow rates and aspect ratio conditions, the simulation and experimental results align well, confirming the feasibility of the simulation method.
Figure 5. (a) Half the minimum thickness and (b) principal mean radii of curvature at the neck centre.
2.3. Neck radius measurement
To accurately describe the three-dimensional deformation characteristics of the neck, it is necessary to measure the mean radius of curvature $R_m$
at the neck centre. According to the Young–Laplace equation,
$R_m$
at the neck centre. According to the Young–Laplace equation, $R_m$
is related to the two principal radii of curvature
$R_m$
is related to the two principal radii of curvature $R_1$
and
$R_1$
and $R_2$
by the relation
$R_2$
by the relation $R_m = R_1 R_2\left /(R_1+R_2\right)$
. As shown in figure 5, in the numerical simulation, a horizontal section perpendicular to the Z axis is taken at the position of half of the channel height, intersecting the droplet interface to form a curve. The coordinates of the thinnest point at the neck centre along this curve are identified. A plane perpendicular to the Y axis is drawn through this point, intersecting the interface to obtain the curve of the cross-section. The mean radius of curvature at the intersection points of these two curves corresponds to the two principal radii of curvature
$R_m = R_1 R_2\left /(R_1+R_2\right)$
. As shown in figure 5, in the numerical simulation, a horizontal section perpendicular to the Z axis is taken at the position of half of the channel height, intersecting the droplet interface to form a curve. The coordinates of the thinnest point at the neck centre along this curve are identified. A plane perpendicular to the Y axis is drawn through this point, intersecting the interface to obtain the curve of the cross-section. The mean radius of curvature at the intersection points of these two curves corresponds to the two principal radii of curvature $R_1$
and
$R_1$
and $R_2$
at the neck centre, reflecting the evolution characteristics of the neck during the breakup of the confined droplet. The curves of the horizontal section and cross-section can be fitted into polynomial functions
$R_2$
at the neck centre, reflecting the evolution characteristics of the neck during the breakup of the confined droplet. The curves of the horizontal section and cross-section can be fitted into polynomial functions $f$
, and the radius of curvature at the measurement point is given by
$f$
, and the radius of curvature at the measurement point is given by $(1+\dot {f}^2)^{3 / 2} / \ddot {f}$
. In the experiment, high-speed imaging of droplet deformation is used to extract the curve of the horizontal section, and the thickness at the neck centre is determined by calculating the shortest distance along two curves, where
$(1+\dot {f}^2)^{3 / 2} / \ddot {f}$
. In the experiment, high-speed imaging of droplet deformation is used to extract the curve of the horizontal section, and the thickness at the neck centre is determined by calculating the shortest distance along two curves, where $T_n$
represents half of the thickness.
$T_n$
represents half of the thickness.
3. Results and discussion
3.1. Flow patterns
In microfluidic channels, continuous droplets are generated at the first flow-focusing junction and experience deformation or breakup at the second flow-focusing junction. As shown in figure 6, with $Q_1$
and
$Q_1$
and $Q_2$
fixed and
$Q_2$
fixed and $Q_3$
varied, distinct flow patterns are observed in rectangular channels with different aspect ratios. The capillary number, defined based on the droplet flow and relevant physical parameters, is expressed as
$Q_3$
varied, distinct flow patterns are observed in rectangular channels with different aspect ratios. The capillary number, defined based on the droplet flow and relevant physical parameters, is expressed as $Ca = \mu _{water}\left (Q_1 + Q_2\right) / (wh\sigma)$
. The capillary numbers for channel aspect ratios of
$Ca = \mu _{water}\left (Q_1 + Q_2\right) / (wh\sigma)$
. The capillary numbers for channel aspect ratios of $\varepsilon = 1$
,
$\varepsilon = 1$
, $1/2$
and
$1/2$
and $1/3$
are
$1/3$
are $3.88 \times 10^{-4}$
,
$3.88 \times 10^{-4}$
, $1.94 \times 10^{-4}$
and
$1.94 \times 10^{-4}$
and $1.29 \times 10^{-4}$
, respectively.
$1.29 \times 10^{-4}$
, respectively.
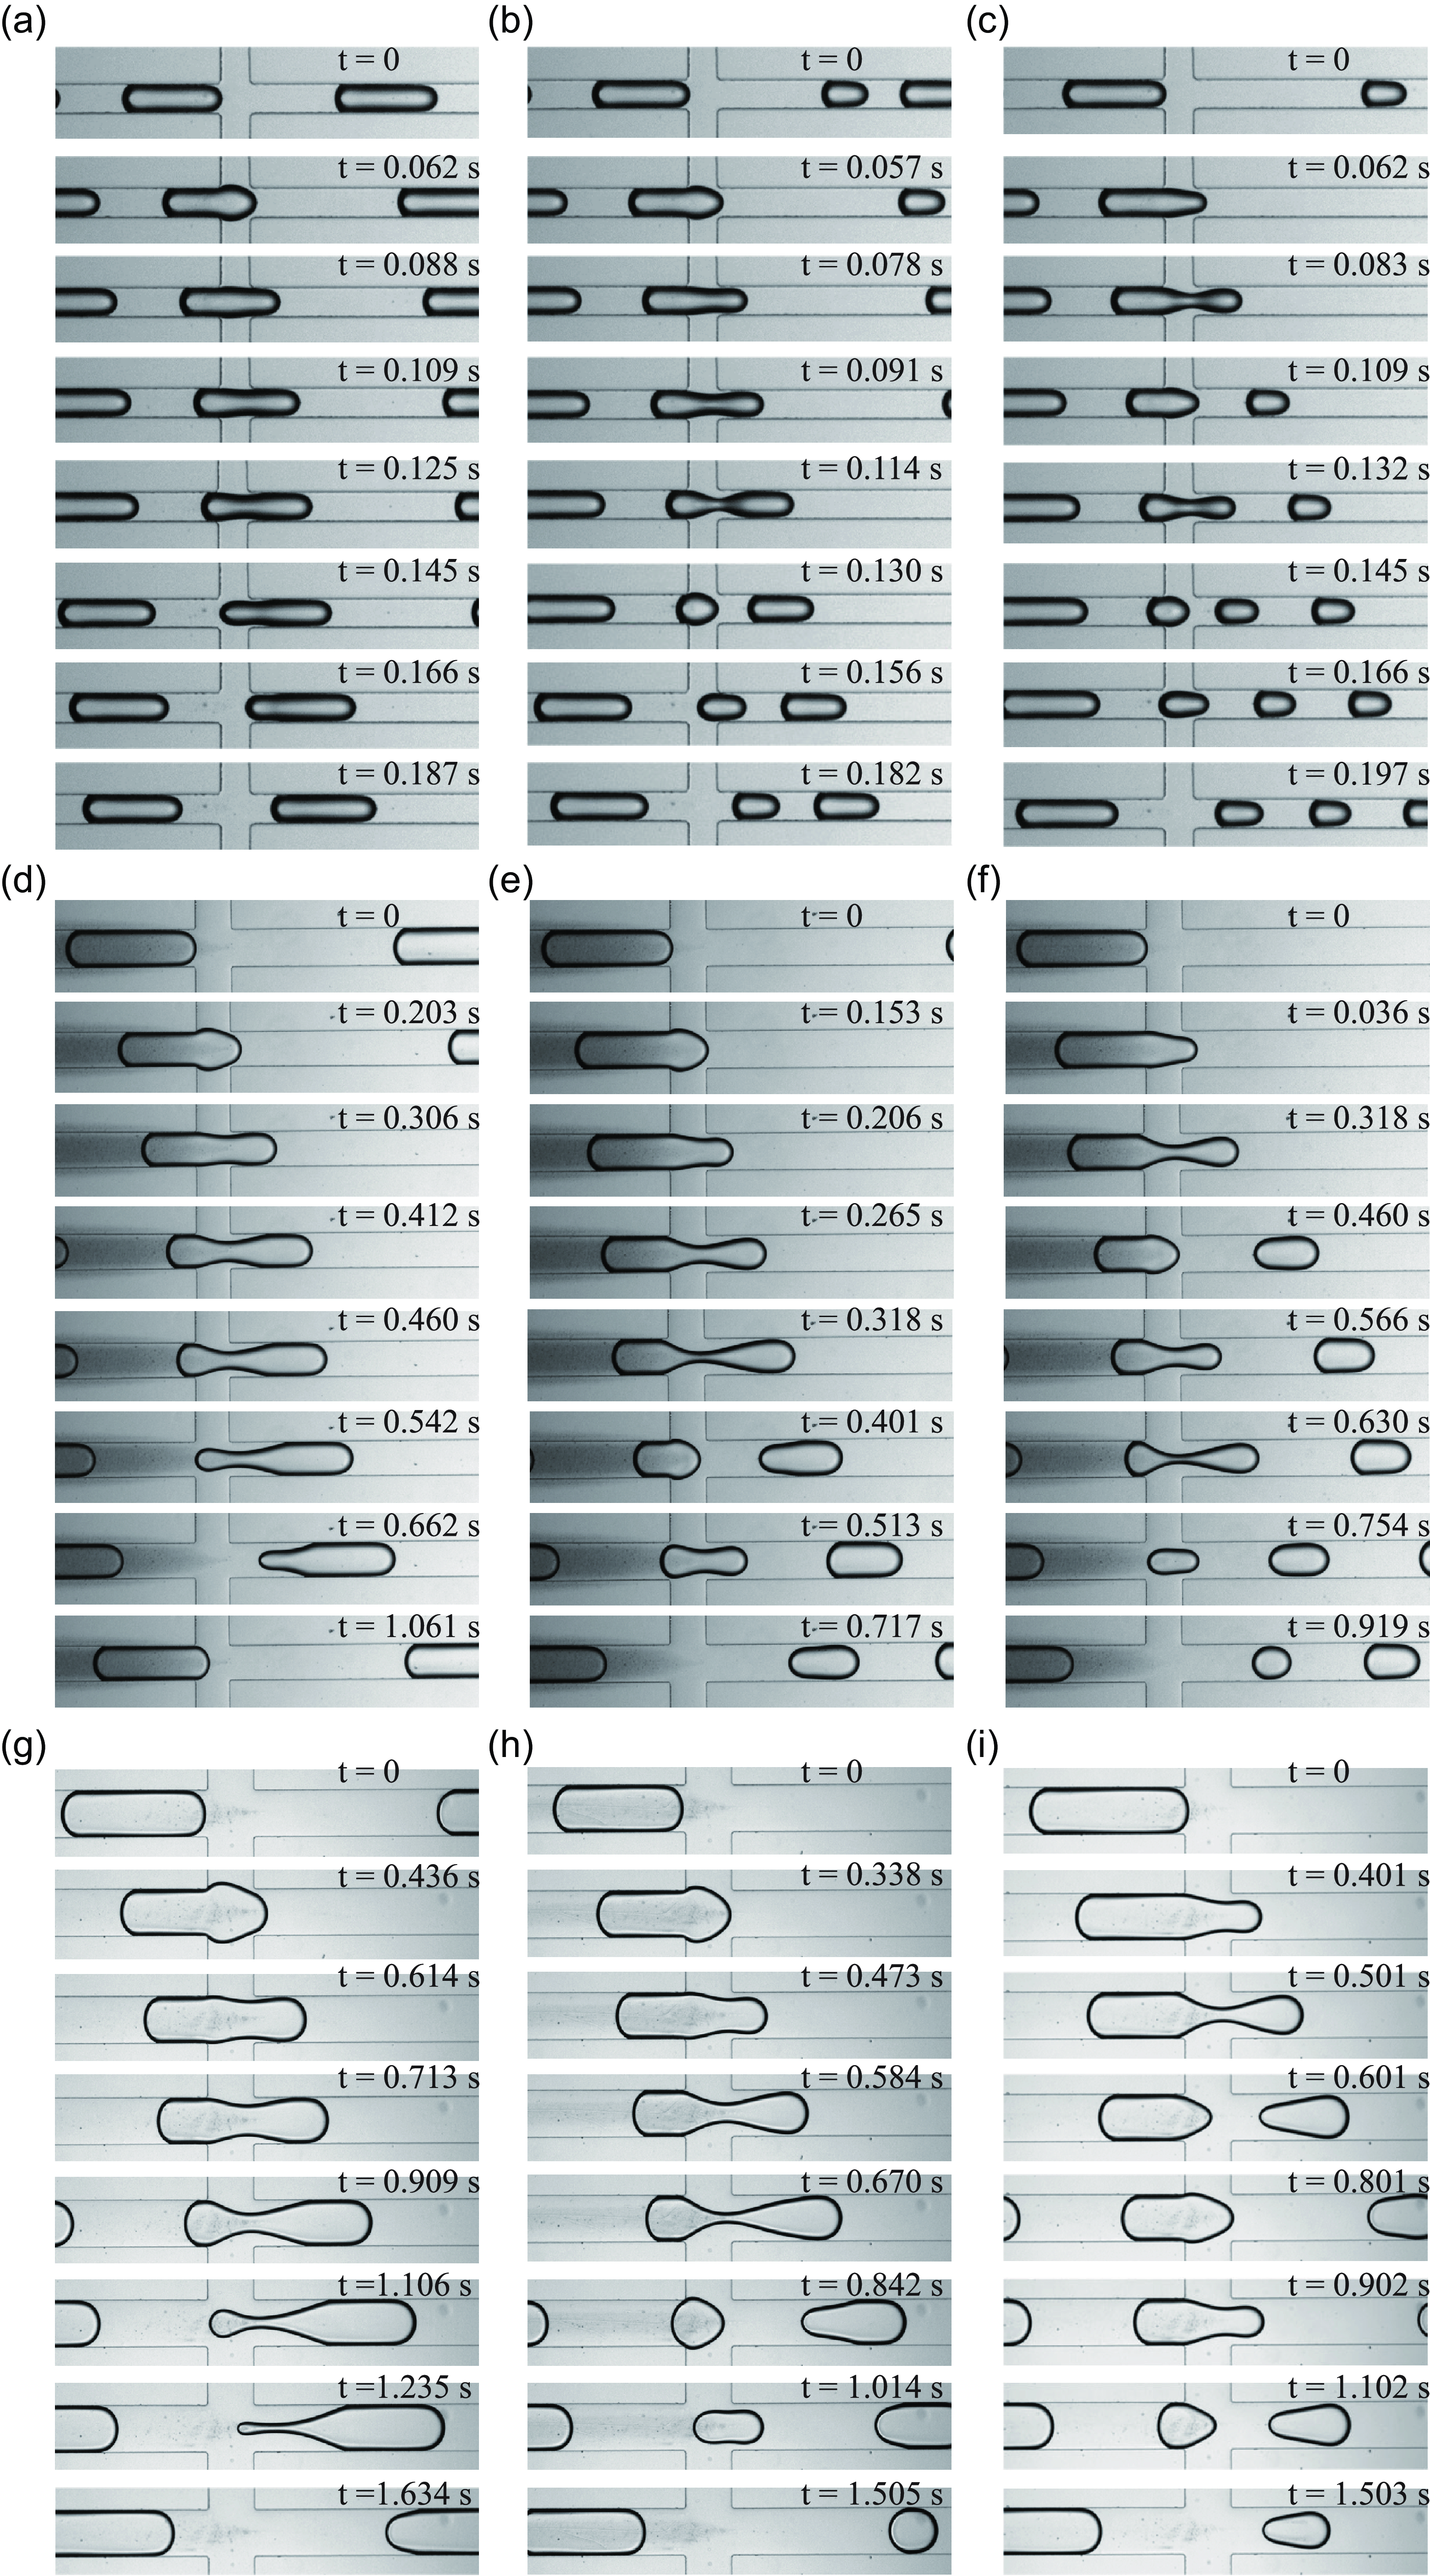
Figure 6. The three flow patterns of the droplet in channels with different aspect ratios. The flow rates and channel aspect ratios are as follows: $Q_1$
=
$Q_1$
= $Q_2$
= 30 μl h−1; and for
$Q_2$
= 30 μl h−1; and for $\varepsilon = 1$
,
$\varepsilon = 1$
, $Q_3$
corresponds to (a) 30, (b) 60 and (c) 100 μl h−1, for
$Q_3$
corresponds to (a) 30, (b) 60 and (c) 100 μl h−1, for $\varepsilon = 1/2$
,
$\varepsilon = 1/2$
, $Q_3$
corresponds to (d) 30, (e) 80 and (f) 140 μl h−1 and for
$Q_3$
corresponds to (d) 30, (e) 80 and (f) 140 μl h−1 and for $\varepsilon = 1/3$
,
$\varepsilon = 1/3$
, $Q_3$
corresponds to (g) 40, (h) 100 and (i) 160 μl h−1.
$Q_3$
corresponds to (g) 40, (h) 100 and (i) 160 μl h−1.
Figures 6(a)–6(c) show the three flow patterns of droplets for $\varepsilon = 1$
, corresponding to no breakup, single breakup and multiple breakups, respectively. In figure 6(a), at
$\varepsilon = 1$
, corresponding to no breakup, single breakup and multiple breakups, respectively. In figure 6(a), at $t = 0$
s, a small front portion of the droplet reaches the left boundary of the second junction. Due to the absence of wall constraints, this portion slightly swells at
$t = 0$
s, a small front portion of the droplet reaches the left boundary of the second junction. Due to the absence of wall constraints, this portion slightly swells at $t = 0.062$
s but soon returns to a hemispherical shape under the compression of the continuous phase. As the droplet advances, at
$t = 0.062$
s but soon returns to a hemispherical shape under the compression of the continuous phase. As the droplet advances, at $t = 0.088$
s, the small front portion enters the downstream channel, and the neck region gradually undergoes necking. At
$t = 0.088$
s, the small front portion enters the downstream channel, and the neck region gradually undergoes necking. At $t = 0.125$
s, the rear end of the droplet is about to detach from the channel wall, although the thread has not yet broken. Subsequently, the rear end of the droplet progressively recovers its original shape as it moves downstream. In figure 6(b), the shape evolution is similar to that in figure 6(a) before
$t = 0.125$
s, the rear end of the droplet is about to detach from the channel wall, although the thread has not yet broken. Subsequently, the rear end of the droplet progressively recovers its original shape as it moves downstream. In figure 6(b), the shape evolution is similar to that in figure 6(a) before $t = 0.091$
s. The neck of the droplet contains more continuous-phase volume, and the degree of indentation is more pronounced at
$t = 0.091$
s. The neck of the droplet contains more continuous-phase volume, and the degree of indentation is more pronounced at $t = 0.114$
s. Afterward, the droplet breaks into two daughter droplets under surface tension: the first daughter droplet and the second daughter droplet. In figure 6(c), with the dispersed-phase flow rate remaining constant and the continuous-phase flow rate increasing, the necking time of the droplet decreases. At
$t = 0.114$
s. Afterward, the droplet breaks into two daughter droplets under surface tension: the first daughter droplet and the second daughter droplet. In figure 6(c), with the dispersed-phase flow rate remaining constant and the continuous-phase flow rate increasing, the necking time of the droplet decreases. At $t = 0.083$
s, a pronounced indentation forms in the neck region of the droplet. The first breakup occurs, resulting in a smaller first daughter droplet and a larger second daughter droplet. By
$t = 0.083$
s, a pronounced indentation forms in the neck region of the droplet. The first breakup occurs, resulting in a smaller first daughter droplet and a larger second daughter droplet. By $t = 0.132$
s, the second daughter droplet passes through the junction, where the neck region indents again, leading to the breakup of the second daughter droplet into two additional daughter droplets. In figure 6(d–f), for
$t = 0.132$
s, the second daughter droplet passes through the junction, where the neck region indents again, leading to the breakup of the second daughter droplet into two additional daughter droplets. In figure 6(d–f), for $\varepsilon = 1/2$
, the droplet deformation process and flow regimes are consistent with those observed for
$\varepsilon = 1/2$
, the droplet deformation process and flow regimes are consistent with those observed for $\varepsilon = 1$
. In figure 6(d), at
$\varepsilon = 1$
. In figure 6(d), at $t = 0.460$
s, the rear end of the droplet is about to detach from the channel wall. The degree of indentation at the neck is more pronounced than that of the corresponding droplet in figure 6(a). The droplet does not break; instead, the rear end initially forms a stretched, thin-neck structure before gradually recovering. In figure 6(e), at
$t = 0.460$
s, the rear end of the droplet is about to detach from the channel wall. The degree of indentation at the neck is more pronounced than that of the corresponding droplet in figure 6(a). The droplet does not break; instead, the rear end initially forms a stretched, thin-neck structure before gradually recovering. In figure 6(e), at $t = 0.206$
s, the small front portion of the droplet has entered the downstream region. Compared with the droplet shape at
$t = 0.206$
s, the small front portion of the droplet has entered the downstream region. Compared with the droplet shape at $t = 0.091$
s in figure 6(b), the small front portion has a narrower radius and is not near the wall. In figure 6(d–f), for
$t = 0.091$
s in figure 6(b), the small front portion has a narrower radius and is not near the wall. In figure 6(d–f), for $\varepsilon = 1/2$
, the droplet deformation process resembles that of
$\varepsilon = 1/2$
, the droplet deformation process resembles that of $\varepsilon = 1$
, exhibiting the same three flow patterns: no breakup, single breakup and multiple breakups. In figure 6(d), at
$\varepsilon = 1$
, exhibiting the same three flow patterns: no breakup, single breakup and multiple breakups. In figure 6(d), at $t = 0.542$
s, the rear of the droplet forms a stretched thin-neck structure, with more pronounced deformation compared with the droplet shape at
$t = 0.542$
s, the rear of the droplet forms a stretched thin-neck structure, with more pronounced deformation compared with the droplet shape at $t = 0.145$
s in figure 6(a). In figure 6(e), at
$t = 0.145$
s in figure 6(a). In figure 6(e), at $t = 0.318$
s, the thinnest point of the droplet neck is located near the right continuous-phase channel wall, and the neck deformation is not entirely symmetric relative to the axis perpendicular to the flow direction at its thinnest location. In figure 6(g–i), for
$t = 0.318$
s, the thinnest point of the droplet neck is located near the right continuous-phase channel wall, and the neck deformation is not entirely symmetric relative to the axis perpendicular to the flow direction at its thinnest location. In figure 6(g–i), for $\varepsilon = 1/3$
, the droplet deformation is similar to that observed in the previous two aspect ratio channels, again corresponding to the three flow patterns. In figure 6(g), at
$\varepsilon = 1/3$
, the droplet deformation is similar to that observed in the previous two aspect ratio channels, again corresponding to the three flow patterns. In figure 6(g), at $t = 1.235$
s, the deformation at the rear of the droplet is more pronounced than in the previous two channels, and the droplet assumes an approximate ‘paddle’ shape. In figure 6(h), at
$t = 1.235$
s, the deformation at the rear of the droplet is more pronounced than in the previous two channels, and the droplet assumes an approximate ‘paddle’ shape. In figure 6(h), at $t = 0.670$
s, the asymmetry of the droplet neck shape becomes more evident. Additionally, the deformation of the daughter droplet tail after the breakup is more pronounced at
$t = 0.670$
s, the asymmetry of the droplet neck shape becomes more evident. Additionally, the deformation of the daughter droplet tail after the breakup is more pronounced at $t = 0.842$
s in figure 6(h) and at
$t = 0.842$
s in figure 6(h) and at $t = 1.102$
s in figure 6(g).
$t = 1.102$
s in figure 6(g).
3.2. Regime diagrams
The droplet length generated at the first junction and its flow pattern at the second junction are affected by $Q_1$
,
$Q_1$
, $Q_2$
and
$Q_2$
and $Q_3$
. To quantify their impact on the initial droplet length and flow pattern, two dimensionless numbers related to
$Q_3$
. To quantify their impact on the initial droplet length and flow pattern, two dimensionless numbers related to $Q_3$
are introduced: as defined in the works of Cubaud (Reference Cubaud2009) and Cubaud et al. (Reference Cubaud, Jose, Darvishi and Sun2012), one is the volume fraction of side-flow at the second junction,
$Q_3$
are introduced: as defined in the works of Cubaud (Reference Cubaud2009) and Cubaud et al. (Reference Cubaud, Jose, Darvishi and Sun2012), one is the volume fraction of side-flow at the second junction, $\mathrm {\varphi } = Q_3 /(Q_1+Q_2+Q_3)$
, and the other is the capillary number,
$\mathrm {\varphi } = Q_3 /(Q_1+Q_2+Q_3)$
, and the other is the capillary number, $Ca_3 = \mu _{oil} Q_3 / (wh\sigma)$
. The droplet length is non-dimensionalised by the channel width, and the regime diagram for different channel aspect ratios is shown in figure 7. As
$Ca_3 = \mu _{oil} Q_3 / (wh\sigma)$
. The droplet length is non-dimensionalised by the channel width, and the regime diagram for different channel aspect ratios is shown in figure 7. As $\varphi Ca_3$
increases, the transition boundary between different flow patterns follows a specific trend. Two transition boundaries exist between the three flow patterns, and
$\varphi Ca_3$
increases, the transition boundary between different flow patterns follows a specific trend. Two transition boundaries exist between the three flow patterns, and $l/w$
decreases as
$l/w$
decreases as $\varphi Ca_3$
increases. Following the transition curve equation proposed by Cubaud (Reference Cubaud2009) for different pattern transitions, the transition boundaries here can also be fitted to an approximate curve of
$\varphi Ca_3$
increases. Following the transition curve equation proposed by Cubaud (Reference Cubaud2009) for different pattern transitions, the transition boundaries here can also be fitted to an approximate curve of $l/w = a(\varphi Ca_3)^{b}$
. The value of exponent
$l/w = a(\varphi Ca_3)^{b}$
. The value of exponent $b$
is approximately
$b$
is approximately $-0.3$
, which agrees with the findings in Cubaud et al. (Reference Cubaud, Jose, Darvishi and Sun2012) where the value of exponent
$-0.3$
, which agrees with the findings in Cubaud et al. (Reference Cubaud, Jose, Darvishi and Sun2012) where the value of exponent $b$
is determined through the study of droplet breakup and no-breakup regions under different viscosity ratios. The coefficient
$b$
is determined through the study of droplet breakup and no-breakup regions under different viscosity ratios. The coefficient $a$
is related to the channel’s aspect ratio and flow regime. Within a channel with the same aspect ratio, the coefficient
$a$
is related to the channel’s aspect ratio and flow regime. Within a channel with the same aspect ratio, the coefficient $a$
between the no-breakup and single-breakup regimes is smaller than that between the single- and multiple-breakup regimes. Across channels with different aspect ratios, the value of coefficient
$a$
between the no-breakup and single-breakup regimes is smaller than that between the single- and multiple-breakup regimes. Across channels with different aspect ratios, the value of coefficient $a$
in the pattern transition curve decreases as
$a$
in the pattern transition curve decreases as $\varepsilon$
decreases.
$\varepsilon$
decreases.
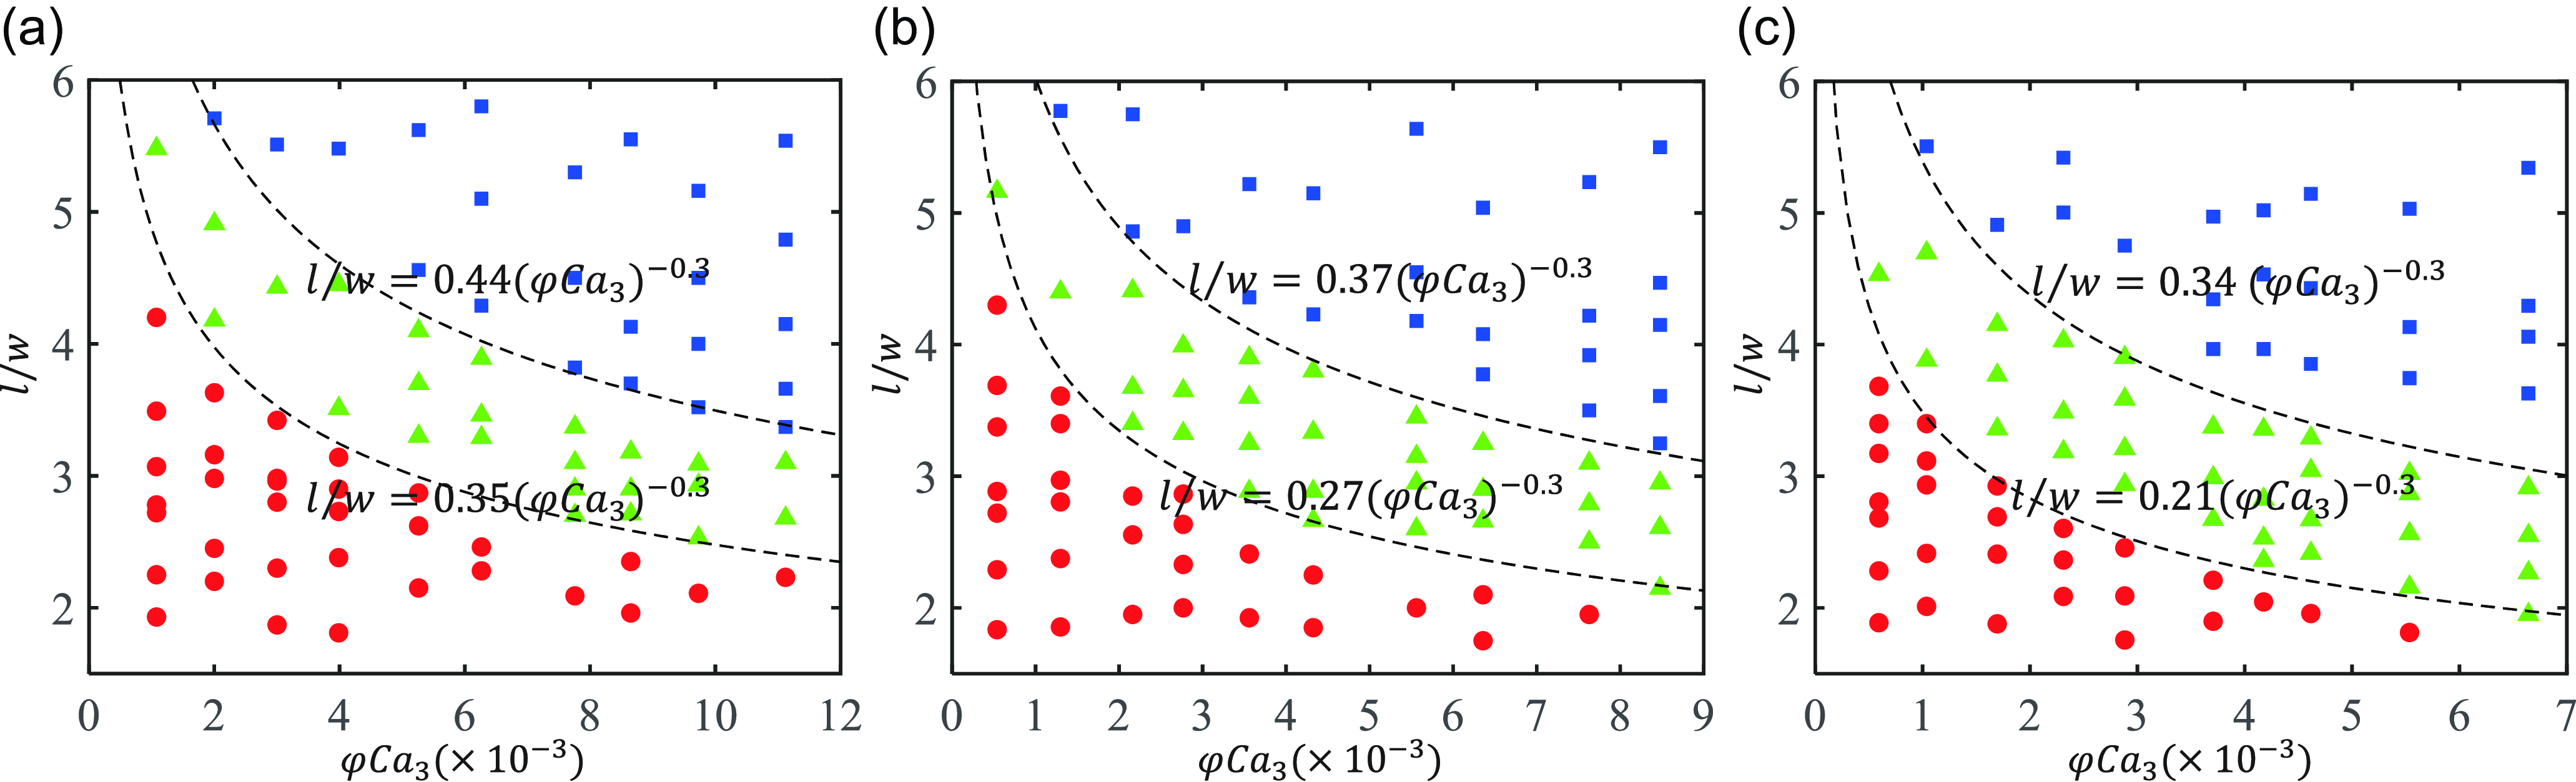
Figure 7. Regime diagrams of the flowing droplet in microfluidic channels with different aspect ratios corresponding to (a) $\varepsilon$
= 1, (b)
$\varepsilon$
= 1, (b) $\varepsilon$
= 1/2 and (c)
$\varepsilon$
= 1/2 and (c) $\varepsilon$
= 1/3. The three flow regimes – no breakup, single breakup and multiple breakups – are marked with red circles, green triangles and blue squares, respectively.
$\varepsilon$
= 1/3. The three flow regimes – no breakup, single breakup and multiple breakups – are marked with red circles, green triangles and blue squares, respectively.
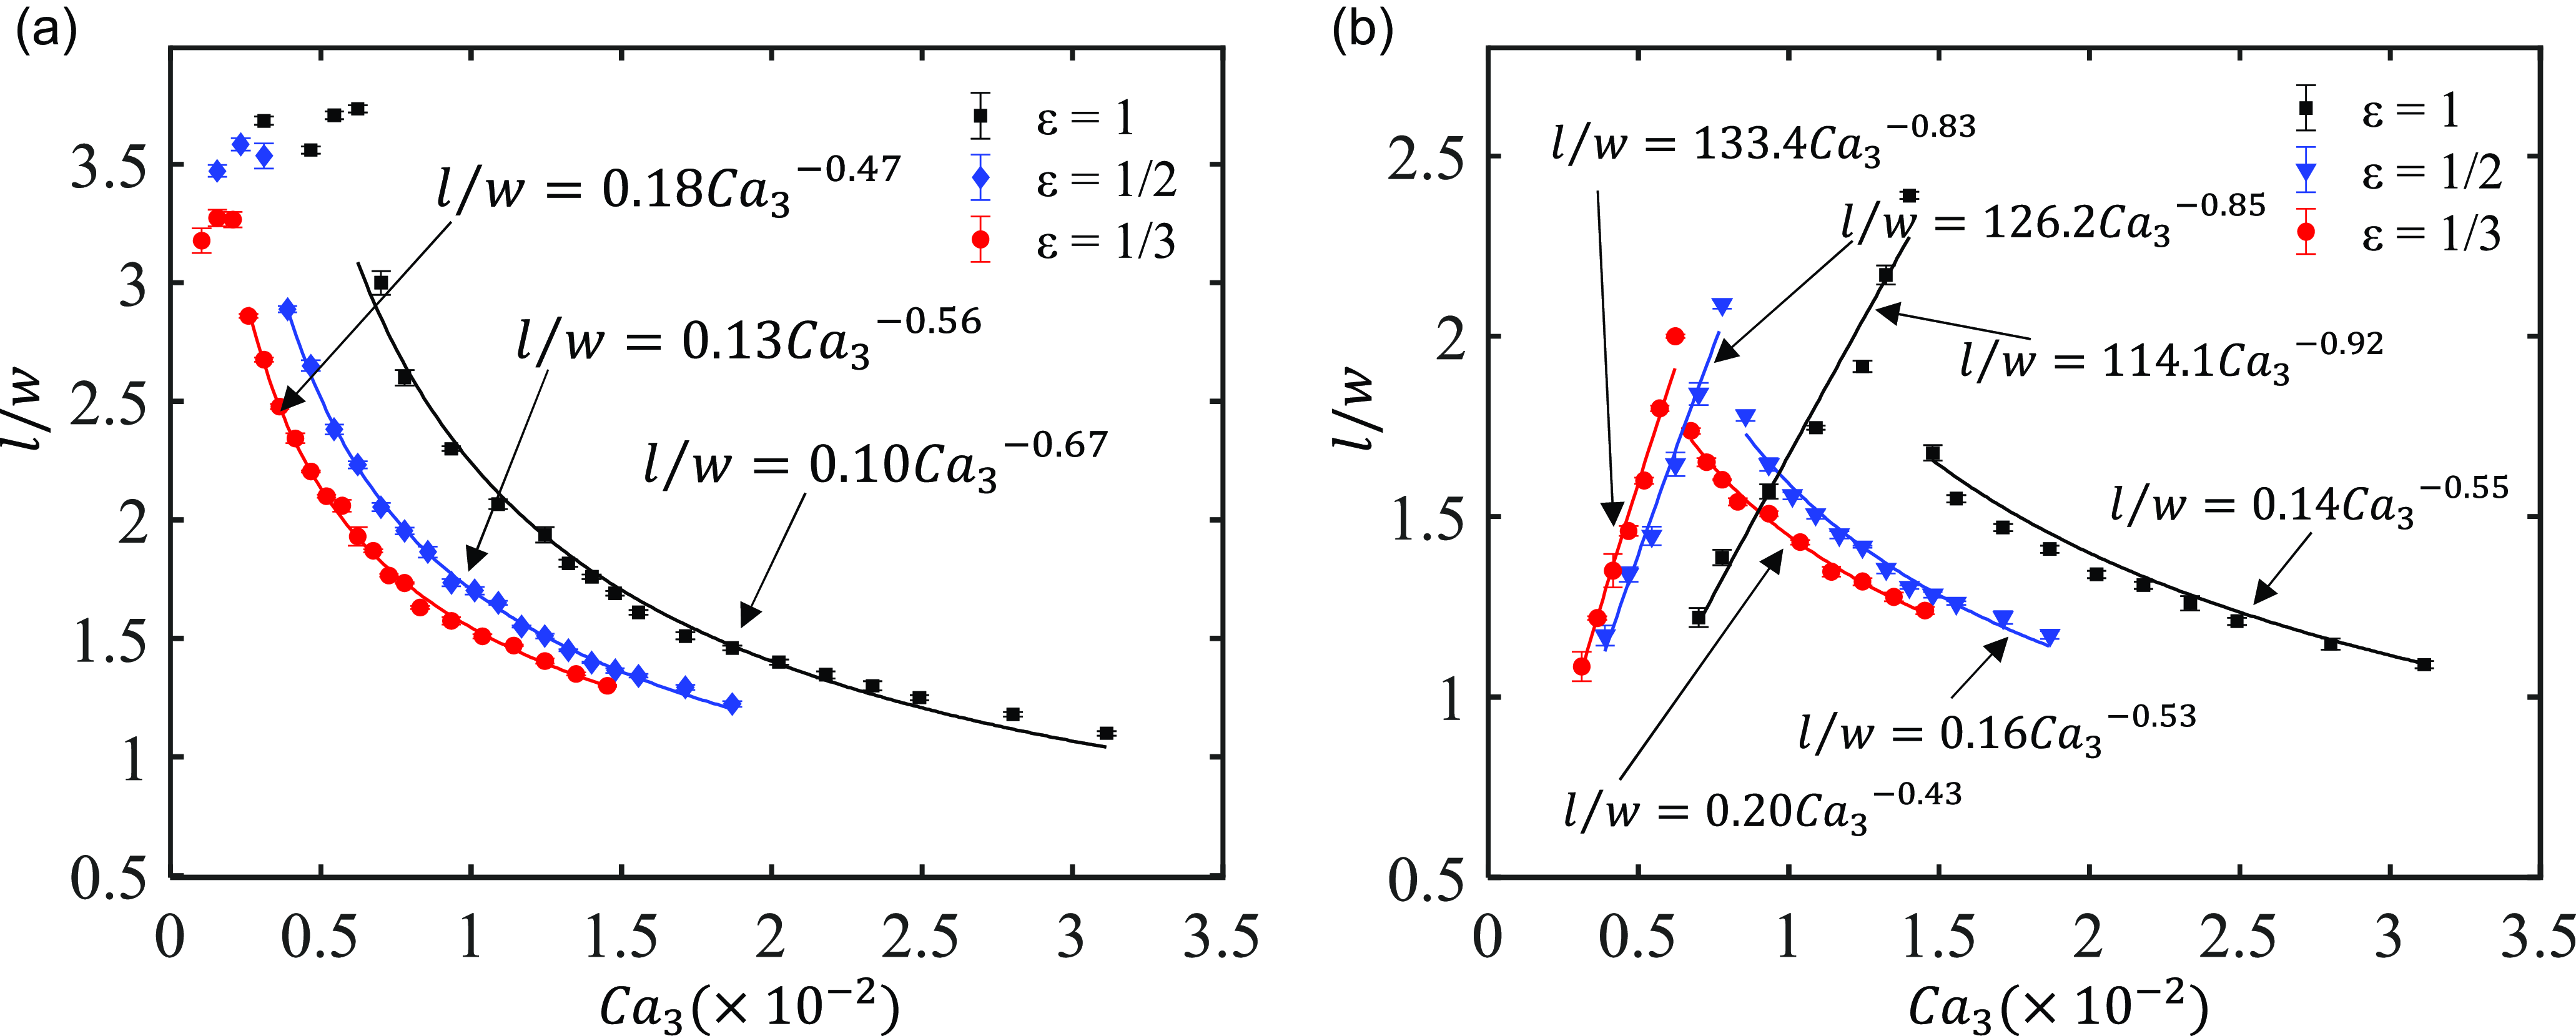
Figure 8. Variation in daughter droplet length at different $Ca_3$
values with fixed
$Ca_3$
values with fixed $Q_1$
and
$Q_1$
and $Q_2$
: (a) first daughter droplet; (b) second daughter droplet.
$Q_2$
: (a) first daughter droplet; (b) second daughter droplet.
By increasing the flow rate of $Q_3$
, a significant impact on the breakup behaviour of the droplet can be observed. Under certain conditions, the droplet splits into multiple daughter droplets. Normalising the daughter droplet length by the channel width (
$Q_3$
, a significant impact on the breakup behaviour of the droplet can be observed. Under certain conditions, the droplet splits into multiple daughter droplets. Normalising the daughter droplet length by the channel width ( $w$
) establishes an approximate power-law relationship with the capillary number
$w$
) establishes an approximate power-law relationship with the capillary number $Ca_3$
. Figure 8 illustrates the variation in the lengths of the first and second daughter droplets under different channel aspect ratios, achieved by varying the flow rate of
$Ca_3$
. Figure 8 illustrates the variation in the lengths of the first and second daughter droplets under different channel aspect ratios, achieved by varying the flow rate of $Q_3$
while keeping
$Q_3$
while keeping $Q_1$
and
$Q_1$
and $Q_2$
constant. In figure 8(a), the unfitted initial data points correspond to the cases where
$Q_2$
constant. In figure 8(a), the unfitted initial data points correspond to the cases where $Ca_3$
is relatively low and no breakup occurs in the droplet. For comparison purposes, these cases are also considered as the first daughter droplet. As
$Ca_3$
is relatively low and no breakup occurs in the droplet. For comparison purposes, these cases are also considered as the first daughter droplet. As $Ca_3$
increases, a single droplet in the channel splits into two daughter droplets in channels with different aspect ratios. The reduction in the length of the first daughter droplet indicates that the first breakup point progressively moves towards the front end of the droplet as
$Ca_3$
increases, a single droplet in the channel splits into two daughter droplets in channels with different aspect ratios. The reduction in the length of the first daughter droplet indicates that the first breakup point progressively moves towards the front end of the droplet as $Q_3$
increases. The ratio of the length of the first daughter droplet to the channel width (
$Q_3$
increases. The ratio of the length of the first daughter droplet to the channel width ( $l/w$
) follows the relationship
$l/w$
) follows the relationship $l/w = m Ca_3^n$
. As
$l/w = m Ca_3^n$
. As $\varepsilon$
decreases, the value of coefficient
$\varepsilon$
decreases, the value of coefficient $m$
increases while the exponent
$m$
increases while the exponent $n$
decreases. In figure 8(b), the length of the second daughter droplet can be divided into two stages: an increasing stage and a decreasing stage. Both stages can be fitted to the relationship
$n$
decreases. In figure 8(b), the length of the second daughter droplet can be divided into two stages: an increasing stage and a decreasing stage. Both stages can be fitted to the relationship $l/w = m Ca_3^n$
. During the increasing stage, as the volume of the droplet remains constant, the length of the second daughter droplet increases correspondingly as the volume of the first daughter droplet decreases. As
$l/w = m Ca_3^n$
. During the increasing stage, as the volume of the droplet remains constant, the length of the second daughter droplet increases correspondingly as the volume of the first daughter droplet decreases. As $\varepsilon$
decreases, the value of coefficient
$\varepsilon$
decreases, the value of coefficient $m$
increases while the exponent
$m$
increases while the exponent $n$
decreases. At the turning point, the droplet undergoes a second breakup, marking the transition into the multiple-breakups pattern. During the decreasing stage, the length of the second daughter droplet follows a similar trend to that of the first daughter droplet. Furthermore, under the same flow conditions, the daughter droplet produced by the channel with an aspect ratio of less than 1 is shorter than that in the channel with an aspect ratio equal to 1, and the breakup point is near to the front end of the droplet. This suggests that droplets are more likely to break up in channels with smaller aspect ratios.
$n$
decreases. At the turning point, the droplet undergoes a second breakup, marking the transition into the multiple-breakups pattern. During the decreasing stage, the length of the second daughter droplet follows a similar trend to that of the first daughter droplet. Furthermore, under the same flow conditions, the daughter droplet produced by the channel with an aspect ratio of less than 1 is shorter than that in the channel with an aspect ratio equal to 1, and the breakup point is near to the front end of the droplet. This suggests that droplets are more likely to break up in channels with smaller aspect ratios.
3.3. Interface evolutions
A high-speed camera is used to capture images of droplet breakup of channels with different aspect ratios. The droplet contour edges are extracted, and the dynamic evolution of $T_n$
at the thinnest point in the centre of the droplet neck is analysed. The thickness
$T_n$
at the thinnest point in the centre of the droplet neck is analysed. The thickness $T_n$
is normalised by
$T_n$
is normalised by $w / 2$
, and
$w / 2$
, and $\tau$
represents the remaining time until droplet breakup, defined as the time difference between the current moment and the breakup moment, and is further normalised by
$\tau$
represents the remaining time until droplet breakup, defined as the time difference between the current moment and the breakup moment, and is further normalised by $w / 2U$
, where
$w / 2U$
, where $U = \left (Q_1 + Q_2\right) / (wh)$
. The normalised
$U = \left (Q_1 + Q_2\right) / (wh)$
. The normalised $T_n$
and
$T_n$
and $\tau$
are represented by
$\tau$
are represented by $\bar {\tau }$
and
$\bar {\tau }$
and $\bar {T}_n$
, respectively. The capillary number depends on the flow rates
$\bar {T}_n$
, respectively. The capillary number depends on the flow rates $Q_1$
and
$Q_1$
and $Q_2$
and is given by
$Q_2$
and is given by $Ca = \mu _{water} U / \sigma$
. In figure 9, the droplet breakup process is divided into two stages, where
$Ca = \mu _{water} U / \sigma$
. In figure 9, the droplet breakup process is divided into two stages, where $\bar {T}_n$
exhibits a power-law behaviour with
$\bar {T}_n$
exhibits a power-law behaviour with $\bar {\tau }^\alpha$
. In figure 9(a), for the case of
$\bar {\tau }^\alpha$
. In figure 9(a), for the case of $\varepsilon = 1$
,
$\varepsilon = 1$
, $\alpha$
in the first stage is smaller than in the second stage, indicating a slower thinning process in the initial phase of neck collapse, followed by an accelerated thinning rate as the droplet enters the free collapse stage, leading to a rapid breakup. When the continuous-phase flow rate
$\alpha$
in the first stage is smaller than in the second stage, indicating a slower thinning process in the initial phase of neck collapse, followed by an accelerated thinning rate as the droplet enters the free collapse stage, leading to a rapid breakup. When the continuous-phase flow rate ${Q}_3$
at the second junction is relatively low, the value of
${Q}_3$
at the second junction is relatively low, the value of $\alpha$
is close to the 0.33 observed by Lu et al. (Reference Lu, Fu, Zhu, Ma and Li2013) in the first stage of bubble collapse, which is caused by droplet necking due to the filling of the continuous phase from both sides. With only the continuous phase
$\alpha$
is close to the 0.33 observed by Lu et al. (Reference Lu, Fu, Zhu, Ma and Li2013) in the first stage of bubble collapse, which is caused by droplet necking due to the filling of the continuous phase from both sides. With only the continuous phase ${Q}_3$
, the scaling exponent
${Q}_3$
, the scaling exponent $\alpha$
also increases, a trend consistent with the findings of van Hoeve et al. (Reference van Hoeve, Dollet, Versluis and Lohse2011). In figure 9(b,c), for the case of
$\alpha$
also increases, a trend consistent with the findings of van Hoeve et al. (Reference van Hoeve, Dollet, Versluis and Lohse2011). In figure 9(b,c), for the case of $\varepsilon \lt 1$
, the power-law behaviour of
$\varepsilon \lt 1$
, the power-law behaviour of $\bar {T}_n$
shows a completely different pattern from that for the case of
$\bar {T}_n$
shows a completely different pattern from that for the case of $\varepsilon = 1$
. The scaling exponent in the first stage is significantly larger than in the second. The value of
$\varepsilon = 1$
. The scaling exponent in the first stage is significantly larger than in the second. The value of $\alpha$
in the first stage increases with the flow rate of the continuous phase
$\alpha$
in the first stage increases with the flow rate of the continuous phase ${Q}_3$
at the second junction. In the second stage and the final rapid breakup phase, the values of
${Q}_3$
at the second junction. In the second stage and the final rapid breakup phase, the values of $\alpha$
remain relatively close and are less affected by the flow rate.
$\alpha$
remain relatively close and are less affected by the flow rate.
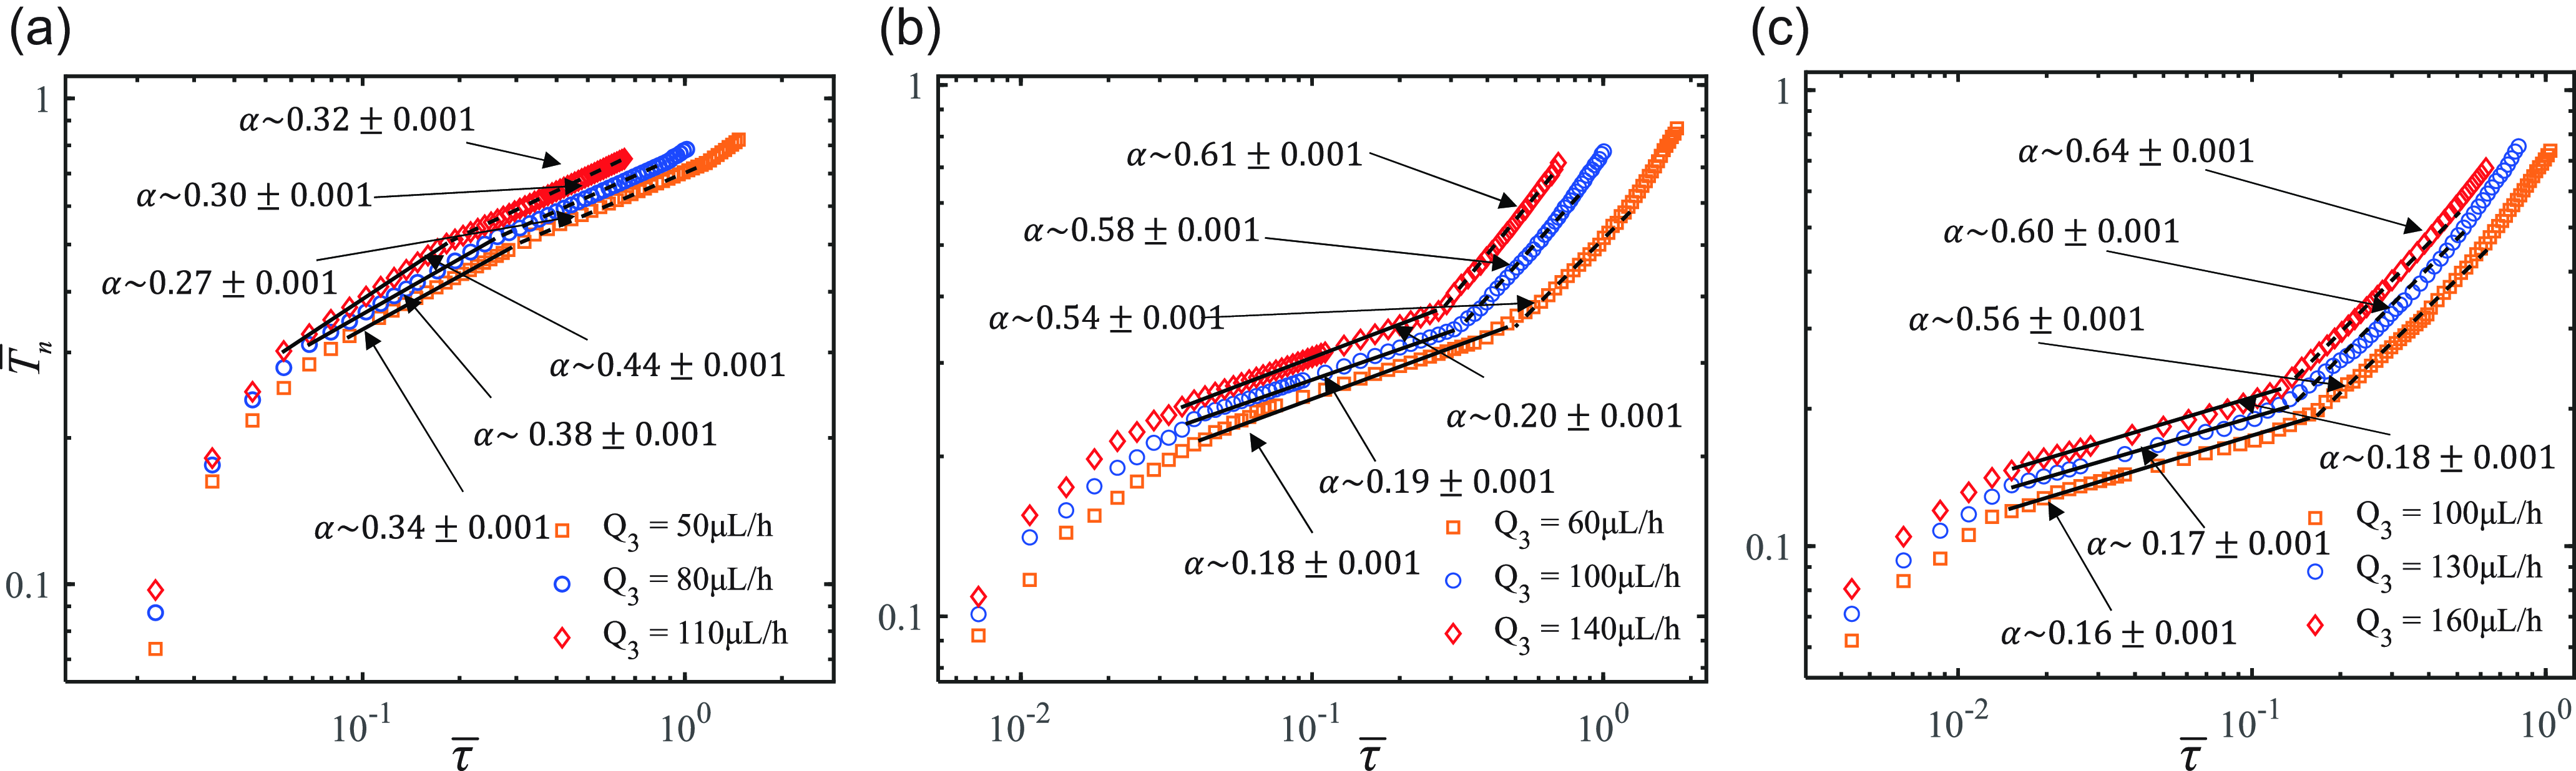
Figure 9. Time evolution of $\bar {T}_n$
during the breakup of confined droplets in channels with different aspect ratios: (a)
$\bar {T}_n$
during the breakup of confined droplets in channels with different aspect ratios: (a) $\varepsilon = 1,\ Ca = 3.88 \times 10^{-4}$
; (b)
$\varepsilon = 1,\ Ca = 3.88 \times 10^{-4}$
; (b) $\varepsilon =1/2,\ Ca = 1.94 \times 10^{-4}$
; (c)
$\varepsilon =1/2,\ Ca = 1.94 \times 10^{-4}$
; (c) $\varepsilon = 1/3,\ Ca = 1.29 \times 10^{-4}$
.
$\varepsilon = 1/3,\ Ca = 1.29 \times 10^{-4}$
.
We perform numerical simulations of droplet breakup behaviour, visually illustrating the dynamic deformation of the droplet interface in three-dimensional space and calculating the average curvature, $\kappa = 1/R_m$
. Figure 10(a) depicts the evolution of the droplet for
$\kappa = 1/R_m$
. Figure 10(a) depicts the evolution of the droplet for $\varepsilon = 1$
. In the initial stage (
$\varepsilon = 1$
. In the initial stage ( $t_1$
), the curvature at the neck centre is relatively low, while it is more pronounced at the front and rear ends. As time progresses (from
$t_1$
), the curvature at the neck centre is relatively low, while it is more pronounced at the front and rear ends. As time progresses (from $t_2$
to
$t_2$
to $t_5$
), the neck region undergoes further indentation and thinning, with a notable increase in curvature along the sides and at the upper and lower edges, indicating inward squeezing by the fluid within the square channel. At
$t_5$
), the neck region undergoes further indentation and thinning, with a notable increase in curvature along the sides and at the upper and lower edges, indicating inward squeezing by the fluid within the square channel. At $t_6$
, the curvature at the neck centre reaches its maximum, signifying imminent breakup. Notably, the curvature on the upper and lower surfaces of the droplet is not zero, suggesting that the droplet does not fully conform to the channel walls. In figure 10(b), for
$t_6$
, the curvature at the neck centre reaches its maximum, signifying imminent breakup. Notably, the curvature on the upper and lower surfaces of the droplet is not zero, suggesting that the droplet does not fully conform to the channel walls. In figure 10(b), for $\varepsilon = 1/2$
, at the initial stage (
$\varepsilon = 1/2$
, at the initial stage ( $t_1$
), the curvature on the upper and lower surfaces of the droplet is zero, while the side edges curve inward with a greater curvature. Following Dollet et al. (Reference Dollet, van Hoeve, Raven, Marmottant and Versluis2008), the deformation process of the droplet neck in channels with aspect ratios not equal to 1 can be divided into two stages: two-dimensional collapse and three-dimensional collapse. From
$t_1$
), the curvature on the upper and lower surfaces of the droplet is zero, while the side edges curve inward with a greater curvature. Following Dollet et al. (Reference Dollet, van Hoeve, Raven, Marmottant and Versluis2008), the deformation process of the droplet neck in channels with aspect ratios not equal to 1 can be divided into two stages: two-dimensional collapse and three-dimensional collapse. From $t_2$
to
$t_2$
to $t_3$
, the droplet is considered to be in the two-dimensional stage, where the curvature distribution along the neck sides remains nearly constant. At
$t_3$
, the droplet is considered to be in the two-dimensional stage, where the curvature distribution along the neck sides remains nearly constant. At $t_4$
, the local curvature at the neck centre increases, indicating that the neck is about to detach from the channel walls. The subsequent indentation can be classified as the three-dimensional collapse stage, during which the neck curvature gradually increases. The shape and curvature evolution of the droplet in figure 10(c), for
$t_4$
, the local curvature at the neck centre increases, indicating that the neck is about to detach from the channel walls. The subsequent indentation can be classified as the three-dimensional collapse stage, during which the neck curvature gradually increases. The shape and curvature evolution of the droplet in figure 10(c), for $\varepsilon = 1/3$
, resembles that in figure 10(b). Across channels with different aspect ratios, the average curvature distribution at the neck centre exhibits significant consistency during the final collapse stage.
$\varepsilon = 1/3$
, resembles that in figure 10(b). Across channels with different aspect ratios, the average curvature distribution at the neck centre exhibits significant consistency during the final collapse stage.
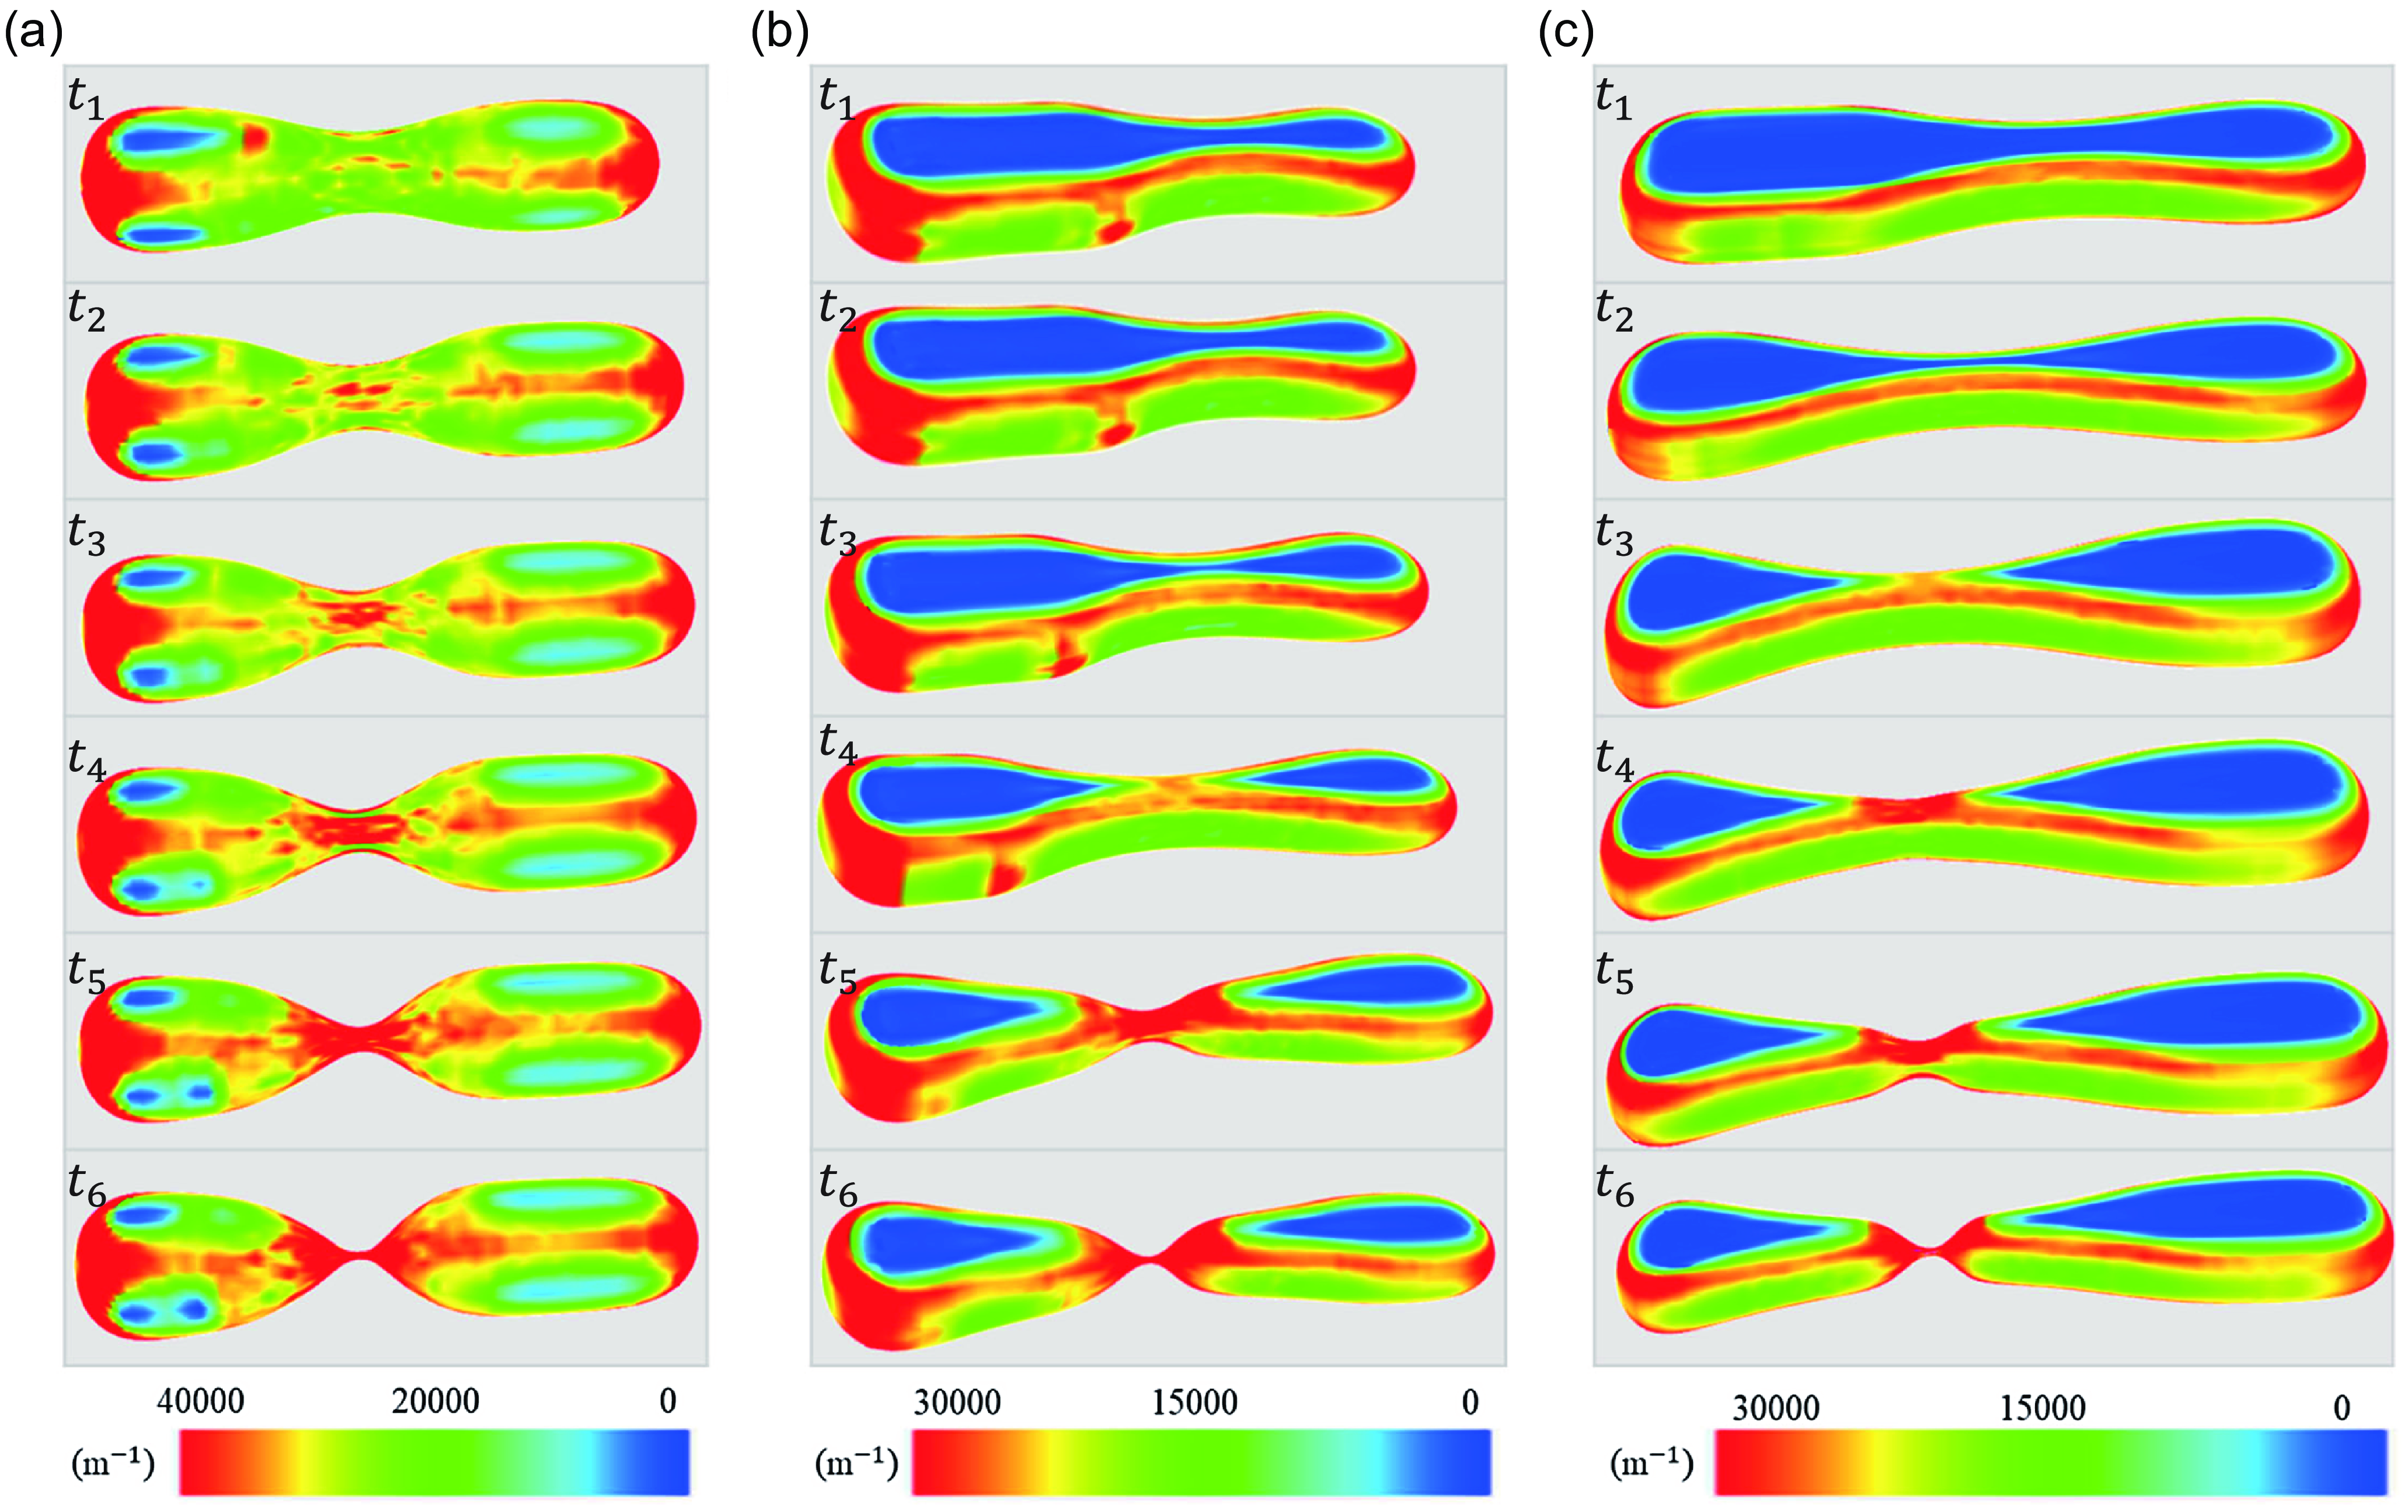
Figure 10. Averaged curvature of the droplet interface at different times in channels with varying aspect ratios: (a) $\varepsilon = 1$
,
$\varepsilon = 1$
, $Ca=4.76 \times 10^{-4}$
; (b)
$Ca=4.76 \times 10^{-4}$
; (b) $\varepsilon = 1/2$
,
$\varepsilon = 1/2$
, $Ca=2.79 \times 10^{-4}$
; (c)
$Ca=2.79 \times 10^{-4}$
; (c) $\varepsilon = 1/3$
,
$\varepsilon = 1/3$
, $Ca=1.68 \times 10^{-4}$
.
$Ca=1.68 \times 10^{-4}$
.
To better illustrate the dynamic deformation of the droplet neck during the breakup process, figure 11 presents the evolution of the droplet profile from two perspectives: the cross-sectional and horizontal planes based on numerical simulation results. Figure 11(a) shows the motion and deformation of the droplet in a channel with $\varepsilon = 1$
. The red dashed line traces the trajectory of the thinnest part of the droplet neck during the confined breakup process. Notably, the trajectory of the thinnest region consistently deviates from the geometric centre of the channel. In the initial stage, the trajectory moves in the opposite direction of the droplet motion. At time A, the droplet is constrained by the upper and lower channel walls and compressed by the symmetrically positioned continuous-phase fluid from both sides. At this moment, the droplet’s cross-sectional profile forms a slightly flattened ellipse. As the droplet moves forward, the thinnest part of the neck gradually approaches the centre of the main channel, following a smooth arc-shaped trajectory. This suggests that during this stage, the droplet surface gradually detaches from the confinement of the channel walls, transitioning from a geometrically constrained state to a freer form, no longer directly influenced by the channel geometry. Figures 11(b) and 11(c) depict the motion and deformation of the droplet in channels with
$\varepsilon = 1$
. The red dashed line traces the trajectory of the thinnest part of the droplet neck during the confined breakup process. Notably, the trajectory of the thinnest region consistently deviates from the geometric centre of the channel. In the initial stage, the trajectory moves in the opposite direction of the droplet motion. At time A, the droplet is constrained by the upper and lower channel walls and compressed by the symmetrically positioned continuous-phase fluid from both sides. At this moment, the droplet’s cross-sectional profile forms a slightly flattened ellipse. As the droplet moves forward, the thinnest part of the neck gradually approaches the centre of the main channel, following a smooth arc-shaped trajectory. This suggests that during this stage, the droplet surface gradually detaches from the confinement of the channel walls, transitioning from a geometrically constrained state to a freer form, no longer directly influenced by the channel geometry. Figures 11(b) and 11(c) depict the motion and deformation of the droplet in channels with $\varepsilon = 1/2$
and
$\varepsilon = 1/2$
and $\varepsilon = 1/3$
, respectively. In both cases, the profile of the cross-section of the droplet exhibits more complex shapes, which can be approximately described as semicircular sections on both sides with a rectangular section in the middle. In channels with larger aspect ratios, the rectangular portion is significantly elongated, and during the deformation process, the semicircular sections on both sides contract towards the centre. In the horizontal section, it is observed that the trajectory of the thinnest part of the neck along segments BC and DE is perpendicular to the droplet’s motion direction, in sharp contrast to the case of
$\varepsilon = 1/3$
, respectively. In both cases, the profile of the cross-section of the droplet exhibits more complex shapes, which can be approximately described as semicircular sections on both sides with a rectangular section in the middle. In channels with larger aspect ratios, the rectangular portion is significantly elongated, and during the deformation process, the semicircular sections on both sides contract towards the centre. In the horizontal section, it is observed that the trajectory of the thinnest part of the neck along segments BC and DE is perpendicular to the droplet’s motion direction, in sharp contrast to the case of $\varepsilon = 1$
, indicating that the channel’s aspect ratio significantly affects the droplet’s motion trajectory. The turning points in the trajectory, marked by arrows in the figure, correspond to the droplet profiles at C and E. At these moments, the profile of the cross-section of the droplet approximates a circle tangential to the channel walls, suggesting that the radius of the neck is approximately half the channel height.
$\varepsilon = 1$
, indicating that the channel’s aspect ratio significantly affects the droplet’s motion trajectory. The turning points in the trajectory, marked by arrows in the figure, correspond to the droplet profiles at C and E. At these moments, the profile of the cross-section of the droplet approximates a circle tangential to the channel walls, suggesting that the radius of the neck is approximately half the channel height.
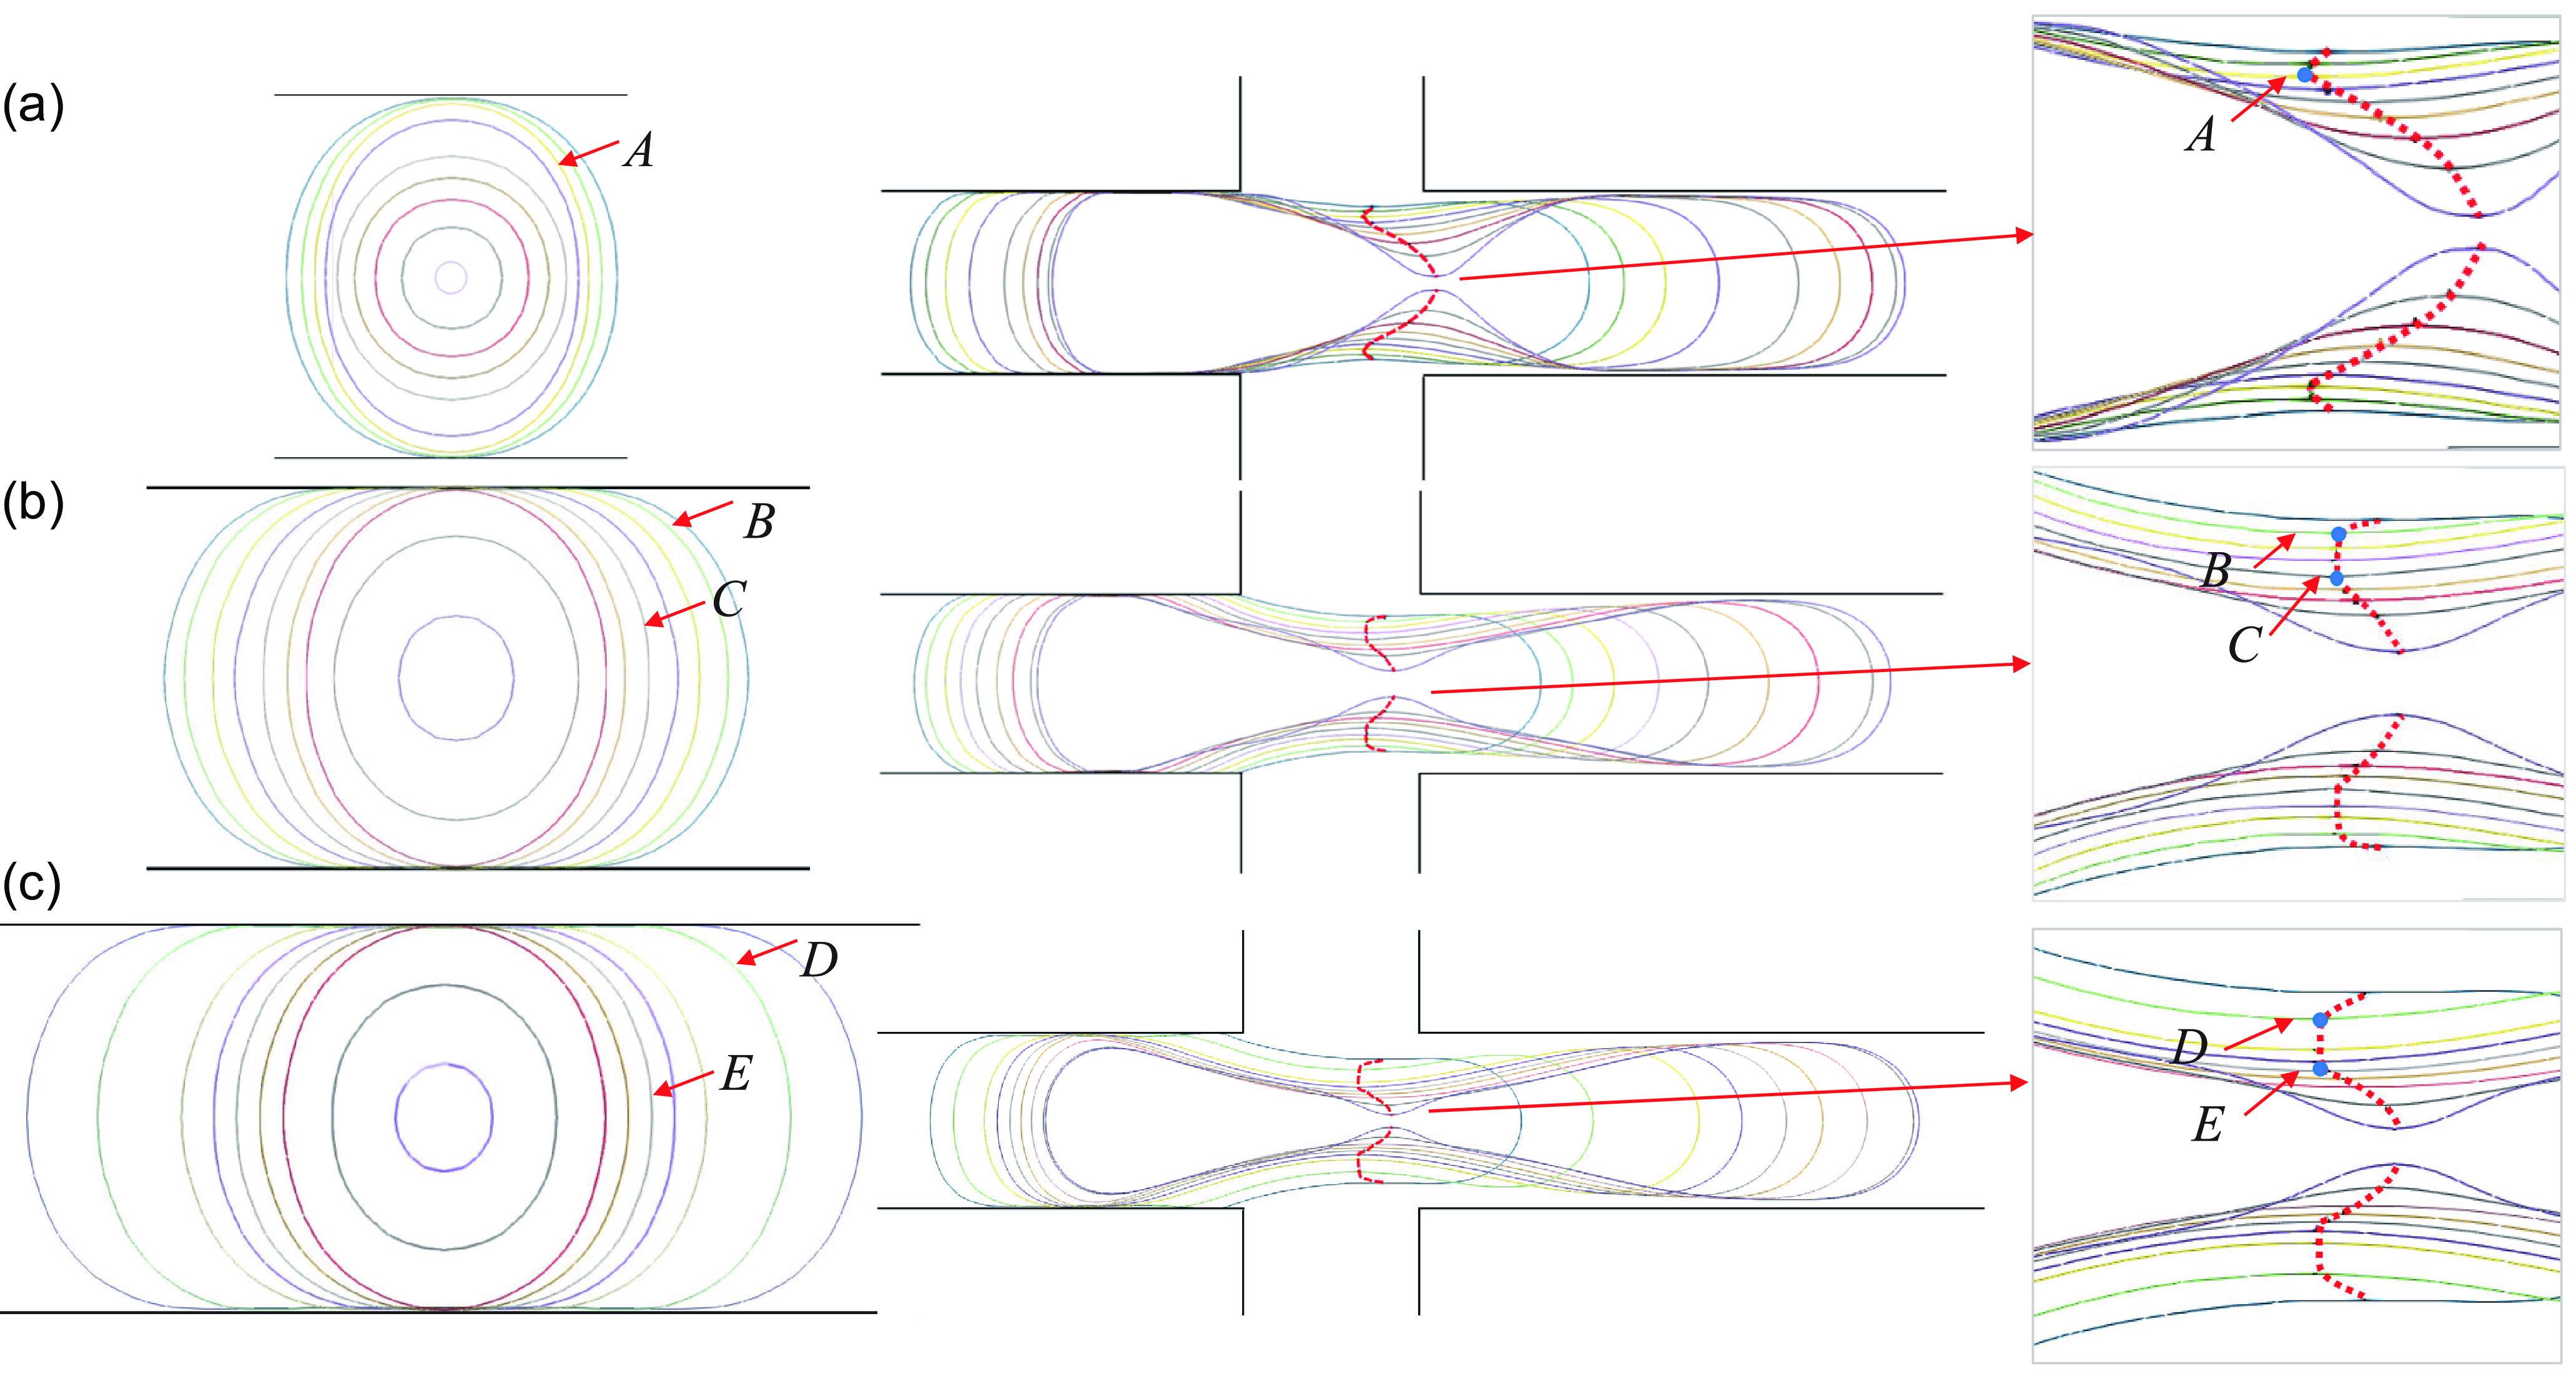
Figure 11. Evolution of droplet profiles of cross-section and horizontal section in channels with different aspect ratios: (a) $\varepsilon = 1$
,
$\varepsilon = 1$
, $C a=4.76 \times 10^{-4}$
; (b)
$C a=4.76 \times 10^{-4}$
; (b) $\varepsilon = 1/2$
,
$\varepsilon = 1/2$
, $C a=2.79 \times 10^{-4}$
; (c)
$C a=2.79 \times 10^{-4}$
; (c) $\varepsilon = 1/3$
,
$\varepsilon = 1/3$
, $C a=1.68 \times 10^{-4}$
.
$C a=1.68 \times 10^{-4}$
.
To further analyse the evolution of the mean radius of curvature of the neck centre, $R_m$
is normalised by
$R_m$
is normalised by $w/2$
and replaced by
$w/2$
and replaced by $\bar {R}_m$
. In figure 12(a), for the channel with
$\bar {R}_m$
. In figure 12(a), for the channel with $\varepsilon = 1$
, the early necking stage does not follow any apparent power law. At
$\varepsilon = 1$
, the early necking stage does not follow any apparent power law. At $\bar{\tau}_1 \approx 0.41$
,
$\bar{\tau}_1 \approx 0.41$
, $\bar{R}_m \approx 0.73$
, the droplet has already separated from the channel walls, and its profile of the cross-section can be approximated as circular. This result closely matches the critical mean radius of curvature
$\bar{R}_m \approx 0.73$
, the droplet has already separated from the channel walls, and its profile of the cross-section can be approximated as circular. This result closely matches the critical mean radius of curvature $\bar{R}_m \approx 0.71$
reported by Chen et al. (Reference Chen, Xue and Hu2019) for droplet breakup in square channels. Beyond
$\bar{R}_m \approx 0.71$
reported by Chen et al. (Reference Chen, Xue and Hu2019) for droplet breakup in square channels. Beyond $\alpha\ \text{of}\ \bar{R}_m$ $\bar{\tau}_1 \approx 0.11$
, the scaling exponent
$\bar{\tau}_1 \approx 0.11$
, the scaling exponent $\alpha$
of
$\alpha$
of $\bar{R}_m$
converges toward that of
$\bar{R}_m$
converges toward that of $\bar{T}_n$
. In figure 12(b), during the initial deformation stage,
$\bar{T}_n$
. In figure 12(b), during the initial deformation stage, $\bar {T}_n$
is greater than
$\bar {T}_n$
is greater than $\bar {R}_m$
. As
$\bar {R}_m$
. As $\bar {\tau }$
decreases,
$\bar {\tau }$
decreases, $\bar {T}_n$
gradually decreases, while
$\bar {T}_n$
gradually decreases, while $\bar {R}_m$
remains nearly constant, approximately equal to half the channel height. The intersection of the two curves indicates that the profile of the cross-section is approximately circular at this point, corresponding to the droplet profile at time C in figure 11(b). When
$\bar {R}_m$
remains nearly constant, approximately equal to half the channel height. The intersection of the two curves indicates that the profile of the cross-section is approximately circular at this point, corresponding to the droplet profile at time C in figure 11(b). When $\bar {\tau }_1 \approx 0.26$
, the corresponding
$\bar {\tau }_1 \approx 0.26$
, the corresponding $\bar {R}_m \approx 0.52$
. At this moment, the profile of the cross-section clearly shows an elliptical shape, slightly flattened on the sides. When
$\bar {R}_m \approx 0.52$
. At this moment, the profile of the cross-section clearly shows an elliptical shape, slightly flattened on the sides. When $\bar {\tau }_2 \approx 0.13$
, the profile of the cross-section reveals that the interface of the droplet has completely separated from the channel walls, transitioning the droplets from a confined to a free state. Time
$\bar {\tau }_2 \approx 0.13$
, the profile of the cross-section reveals that the interface of the droplet has completely separated from the channel walls, transitioning the droplets from a confined to a free state. Time $\bar {\tau }_1$
marks the critical moment that signifies the transition from the two-dimensional collapse stage to the three-dimensional collapse stage. At this point,
$\bar {\tau }_1$
marks the critical moment that signifies the transition from the two-dimensional collapse stage to the three-dimensional collapse stage. At this point, $R_m$
is slightly larger than half the channel height, while
$R_m$
is slightly larger than half the channel height, while $T_n$
is slightly smaller than half the channel height. During the three-dimensional collapse stage, as the channel walls no longer constrain the droplet, it is squeezed by the fluid from all directions. The thinning rate of
$T_n$
is slightly smaller than half the channel height. During the three-dimensional collapse stage, as the channel walls no longer constrain the droplet, it is squeezed by the fluid from all directions. The thinning rate of $\bar {R}_m$
is relatively slow in the early stages but accelerates significantly later. In figure 12(c), the evolution of the mean radius of curvature in the
$\bar {R}_m$
is relatively slow in the early stages but accelerates significantly later. In figure 12(c), the evolution of the mean radius of curvature in the $\varepsilon = 1/3$
channel resembles that in the
$\varepsilon = 1/3$
channel resembles that in the $\varepsilon = 1/2$
channel. When
$\varepsilon = 1/2$
channel. When $\bar {\tau }_1 \approx 0.16$
, the corresponding
$\bar {\tau }_1 \approx 0.16$
, the corresponding $\bar {R}_m \approx 0.35$
is slightly larger than half the channel height (0.33). The profile of the cross-section of the droplet approximates an ellipse tangent to the channel walls.
$\bar {R}_m \approx 0.35$
is slightly larger than half the channel height (0.33). The profile of the cross-section of the droplet approximates an ellipse tangent to the channel walls.
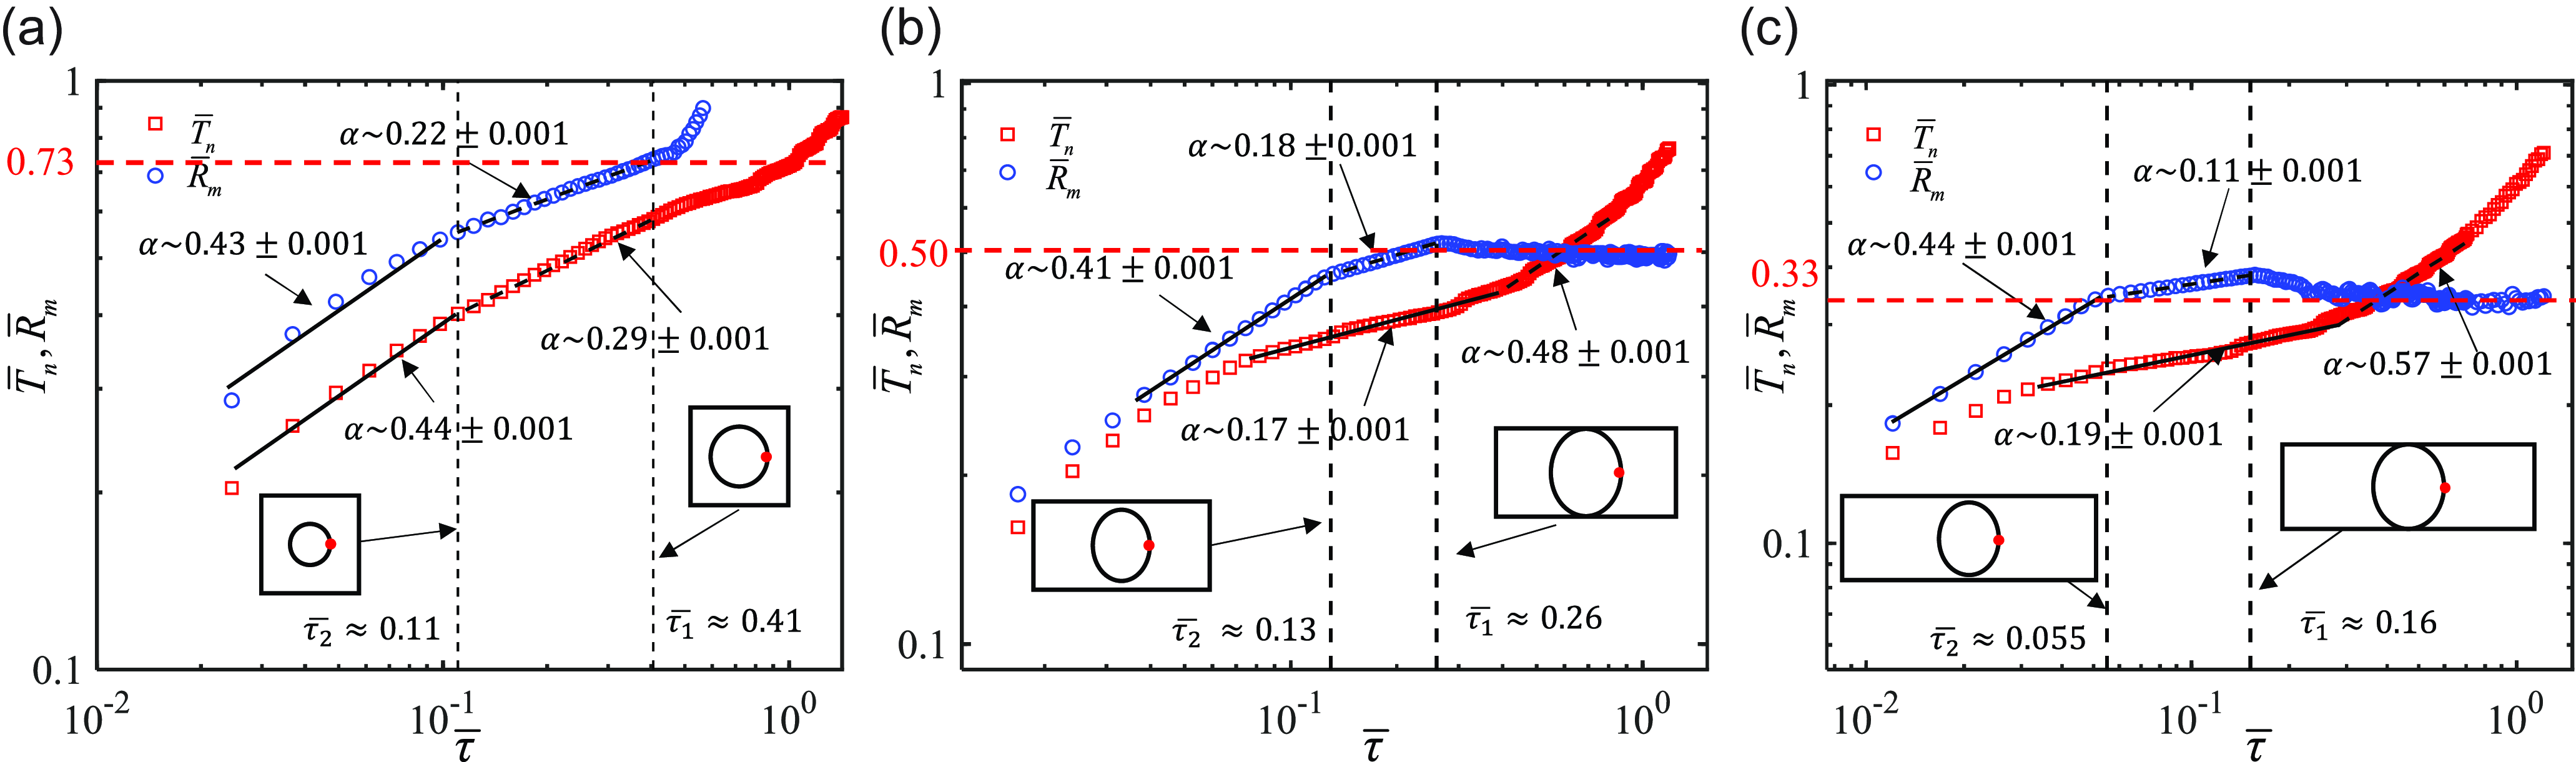
Figure 12. Evolution of $\bar {T}_n$
and
$\bar {T}_n$
and $\bar {R}_m$
of the confined droplets in channels with different aspect ratios: (a)
$\bar {R}_m$
of the confined droplets in channels with different aspect ratios: (a) $\varepsilon = 1$
,
$\varepsilon = 1$
, $C a=4.76 \times 10^{-4}$
; (b)
$C a=4.76 \times 10^{-4}$
; (b) $\varepsilon = 1/2$
,
$\varepsilon = 1/2$
, $C a=2.79 \times 10^{-4}$
; (c)
$C a=2.79 \times 10^{-4}$
; (c) $\varepsilon = 1/3$
,
$\varepsilon = 1/3$
, $C a=1.68 \times 10^{-4}$
.
$C a=1.68 \times 10^{-4}$
.
4. Conclusions
In this study, the interface evolution of confined droplets in a microfluidic channel with two flow-focused junctions at different aspect ratios is systematically studied through experimental observation and numerical simulation. In the experiments, droplets are generated at the first junction, and three flow patterns – no breakup, single breakup and multiple breakups – are observed at the second junction. The regime diagrams of initial droplet length and flow conditions are constructed to determine the transition boundary curves between these flow patterns. In the pattern of multiple breakups, it is found that the length of daughter droplets follows an approximate power-law relationship with a capillary number related to the continuous phase of the second junction. Half the minimum neck thickness of the droplet is obtained by high-speed imaging. A power-law relationship between this thickness and the remaining breakup time is identified, with the scaling exponent increasing as the continuous-phase flow rate increases. To further explore the breakup characteristics of the droplet neck, numerical simulations are performed, visually demonstrating the dynamic deformation of the droplet interface in three-dimensional space and the evolution of the averaged curvature. The profile evolution of the droplet at the horizontal and the cross-section at the minimum neck position is described, and the trajectory of the droplet at the thinnest neck position is revealed in the channels with different aspect ratios. Additionally, two principal radii of curvature are obtained from the droplet profile, determining the mean radius of curvature, which more accurately describes the dynamic evolution of the droplet neck. The mean radius of curvature during droplet breakup follows a power-law relationship with the remaining time to breakup, and the scaling exponent differs significantly between channels with an aspect ratio of 1 and those with an aspect ratio of less than 1. In channels with an aspect ratio of 1, droplet breakup occurs exclusively in the three-dimensional collapse stage, where the final pinch-off is predominantly governed by capillary forces. Conversely, in channels with an aspect ratio of less than 1, droplet deformation progresses through a two-dimensional collapse stage before transitioning to the three-dimensional collapse stage. During the two-dimensional collapse stage, bubble shrinkage is primarily driven by side-flow dynamics, with capillary forces playing a minor role, while inertial and viscous forces have a more significant influence. The specific physical mechanisms underlying these processes remain unclear and require further investigation. In such channels, the transition from the two-dimensional necking stage to the three-dimensional collapse stage occurs when the droplet interface detaches from the channel wall. This paper determines the critical cross-sectional profile of the droplet just before detachment under the given flow conditions. These findings offer insights into the post-generation breakup behaviour of droplets under various geometric constraints and provide theoretical guidance for the application of microfluidic droplet breakup technologies.
Data availability statement
Raw data are available from the corresponding author (X.C.).
Author contributions
X.C. created the research plan and designed experiments and simulations. L.H. performed all experiments and simulations. L.H., B.W., Q.L. and X.C. wrote the manuscript.
Funding statement
X.C. gratefully acknowledges funding from the National Natural Science Foundation of China (grant nos. 12272050 and U23B6009).
Competing interests
The authors declare no conflict of interest.
Ethical statement
The research meets all ethical guidelines, including adherence to the legal requirements of the study country.


 Open access