

1. Introduction
Genome-wide association studies (GWAS) aim to detect genetic variants associated with complex traits. Though GWAS have successfully uncovered a large number of common genetic variants in human complex diseases, these common variants can only explain a small proportion of disease heritability (Bansal et al., Reference Bansal, Libiger, Torkamani and Schork2010). Research has shown that rare variants are actually responsible for part of the heritability of complex disease (Manolio et al., Reference Manolio, Collins, Cox, Goldstein, Hindorff, Hunter, McCarthy, Ramos, Cardon, Chakravarti, Cho, Guttmacher, Kong, Kruglyak, Mardis, Rotimi, Slatkin, Valle, Whittemore, Boehnke, Clark, Eichler, Gibson, Haines, Mackay, McCarroll and Visscher2009). Because of low minor allele frequency (MAF) of rare variants, many methods for single common variants are underpowered to detect a single rare variant. To improve the power of rare variant association analysis, many methods test the collective effect of rare variants in a genomic region, including burden tests and non-burden tests (Li & Leal, Reference Lange, Van Steen, Andrew, Lyon, Demeo, Raby, Li and Leal2008; Madsen & Browning, Reference Madsen and Browning2009; Price et al., Reference Price, Kryukov, Bakker, Purcell, Staples, Wei and Sunyaev2010; Neale et al., Reference Neale, Rivas, Voight, Altshuler, Devlin, Orho-Melander, Kathiresan, Purcell, Roeder and Daly2011; Wu et al., Reference Wu, Lee, Cai, Li, Boehnke and Lin2011).
However, almost all of the aforementioned methods have primarily focused on a single trait. In the study of complex diseases, pleiotropy is a widespread phenomenon (Sivakumaran et al., Reference Sivakumaran, Agakov, Theodoratou, Prendergast, Zgaga, Manolio and Campbell2011), and multiple correlated traits are usually measured, for example, hypertension is diagnosed by systolic blood pressure (SBP) and diastolic blood pressure (DBP); coronary heart disease is evaluated using cytokine interleukin-6, C-reactive protein, interleukin-1, tumor necrosis factor-α and fibrinogen. Joint analysis of multiple traits can improve statistical power and provide additional insights into the genetic architecture of the complex disease (Aschard et al., Reference Aschard, Vilhjalmsson, Greliche, Morange, Tregouet and Kraft2014). Currently, there are many methods to jointly analyse multiple traits, for example, regression methods (Korte et al., Reference Korte, Vilhjalmsson, Segura, Platt, Long and Nordborg2012; O'Reilly et al., Reference O'Reilly, Hoggart, Pomyen, Calboli, Elliott, Jarvelin and Coin2012; Zhou & Stephens, Reference Zhou and Stephens2014), combining test statistics from univariate analysis (Yang et al., Reference Yang, Wu, Guo and Fox2010; Van Der Sluis et al., Reference Van Der Sluis, Posthuma and Dolan2013), and variable reduction methods (Klei et al., Reference Klei, Luca, Devlin and Roeder2008; Tang & Ferreira, Reference Tang and Ferreira2012; Aschard et al., Reference Aschard, Vilhjalmsson, Greliche, Morange, Tregouet and Kraft2014).
Though these methods can test association between one common variant and multiple traits, for rare variant association studies, they may suffer loss of power. In addition, there is increasing evidence to show that complex diseases are caused by both common and rare variants (Bodmer & Bonilla, Reference Bodmer and Bonilla2008; Ng et al., Reference Ng, Turner and Robertson2009; Teer & Mullikin, Reference Teer and Mullikin2010). In this article, we propose a region-based method to detect both rare and common variants associated with multiple traits by variable reduction method (abbreviated as MULVR). We first used the optimal weights method (TOW) proposed by Sha et al. (Reference Sha, Wang, Wang and Zhang2012) to test association between each trait and genetic variants in a genomic region. Then we took the aforementioned single TOW statistic as weight to combine the original traits. Finally, we still used the TOW method to test association between the linear combination of traits and multiple variants in a genomic region. But in the presence of noise traits, our method may lose power. To guard against the effect of the noise traits, we propose the MULVR-O method which uses the optimal number of traits to detect both rare and common variants by the MULVR method. Extensive simulation studies show that our proposed method (MULVR-O) is more powerful than several other comparison methods in most scenarios. In addition, analysing two genes (SHBG and CHRM3) and two phenotypes (SBP and DBP) from the GAW19 dataset illustrates that our proposed methods (MULVR and MULVR-O) are feasible and efficient as region-based methods.
2. Materials and methods
Consider n unrelated individuals. Each individual has either K correlated quantitative traits or K correlated qualitative traits, and has been genotyped at M variants (rare or common variants) in a genomic region (a gene or a pathway). For the ith individual, y ik denotes the kth trait value, g im ∈ {0, 1, 2} denotes the number of minor alleles at the mth variant (i = 1, 2, …, n, m = 1, 2, …, M, k = 1, …, K). We propose a MULVR method to test association between M variants and K traits. The detailed steps of our method are given as follows.
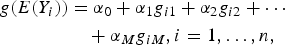
First, we respectively tested association between each trait and M variants. For the kth trait, we considered generalized linear models
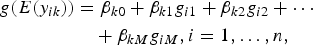 $$\eqalign{g(E(y_{ik})) &= \beta _{k0} + \beta _{k1}g_{i1} + \beta _{k2}g_{i2} + \cdots \cr &\quad + \beta _{kM}g_{iM}, i = 1, \ldots, n,}$$
where g( · ) is a link function, the logit function,
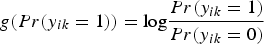 $g(Pr(y_{ik} = 1)) = {\rm log}\displaystyle{{Pr(y_{ik} = 1)} \over {Pr(y_{ik} = 0)}}$
, for qualitative trait; and the identity function, g(E(y
ik
)) = E(y
ik
), for quantitative trait. We used the TOW method proposed by Sha et al. (Reference Sha, Wang, Wang and Zhang2012) to test the null hypothesis H
0:β
k1 = β
k2 = · · · = β
kM
= 0. Then the test statistic is given by
$g(Pr(y_{ik} = 1)) = {\rm log}\displaystyle{{Pr(y_{ik} = 1)} \over {Pr(y_{ik} = 0)}}$
, for qualitative trait; and the identity function, g(E(y
ik
)) = E(y
ik
), for quantitative trait. We used the TOW method proposed by Sha et al. (Reference Sha, Wang, Wang and Zhang2012) to test the null hypothesis H
0:β
k1 = β
k2 = · · · = β
kM
= 0. Then the test statistic is given by
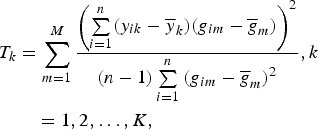 $$\eqalign{T_k &= \sum\limits_{m = 1}^M \displaystyle{{{\left( {\sum\limits_{i = 1}^n (y_{ik} - {\overline y} _k)(g_{im} - {\overline g} _m)} \right)}^2} \over {(n - 1)\sum\limits_{i = 1}^n {(g_{im} - {\overline g} _m)}^2}}, k\cr &\quad = 1,2, \ldots, K,}$$
where
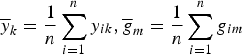 $\overline y _k = \displaystyle{1 \over n}\sum\limits_{i = 1}^n y_{ik},\overline g _m = \displaystyle{1 \over n}\sum\limits_{i = 1}^n g_{im}$
.
$\overline y _k = \displaystyle{1 \over n}\sum\limits_{i = 1}^n y_{ik},\overline g _m = \displaystyle{1 \over n}\sum\limits_{i = 1}^n g_{im}$
.
Second, let y
k
= (y
1k
, y
2k
, …, y
nk
)T, k = 1, 2, …, K. We combined y
1, y
2, …, y
K
with weights T
1, T
2, …, T
K
. The test statistic T
k
reflects the association between the kth trait and genotypes. The stronger the association, the greater the value of statistic T
k
, and the larger the weight of the kth trait y
k
. Let
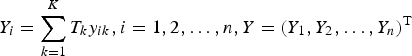 $Y_i = \sum\limits_{k = 1}^K T_ky_{ik},i = 1,2, \ldots, n,Y = (Y_1,Y_2, \ldots, Y_n)^{\rm T}$
.
$Y_i = \sum\limits_{k = 1}^K T_ky_{ik},i = 1,2, \ldots, n,Y = (Y_1,Y_2, \ldots, Y_n)^{\rm T}$
.
Finally, we detected association between Y and M variants. We considered generalized linear models
 $$\eqalign{g(E(Y_i)) &= \alpha _0 + \alpha _1g_{i1} + \alpha _2g_{i2} + \cdots \cr &\quad + \alpha _Mg_{iM},i = 1, \ldots, n, }$$
and still used the TOW method to test the null hypothesis H 0:α 1 = α 2 = · · · = α M = 0, and obtained the test statistic
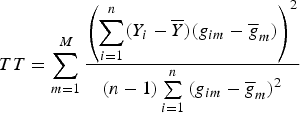 $$TT = \sum\limits_{m = 1}^M {\displaystyle{{\left( {\sum\limits_{i = 1}^n (Y_i - \overline Y )(g_{im} - {\overline g} _m)} \right)}^2} \over {(n - 1)\sum\limits_{i = 1}^n {(g_{im} - {\overline g} _m)}^2}}$$
where
 $\overline Y = \displaystyle{1 \over n}\sum\limits_{i = 1}^n Y_i$
.
$\overline Y = \displaystyle{1 \over n}\sum\limits_{i = 1}^n Y_i$
.
However, in the presence of noise traits, the MULVR method may lose power. To guard against the effect of noise traits, we propose the following MULVR-O method which uses the optimal number of traits to test the genetic variants by the MULVR method. In detail, we sorted test statistics T
1, …, T
k
, …, T
K
in descending order and used
 ${T}^{\prime}_k$
to denote the kth largest test statistic, and accordingly denote
${T}^{\prime}_k$
to denote the kth largest test statistic, and accordingly denote
 ${y}^{\prime}_k$
as the trait which is used for calculating
${y}^{\prime}_k$
as the trait which is used for calculating
 ${T}^{\prime}_k,k = 1,2,\; \ldots, K$
. let
${T}^{\prime}_k,k = 1,2,\; \ldots, K$
. let
 $Y^{(k)} = ({y}^{\prime}_1, \ldots, {y}^{\prime}_k)$
denote the first k traits of
$Y^{(k)} = ({y}^{\prime}_1, \ldots, {y}^{\prime}_k)$
denote the first k traits of
 ${y}^{\prime}_1, \ldots, {y}^{\prime}_k, \ldots, {y}^{\prime}_K$
. For each Y
(k), we used the MULVR method to obtain the test statistic TT
k
, and denoted the according P-value of TT
k
as
${y}^{\prime}_1, \ldots, {y}^{\prime}_k, \ldots, {y}^{\prime}_K$
. For each Y
(k), we used the MULVR method to obtain the test statistic TT
k
, and denoted the according P-value of TT
k
as
 $P_{TT_k},k = 1, \ldots, K$
. The overall statistic was defined as
$P_{TT_k},k = 1, \ldots, K$
. The overall statistic was defined as
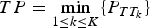 $TP = \mathop {\min} \limits_{1 \le k \le K} \{ P_{TT_k}\} $
. We used a permutation process to evaluate the P-values of TT
k
and TP. In each permutation, we randomly shuffled the genotypes and recalculated T
1, …, T
K
and TT
1, …, TT
K
. Suppose we perform B times of permutations. For the bth permutation, let
$TP = \mathop {\min} \limits_{1 \le k \le K} \{ P_{TT_k}\} $
. We used a permutation process to evaluate the P-values of TT
k
and TP. In each permutation, we randomly shuffled the genotypes and recalculated T
1, …, T
K
and TT
1, …, TT
K
. Suppose we perform B times of permutations. For the bth permutation, let
 $TT_k^{(b)} $
denote the value of TT
k
, k = 1, …, K, b = 0, 1, …, B, where b = 0 represents the original data. Then, we obtained P-values by
$TT_k^{(b)} $
denote the value of TT
k
, k = 1, …, K, b = 0, 1, …, B, where b = 0 represents the original data. Then, we obtained P-values by
 $$\eqalign{P_{TT_k}^{(b)} &= \displaystyle{{\sum\limits_{{b}^{\prime} = 1}^B I_{\{ TT_k^{({b}^{\prime})} \gt TT_k^{(b)} \}}} \over B},\;b = 0,1, \ldots, B,\;{\rm and}\;k \cr&= 1, \ldots, K.}$$
Let
 $P_{TT}^{(b)} = \mathop {\min} \limits_{1 \le k \le K} P_{TT_k}^{(b)} $
for b = 0, 1, …, B. Then the P-value of TP is given by
$P_{TT}^{(b)} = \mathop {\min} \limits_{1 \le k \le K} P_{TT_k}^{(b)} $
for b = 0, 1, …, B. Then the P-value of TP is given by
 $${\displaystyle{\sum\limits_{b = 1}^B I_{\{ P_{TT}^{(b)} \lt P_{TT}^{(0)} \}}} \over B}.$$
3. Simulation studies
(i) Simulation design
For simulation studies, we used the GAW17 dataset, which contains genotypes of 697 unrelated individuals on 3205 genes. Based on the simulation procedure of Sha et al. (Reference Sha, Wang, Wang and Zhang2012), we chose four genes: ELAVL4 (gene 1), MSH4 (gene 2), PDE4B (gene 3) and ADAMTS4 (gene 4) with 10, 20, 30 and 40 variants, and merged the four genes to form a super gene (Sgene) with 100 variants. According to the genotypes of 697 individuals in the Sgene, we generated genotypes of n individuals.
To evaluate the type I error rate and power, we generated K quantitative traits by the factor model (Wang et al., Reference Wang, Wang, Sha and Zhang2016)
 $$Y = \Lambda G + \sqrt \rho \gamma f + \sqrt {1 - \rho} \varepsilon,$$
where Y = (y
1, y
2, …, y
K
)T,
 $G = (g_1, \ldots, g_{N_c})^{\rm T}$
is the vector of the genotype scores at the causal variants, N
c
is the number of causal variants, Λ = (β
1, … ,
$G = (g_1, \ldots, g_{N_c})^{\rm T}$
is the vector of the genotype scores at the causal variants, N
c
is the number of causal variants, Λ = (β
1, … ,
 $\beta _k, \ldots, \beta _K)_{K \times N_c}^{\rm T}, \beta _k = (\beta _{k1}, \ldots, \beta _{kN_c})^{\rm T}$
, f = (f
1, … , f
R
)T ~ MVN(0, I) is a vector of R independent standard normal latent variables, I is the identity matrix, ε = (ε
1, …, ε
K
)T ~ MVN(0, I) is a vector of errors, γ is a K × R loading matrix, and ρ is a constant number. Therefore, Y ~ MVN(ΛG, Σ), where Σ = ργγ
T + (1 − ρ)I. According to eqn (7), we considered two models: (1) there is only one factor (R = 1), γ = (1, … , 1)T, and Σ is a K × K matrix whose main diagonal elements are 1 and off-diagonal elements are 0.5; (2) there are two factors (R = 2), γ = diag(D
1, D
2), where
$\beta _k, \ldots, \beta _K)_{K \times N_c}^{\rm T}, \beta _k = (\beta _{k1}, \ldots, \beta _{kN_c})^{\rm T}$
, f = (f
1, … , f
R
)T ~ MVN(0, I) is a vector of R independent standard normal latent variables, I is the identity matrix, ε = (ε
1, …, ε
K
)T ~ MVN(0, I) is a vector of errors, γ is a K × R loading matrix, and ρ is a constant number. Therefore, Y ~ MVN(ΛG, Σ), where Σ = ργγ
T + (1 − ρ)I. According to eqn (7), we considered two models: (1) there is only one factor (R = 1), γ = (1, … , 1)T, and Σ is a K × K matrix whose main diagonal elements are 1 and off-diagonal elements are 0.5; (2) there are two factors (R = 2), γ = diag(D
1, D
2), where
 $D_1 = (1, \ldots, 1)_{[K/2] \times 1}^{\rm T}, D_2 = (1, \ldots, 1)_{(K - [K/2]) \times 1}^{\rm T} $
and Σ = diag(Σ1, Σ2), where Σ1 is a [K/2] × [K/2] matrix whose main diagonal elements are 1, and off-diagonal elements are 0.5; Σ2 is a (K − [K/2]) × (K − [K/2]) matrix whose elements are similar to those of Σ1. Based on a quantitative trait, an individual is defined as affected if the individual's corresponding quantitative trait value is at least one standard deviation larger than the phenotypic mean. We supposed a prevalence of 16% for the simulated disease in the general population. Therefore, we could generate multiple qualitative traits.
$D_1 = (1, \ldots, 1)_{[K/2] \times 1}^{\rm T}, D_2 = (1, \ldots, 1)_{(K - [K/2]) \times 1}^{\rm T} $
and Σ = diag(Σ1, Σ2), where Σ1 is a [K/2] × [K/2] matrix whose main diagonal elements are 1, and off-diagonal elements are 0.5; Σ2 is a (K − [K/2]) × (K − [K/2]) matrix whose elements are similar to those of Σ1. Based on a quantitative trait, an individual is defined as affected if the individual's corresponding quantitative trait value is at least one standard deviation larger than the phenotypic mean. We supposed a prevalence of 16% for the simulated disease in the general population. Therefore, we could generate multiple qualitative traits.
For evaluating the type I error rate, let β kj = 0, k = 1, …, K, j = 1, …, N c ; for comparing power, we considered that causal variants contain both rare and common variants, and β kj is a constant and its value depends on the total heritability and the ratio of the heritability of rare causal variants to the heritability of common causal variants. Suppose that the heritability of each rare causal variant is not always equal, and there is one common causal variant. Without loss of generality, our method is still applied to multiple common causal variants. We compared our proposed method (MULVR-O) with canonical correlation analysis (CCA) (Tang & Ferreira, Reference Tang and Ferreira2012), adaptive weighting reverse regression (AWRR) (Wang et al., Reference Wang, Wang, Sha and Zhang2016), and the weighted sum reverse regression (WSRR) (Madsen & Browning, Reference Madsen and Browning2009; Wang et al., Reference Wang, Wang, Sha and Zhang2016). The definitions, pros and cons and applications for the four comparison methods are summarized in Table 1. Based on the research of Wang et al. (Reference Wang, Wang, Sha and Zhang2016), we used permutation procedure to evaluate the P-value of the CCA statistic instead of the asymptotical distribution of the CCA statistic. The AWRR method was implemented with its R script.
The four compared methods.

(ii) Evaluation on type I error rates
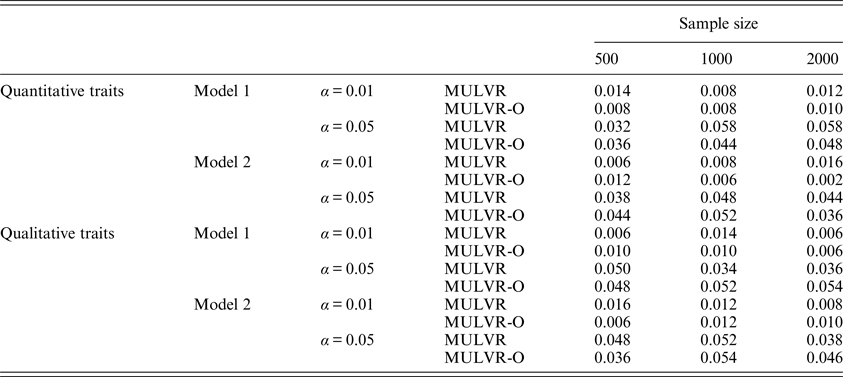
For evaluating type I error rates, P-values were estimated by 1000 permutations and type I error rates were evaluated by 500 replications. Table 2 summarizes the estimated type I error rates for different types of traits, different sample sizes, different significance levels and two different models, and shows that the MULVR and MULVR-O methods can control type I error rate.
The type I error rates.
Note: α represents the significance level.
(iii) Power comparisons
For power comparisons, we considered two different types of traits and models. For each type of trait and each model, we considered different values of heritability, different percentages of protective variants, different percentages of causal variants, different numbers of associated traits and different sample sizes. In each simulation, P-values were estimated by 1000 permutations and powers were evaluated by 500 replications at a significance level of 0.05. We first considered the performances of the four methods (MULVR-O, CCA, WSRR and AWRR) in the presence of noise traits.
Power comparisons for different values of heritability are given by Fig. 1. As shown in Fig. 1, powers of all methods increase with the increasing heritability. Figure 1(a) shows that AWRR is the most powerful, followed by CCA and MULVR-O, and MULVR-O is closely comparable to CCA. Model 1 indicates that there is correlation between any two traits. Because the MULVR-O method uses the weighted combination of original traits, for quantitative traits, this phenotypic correlation affects MULVR-O to exclude the noise traits, and thus it suffers loss of power. Figure 1(b) shows that MULVR-O and AWRR perform similarly with power larger than CCA. Figures 1(c) and ( d ) show that, for qualitative traits, MULVR-O performs the best, followed by AWRR, and CCA suffers loss of power, because it is designed for quantitative traits. Without considering the direction of effect of variants, WSRR performs the worst.
Power comparisons for different values of the total heritability in two models. Total number of traits is six and causal variants impact on four traits. One common variant and 10% of rare variants are causal, and 20% of rare causal variants are protective variants. The sample size is 1000 and ρ = 0.5. (a) Multiple quantitative traits under model 1 of simulation design. (b) Multiple quantitative traits under model 2 of simulation design. (c) Multiple qualitative traits under model 1 of simulation design. (d) Multiple qualitative traits under model 2 of simulation design.
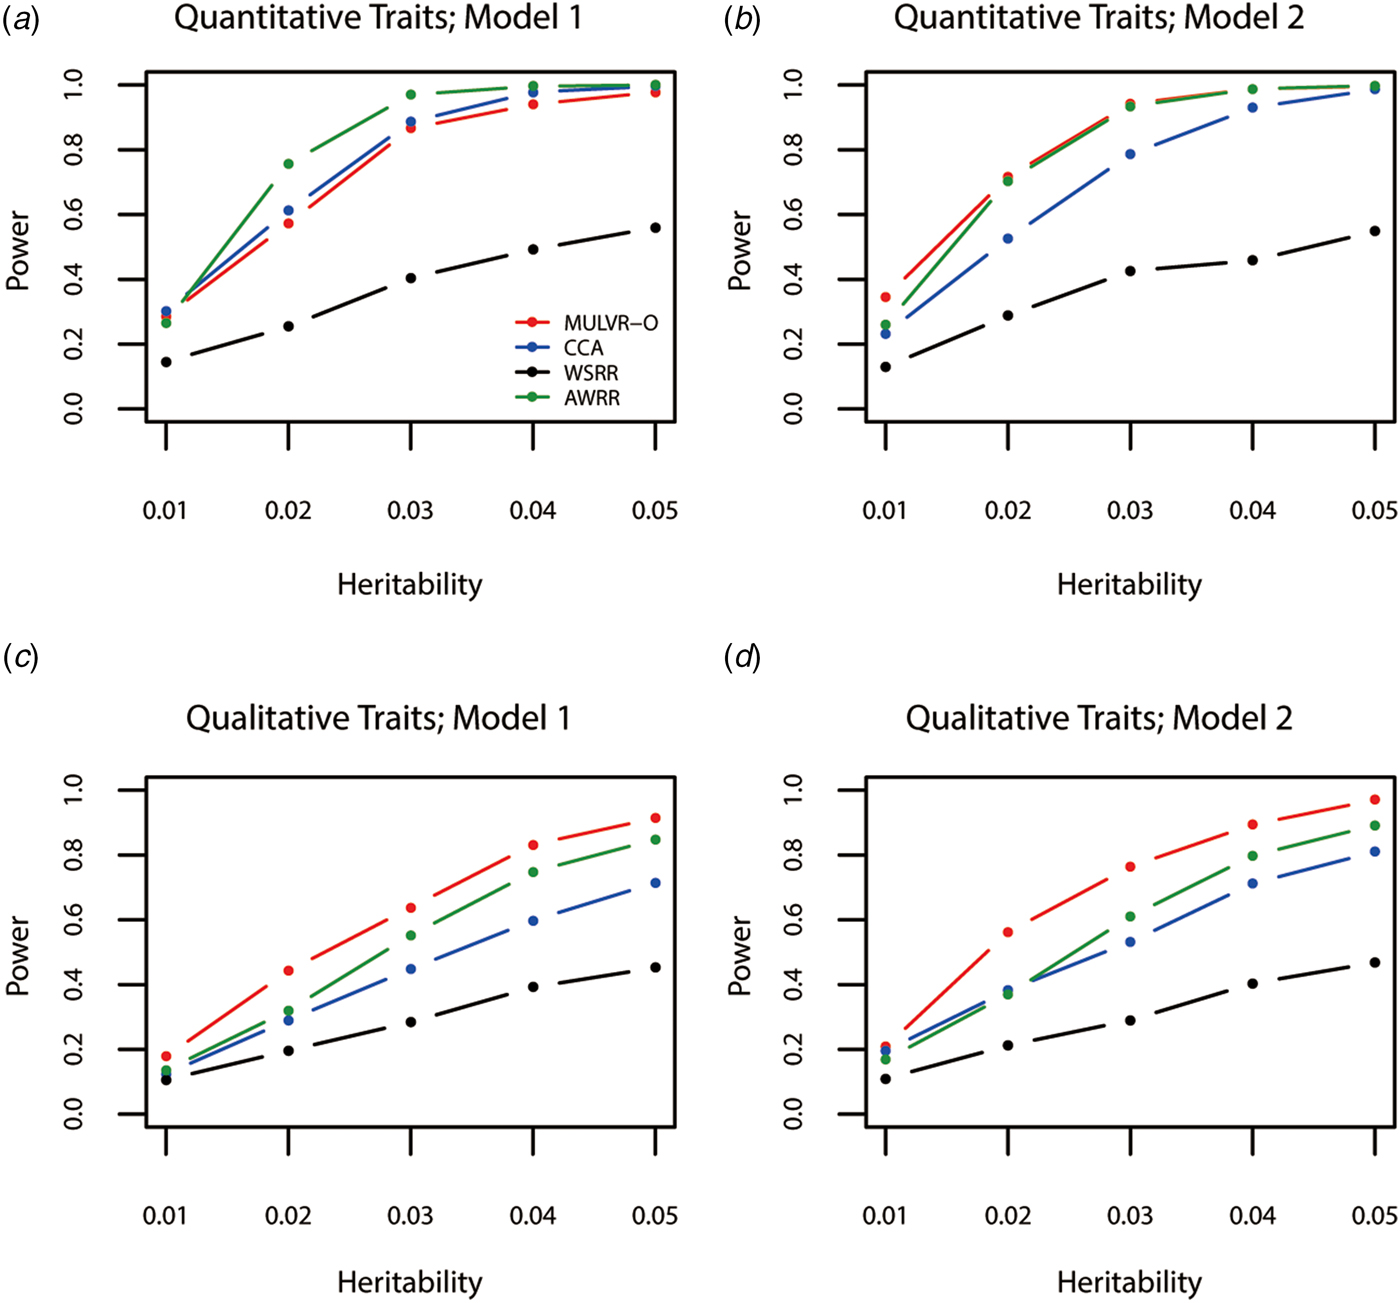
Figure 2 shows power comparisons for different percentages of protective variants. For quantitative traits, except for the WSRR method, the other methods are robust to the percentage of protective variants. For qualitative traits, the powers of all methods decrease with the increase of the percentage of protective variants. According to the researches of Wu et al. (Reference Wu, Lee, Cai, Li, Boehnke and Lin2011) and Wang et al. (Reference Wang, Wang, Sha and Zhang2016), the reason is that protective variants lower MAFs in cases and thus make observing rare variants in cases more difficult. The decrease of power of WSRR is due to the sensitivity to the direction of the effect of variants.
Power comparisons for different percentages of protective variants in two models. Total number of traits is six and causal variants impact on four traits. One common variant and 10% of rare variants are causal, and the total heritability of all causal variants is 0.03. The sample size is 1000 and ρ = 0.5. (a) Multiple quantitative traits under model 1 of simulation design. (b) Multiple quantitative traits under model 2 of simulation design. (c) Multiple qualitative traits under model 1 of simulation design. (d) Multiple qualitative traits under model 2 of simulation design.

Power comparisons for different percentages of causal variants are shown in Fig. 3. As seen in Fig. 3, the three methods (MULVR-O, CCA and AWRR) are relatively robust to the percentage of causal variants, while the power of the WSRR method increases with the increasing percentage of causal variants in most situations.
Power comparisons for different percentages of rare causal variants in two models. Total number of traits is six and causal variants impact on four traits. One common variant is causal, 20% of rare causal variants are protective variants, and the total heritability of all causal variants is 0.03. The sample size is 1000 and ρ = 0.5. (a) Multiple quantitative traits under model 1 of simulation design. (b) Multiple quantitative traits under model 2 of simulation design. (c) Multiple qualitative traits under model 1 of simulation design. (d) Multiple qualitative traits under model 2 of simulation design.
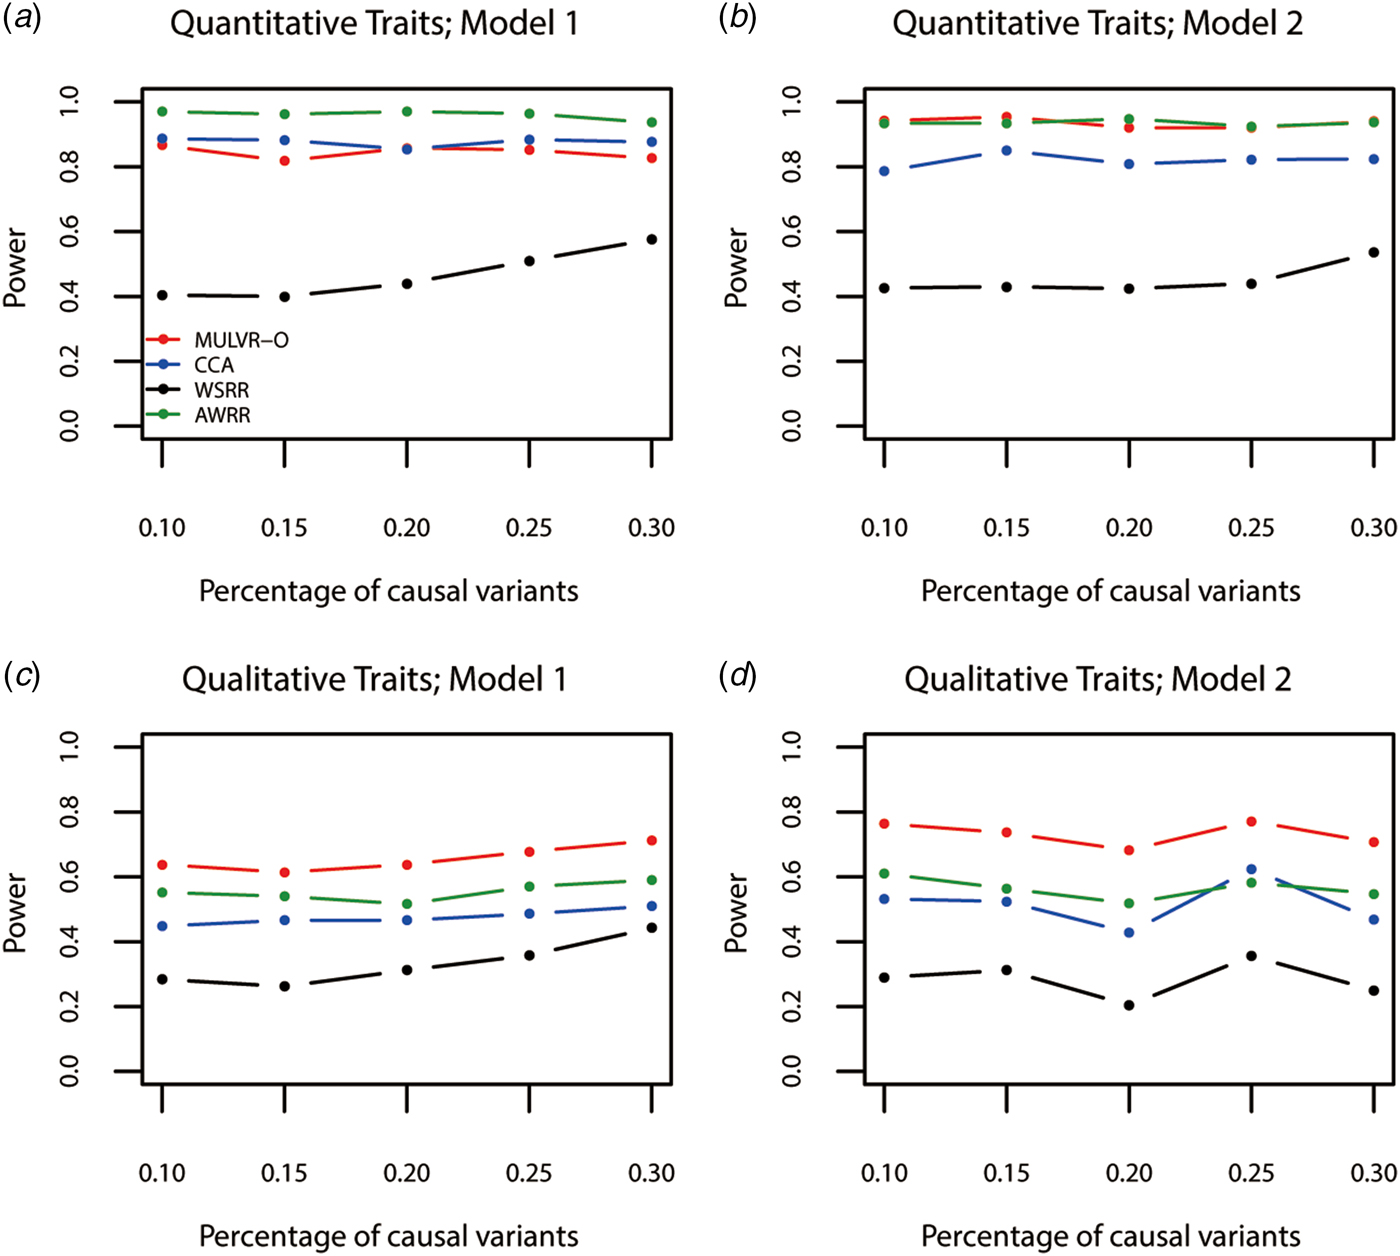
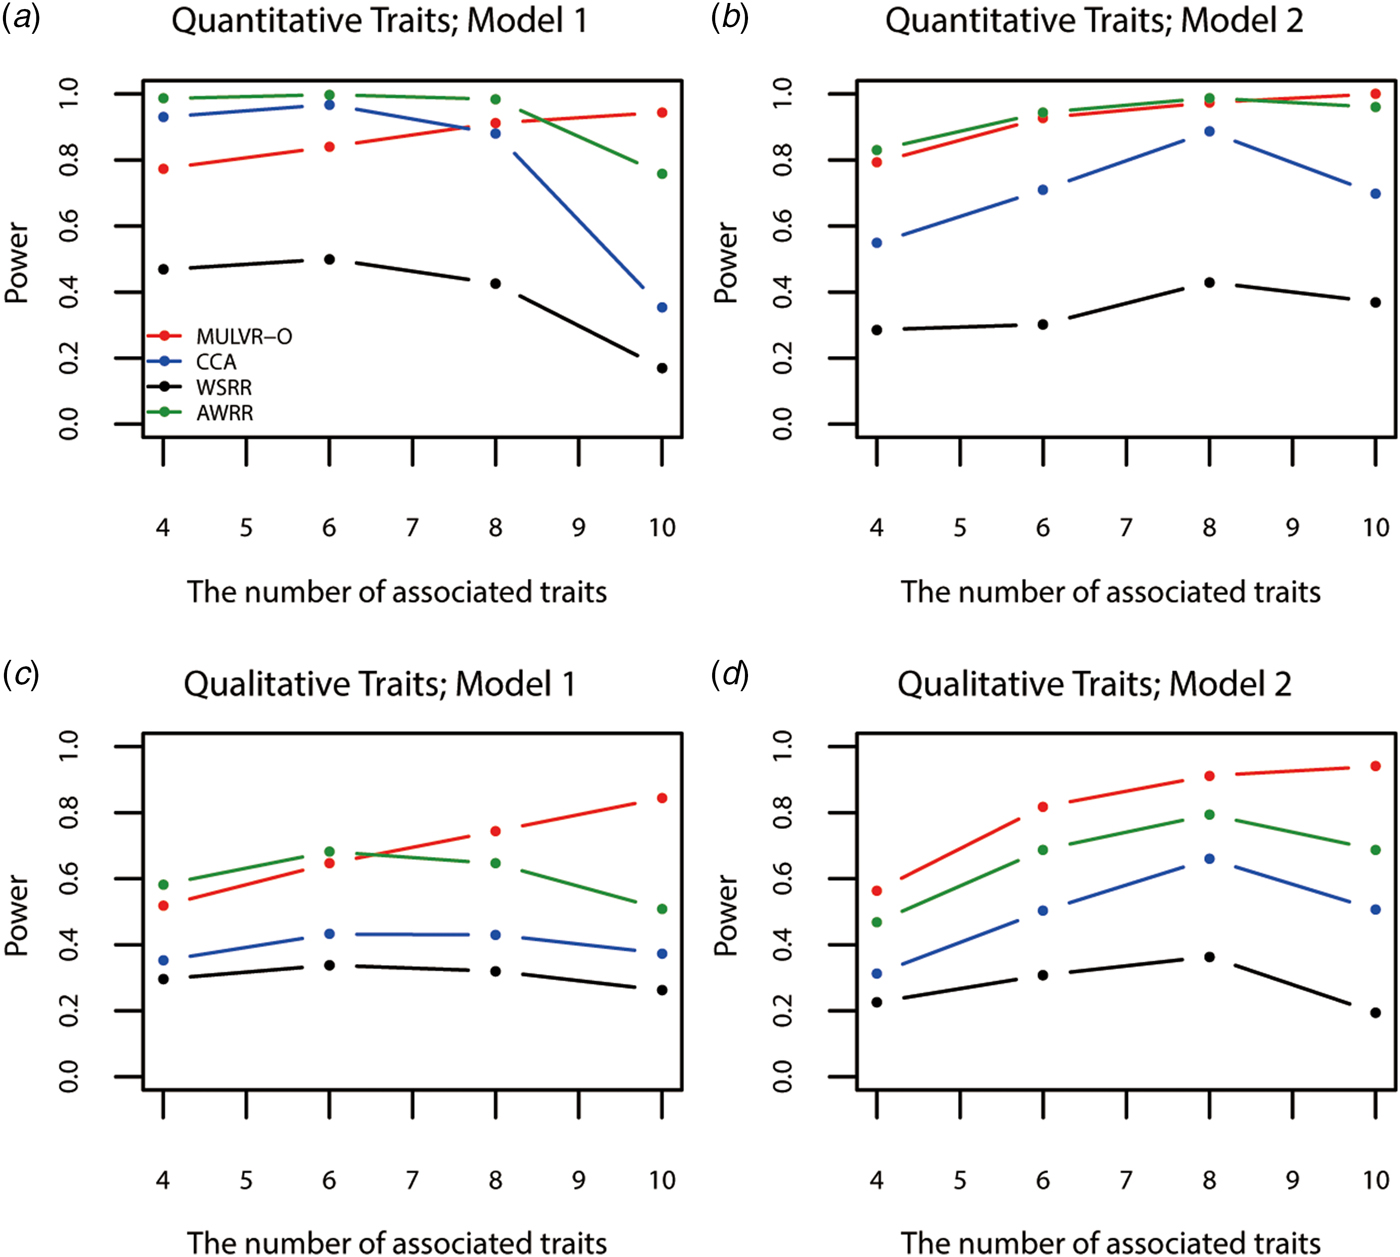
Figure 4 shows power comparisons for different numbers of traits impacted by causal variants. As shown in Fig. 4, the powers of all methods increase with increasing number of traits associated with causal variants, until causal variants impact on all traits, MULVR-O reaches maximum power, while the other three methods suffer loss of power. This performance of CCA is consistent with previous reports (Allison et al., Reference Allison, Thiel, Jean, Elston, Infante and Schork1998; Evans & Duffy, Reference Evans and Duffy2004; Ferreira & Purcell, Reference Ferreira and Purcell2009). AWRR and WSRR use reverse regression method in common. When causal variants affect all traits, the performances of losing power of the two methods coincide with that of reverse regression method reported by Kim & Pan (Reference Kim and Pan2017). Figure 4(a) shows that in model 1, AWRR and CCA are more powerful than MULVR-O in the presence of a large number of noise traits. For quantitative traits, the correlation between any two traits affects the MULVR-O method to exclude the noise traits, and thus it suffers loss of power. AWRR regresses the collapse genotypes on multiple traits, so it depends on those traits associated with causal variants, and is robust to the inclusion of noise traits. According to Tang & Ferreira (Reference Tang and Ferreira2012), when the causal variants influence only a subset of all traits, CCA has larger power. The other three figures show that MULVR-O is either the most powerful test or comparable to the most powerful test.
Power comparisons for different numbers of traits influenced by causal variants in two models. Total number of traits is ten. One common variant and 10% of rare variants are causal, 20% of rare causal variants are protective variants, and the total heritability of all causal variants is 0.03. The sample size is 1000 and ρ = 0.5. (a) Multiple quantitative traits under model 1 of simulation design. (b) Multiple quantitative traits under model 2 of simulation design. (c) Multiple qualitative traits under model 1 of simulation design. (d) Multiple qualitative traits under model 2 of simulation design.
Power comparisons for different sample sizes are given in Fig. 5. This figure shows that powers of all methods increase with increasing sample sizes.
Power comparisons for different sample sizes in two models. Total number of traits is six and causal variants impact on four traits. One common variant and 10% of rare variants are causal, 20% of rare causal variants are protective variants, and the total heritability of all causal variants is 0.03. ρ = 0.5.

When all traits are associated with causal variants, we also compare the powers of the four methods (MULVR, CCA, WSRR and AWRR) for quantitative traits and qualitative traits. These results are given by Supplementary Figures S1–S5. Figure S1 shows that powers of all methods increase with the increasing heritability, MULVR is consistently more powerful than the other three methods, CCA and AWRR suffer loss of power and WSRR is the least powerful. The variation trend of powers in Fig. S2, S3 and S5 are similar to that in Fig. 2, 3 and 5. As shown in Fig. S4, the power of the CCA method decreases with the increasing number of traits, while the powers of the other three methods do not change relatively.
Throughout the simulations, we observed that no method can maintain the highest power across all scenarios, because the performance of a method depends on the type of traits, the number of associated traits, the phenotypic correlation, the percentage of protective variants and the percentage of causal variants. In summary, our proposed method (MULVR-O) remains powerful across a wide range of situations, and in particular, it shows better performance for qualitative traits.
4. Real data analysis
To explore the performance of the five methods (MULVR, MULVR-O, CCA, WSRR and AWRR), we respectively used them to analyse the GAW19 dataset, which includes 1943 Hispanic individuals with whole-exome sequence data, and two phenotypes, SBP and DBP, age, sex and anti-hypertensive medication status. We selected the CHRM3 and SHBG genes in GAW19, which have been reported to be associated with the two phenotypes (SBP and DBP) (Sun et al., Reference Sun, Bhatnagar, Oualkacha, Ciampi and Greenwood2016). We used the hg19 reference as the annotation file to obtain the start and end positions of the two genes, and then used PLINK to extract genotypes of SNPs from the GAW19 dataset. Because many variants in the two genes are very rare, possibly observed only once or twice, we restricted analysis to only the variants that have four or more carriers. Missing genotype values were imputed by the corresponding variant's MAFs. We considered a total of 1851 individuals after removing subjects who had one or both missing phenotypes, and applied a log transformation to SBP and DBP so as to eliminate skewness. Because there were too many missing values for anti-hypertensive medication status, we only used age and sex as covariates. To guard against confounders caused by covariates, the logSBP and logDBP were adjusted for age and sex with a linear regression. The residuals of logSBP and logDBP were treated as new phenotypes. With a significance level of 0.05, significance of the SHBG gene was identified by all the methods. Except for the WSRR method, all methods showed significant association of the CHRM3 gene with SBP and DBP (Table 3).
The results of real data analysis.

Note: P-values were estimated based on 104 permutations.
5. Discussion
In genetic association studies, joint analysis of multiple traits can increase statistical power to detect genetic variants. Currently, the majority of methods are usually suitable for a single common variant or only rare variants. So, in this paper, we analysed association of both rare and common variants with multiple traits by variable reduction method. Extensive simulation studies show that no method can maintain the highest power across all scenarios. When there is correlation between any two traits, the MULVR-O method suffers loss of power for multiple quantitative traits in the presence of a large number of noise traits; when causal variants impact on all traits, AWRR and CCA lose power; CCA and AWRR suffer loss of power for qualitative traits. In summary, our proposed method (MULVR-O) remains powerful across a wide range of situations.
In our proposed method, we used the TOW method proposed by Sha et al. (Reference Sha, Wang, Wang and Zhang2012) to detect rare and common variants associated with a single trait. The TOW method has three important advantages. First, TOW is suitable for detecting both rare and common variants. Second, TOW is robust to the different directions of variants and percentage of neutral variants. Third, TOW can adjust for covariates. Then our method can adjust for covariates according to the TOW method.
It is known that population stratification (PS) often causes spurious associations based on unrelated individuals. Our method is subject to bias in the presence of PS. So we can use principal component approach to guard against the effect of PS, which is one of the issues that continues to need consideration. In addition, we considered applying our method to family-based design, which is robust to PS, and efficient in detecting associations of rare variants. Of course, this issue needs to be further investigated in the future.
Because the asymptotical distribution of the CCA statistic is very conservative for rare variants (Wang et al., Reference Wang, Wang, Sha and Zhang2016), based on the research of Wang et al. (Reference Wang, Wang, Sha and Zhang2016), we used permutation procedure to evaluate the P-value of the CCA statistic. Thus all methods (MULVR, MULVR-O, CCA, WSRR and AWRR) use the permutation procedure to calculate the P-values of test statistics. It is time-consuming for these permutation-based methods to perform genome-wide association studies. Hence, in consideration of computation time, we did not carry out genome-wide association analysis of the GAW19 dataset.
This work was conducted in the framework of Heilongjiang province natural science fund F2016035, basic research expenditure of universities in Heilongjiang Province, special fund of Heilongjiang University (no. HDJCCX-201631). The Genetic Analysis Workshops were supported by GAW grant R01 GM031575 from the National Institute of General Medical Sciences. Preparation of the Genetic Analysis Workshop 17 Simulated Exome Dataset was supported in part by NIH R01 MH059490 and used sequencing data from the 1000 Genomes Project (http://www.1000genomes.org). The GAW19 unrelated data were provided by Type 2 Diabetes Genetic Exploration by Next-generation sequencing in Ethnic Samples (T2D-GENES) Project 1.
Declaration of interest
None.
Supplementary material
The online supplementary material can be found available at https://doi.org/10.1017/S0016672317000052.


