


1. Introduction
In nature, organisms are often exposed to a wide range of fluctuating environmental conditions that may reduce their fitness. Such conditions are often called stress factors (Rion & Kawecki, Reference Rion and Kawecki2007). Organisms deal with stressful environmental conditions by changing their survival strategies, a process that may drive local adaptation (Hoffmann & Parsons, Reference Hoffmann and Parsons1991; Randall et al., Reference Randall, Burggren and French1997). The study of changes in fitness-related traits across habitats is essential to our understanding of adaptation and biogeographic patterns of organisms exposed to marked environmental seasonal variation. Hence, it is crucial to explore phenotypic variation in adaptive traits and their underlying genetic basis in order to predict potential phenotypic shifts triggered by local adaptation.
Usually, species that inhabit temperate areas are exposed to seasonal food shortage. Consequently, the ability to survive periods of food shortage is one of the most important stress traits. In Drosophila, starvation resistance (SR) is an adult fitness component that acquires special relevance during adverse periods, like winters in temperate regions (Izquierdo, Reference Izquierdo1991; Mitrovski & Hoffmann, Reference Mitrovski and Hoffmann2001; Boulétreau-Merle & Fouillet, Reference Boulétreau-Merle and Fouillet2002). SR is governed by many genes and influenced by environmental factors (Service & Rose, Reference Service and Rose1985; Da Lage et al., Reference Da Lage, Capy and David1990; Karan et al., Reference Karan, Dahiya, Munjal, Gibert, Moreteau, Parkash and David1998; Harbison et al., Reference Harbison, Yamamoto, Fanara, Norga and Mackay2004; Hoffmann et al., Reference Hoffmann, Shirriffs and Scott2005) and, a number of studies have shown that it is correlated with several life-history traits such as fecundity (Service & Rose, Reference Service and Rose1985; Leroi et al., Reference Leroi, Chen and Rose1994a, Reference Leroi, Chippindale and Rose1994b), lifespan (Service et al., Reference Service, Hutchinson, Mackinley and Rose1985; Force et al., Reference Force, Staples, Soliman and Arking1995; Lin et al., Reference Lin, Seroude and Benzer1998; Archer et al., Reference Archer, Phelan, Beckman and Rose2003), developmental time (Chippindale et al., Reference Chippindale, Chu and Rose1996; Harshman et al., Reference Harshman, Hoffmann and Clark1999) and viability (Chippindale et al., Reference Chippindale, Chu and Rose1996), suggesting a complex genetic architecture in which pleiotropy plays a pervasive role. Furthermore, the fact that SR is a sexually dimorphic trait, adds an additional level of complexity in the genotype–phenotype map (Hansen, Reference Hansen2006; Rion & Kawecki, Reference Rion and Kawecki2007).
A screening of P-element insertion lines revealed that a large number of genes affect SR and, also, that several of these genes have sex-specific effects (Harbison et al., Reference Harbison, Yamamoto, Fanara, Norga and Mackay2004). These results suggest both a different genetic basis for SR in females and males, and that variation in the sexual dimorphism (SD) has a genetic basis, highlighting the fundamental role that genotype by sex interactions may play in the evolution of natural genetic variation in SR.
Most surveys of variation in SR in natural populations of D. melanogaster aimed at unveiling geographical trends and, in some cases, assessed correlations with other traits such as lipid content (Robinson et al., Reference Robinson, Zwaan and Partridge2000; Hoffmann et al., Reference Hoffmann, Hallas, Sinclair and Mitrovski2001). However, studies addressing the relative contribution of within and among populations variation to overall variance and/or providing estimates of genetic components of variance in experimental flies raised in common garden conditions are scarce (but see Hoffmann et al., Reference Hoffmann, Hallas, Sinclair and Mitrovski2001).
One of the objectives of the present paper is to investigate variation in SR in nine natural populations of D. melanogaster sampled in western Argentina, and the apportionment of total phenotypic variation at two different geographic scales, within and among populations. We show that natural populations harbour substantial amount of genetic variation and that a significant fraction of SR variation may be accounted for by differences among populations. In addition, we also show that the genotype by sex interaction constitutes a significant component of natural genetic variation indicating that this factor may be involved in the maintenance of SR variation in nature. We also obtain estimates of cross-sex genetic correlations in order to evaluate the evolutionary potential of the SD in SR.
2. Materials and methods
(i) Drosophila melanogaster stocks
Flies were collected by means of net sweeping on fermented banana baits in nine localities along a north–south transect in Argentina (Table 1). Upon arrival to the laboratory, inseminated females collected in the field were isolated in individual vials to establish lines by rearing their respective progenies. All lines were maintained for ten generations in glass vials containing cornmeal–molasses–agar medium under a regime of constant temperature (25°C), humidity (70%) and 12 h light/dark cycle before the onset of the experiments described below. Eight to sixteen lines from each locality were randomly chosen from the sets of lines for the analysis of SR (Table 1).
Table 1. Mean SR±SE (in hours) in females and males in nine populations of D. melanogaster from Argentina along with information of geographical coordinates
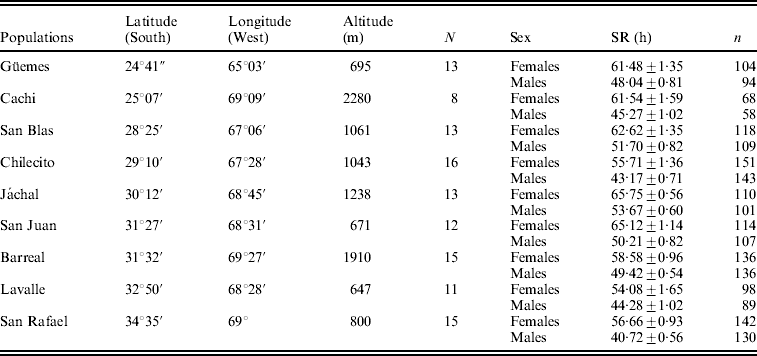
N: number of lines analysed.
n: number of vials analysed for each population and sex.
(ii) SR assays
We measured SR as the time elapsed (in hours) from the moment in which flies were exposed to a starvation diet until death. Starvation diet consisted of 5 ml of 1·7% agar in water that provided moisture but not food, in standard culture vials. For each line, 200 sexually mature flies of both sexes were released in egg-collecting chambers. In each chamber, a Petri dish containing an egg-laying medium (2% agar in distilled water and baker's yeast) was used for egg collection. Petri dishes were removed after 12 h and incubated at 25°C until egg hatching (approximately 24 h). First-instar larvae were transferred to 10 vials (30 individuals per vial) containing cornmeal–molasses–agar medium. Adult flies were recovered from the vials and separated by sex under CO2 anaesthesia and then transferred to vials before the SR assays. Groups of ten 2–7 day-old non-virgin flies were transferred to the vials in which SR was assessed (see also Harbison et al., Reference Harbison, Yamamoto, Fanara, Norga and Mackay2004). Seven to ten replicated vials were set up per line and sex. All replicates were incubated at a constant temperature of 25°C under a 12 h light/dark cycle. Survival was scored daily at 8.00 h, 14.00 h and 20.00 h, until the death of all flies. Scores of SR for each individual fly were used to estimate mean survival time per replicate which was the variable considered in all statistical analysis.
(iii) Statistical analyses
The full data set was initially explored using a mixed three-way analysis of variance (ANOVA), to investigate the contribution of population, lines (nested in populations) and sex to total phenotypic variance, an approach that is commonly used in quantitative genetic studies (see, for instance, Lavagnino et al., Reference Lavagnino, Anholt and Fanara2008; Ballard et al., Reference Ballard, Melvin and Simpson2008; Kenny et al., Reference Kenny, Wilton and Ballard2008), according to the model:
where u is the overall mean, P and L(P) are the random effects of population and line (nested in population), respectively, S is the fixed effect of sex, and E is the error, which according to our experimental design corresponds to the among replicate variance.
Additional ANOVAs were performed for each population separately according to the model:
In these ANOVAs, a significant L effect may be interpreted as an estimate of the genetic component of phenotypic variance, since lines (families) may be considered as different genotypes (David et al., Reference David, Gibert, Legout, Petavy, Capy and Moreteau2005). Likewise, the line by sex interaction (L×S) may be considered as an estimate of the genotype by sex interaction (G×S). A significant G×S interaction may be interpreted as variation in the SD across genotypes and detected as deviations from the perfect genetic correlation between sexes (Muir et al., Reference Muir, Nyquist and Xu1992).
To estimate the cross-sex genetic correlation in each population we used the equation:
where Covmf represents the covariance between males and females, calculated by means of the bivariate ANOVAs and σm and σf are the square roots of the among lines variance components obtained from univariate ANOVAs performed for males and females, respectively.
(iv) Estimation of quantitative genetics parameters
We estimated quantitative genetic parameters for each natural population and for females and males, separately. Under our experimental design, the contribution of the variance component among lines (σ2 L) may be considered as an estimate of genetic variance (V G) (Lynch & Walsh, Reference Lynch and Walsh1998; Morgan & Mackay, Reference Morgan and Mackay2006). Environmental variance (V E) was estimated from the error term. Finally, total phenotypic variance (V P) was calculated as V G+V E (Falconer & Mackay, Reference Falconer and Mackay1996; Lynch & Walsh, Reference Lynch and Walsh1998).
To facilitate comparisons between sexes and among populations, we calculated the genetic coefficients of variation using the equation:
where Û is the SR population mean. This procedure is based on the notion that trait means, rather than variances, are more appropriate for standardizing genetic variance when the objective is to compare among traits and/or populations (Houle, Reference Houle1992).
Statistical analyses and estimates of variance components of random effects were performed using GLM and VARCOMP procedure, respectively, implemented in the STATISTICA 8.0 software package (StatSoft, Inc., 2007).
3. Results
The mean values of survival in males and females under starvation are shown in Table 1. The general ANOVA revealed that differences among populations, between sexes and among lines (within populations), as well as the line by sex interaction were significant. Females (60.4 h) were, on average, significantly more resistant than males (47.5 h) (F 1, 108=181·8, P<0·00001), a pattern that was homogeneous across populations as indicated by the non-significant population by sex interaction (F 8, 108=0·94, P=0·48). The population effect was significant and accounted for 7·2% of total phenotypic variance, suggesting that the genetic factors that orchestrate variation in SR vary among sampling localities (F 8, 108=2·34, P=0·023).
We also tested for clinal variation by means of multiple regression analyses of SR on geographic (latitude and altitude) and climatic variables (mean annual temperature; mean annual maximum and minimum temperature). This analysis revealed that among populations differentiation did not show any significant trend (F 2, 7=0·41, P=0·67).
In addition, the general ANOVA showed that the line (47·8%) and the line by sex interaction (32·1%) effects were significant and accounted, jointly, for 80% of overall phenotypic variance (F 108, 1776=85·14, P<0·00001; F 108, 1776=22·15, P<0·00001, respectively).
We studied the relative contribution of differences among lines (genetic variance) and the line by sex interaction (genotype by sex interaction) to total phenotypic variation in each individual population to investigate whether the trends detected by the general ANOVA are homogeneous across populations. The results of the ANOVAs revealed that sex, line and the line by sex interaction were significant in most cases (Table 2). Differences among lines were highly significant in six out of nine populations (Table 2) suggesting that D. melanogaster populations harbour substantial amount of genetic variation in SR. The line by sex interaction term was significant in all populations (Table 2) indicating sex-specific variation in SR among lines, or, in other words that variation in the SD has a genetic basis.
Table 2. Relative contribution of each source of variation to total phenotypic variation for SR in each population
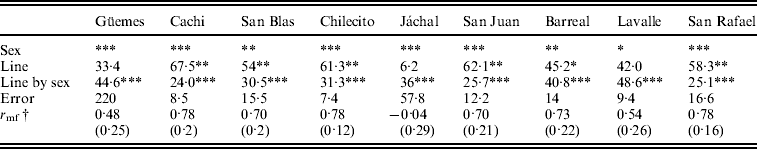
† Cross-sex genetic correlation coefficient (SE).
Significance level: * P<0·05, **P<0·01 and ***P<0·001.
A significant line by sex interaction term may be due to deviations from the perfect genetic correlation across sexes (in other words, changes in the ranking order of lines across sexes) and/or when variance among lines differs across sexes (Robertson, Reference Robertson1959). Further analyses of the line by sex interaction showed that the above mentioned components contributed almost equally to the interaction in most populations analysed (data not shown).
We also calculated the SD in SR using a female/male ratio for each population using the mean values given in Table 1. SD ranged from 1·18 to 1·39, meaning that females survived, on average 27% longer than males. We further analysed the SD data by means of an ANOVA with population and line (within population) as main sources of variation. The ANOVA revealed that differences among populations were not significant, whereas differences among lines were highly significant and accounted for 66% of total variance (data not shown).
The cross-sex genetic correlation, r mf, may also be used to determine to what extent the same genes affect a certain trait in females and males. An r mf equal to one indicates that the same genes are involved in trait variation in both sexes, while an r mf close to zero indicates that sets of genes affecting the trait in males and females are completely different (Falconer, Reference Falconer1952). r mfvaried among populations and in most cases differed significantly from zero and from unity. The lowest value was detected in Jáchal and the highest in Cachi and San Rafael. However, r mf differed from one but not from zero in Jáchal, Güemes and Lavalle. We can use the results of the ANOVAs given in Table 2 to examine this issue, since the cross-sex genetic correlation was significantly different from unity when the line by sex interaction was significant, whereas it was significantly different from zero when the line term was significant.
Estimates of quantitative genetic parameters provided a supplementary view of patterns of variation in SR in each natural population and in the SD (Table 3). As expected, estimates of V G were large (Table 3) and varied widely among populations, with Chilecito and Jáchal showing the highest and lowest values, respectively. Moreover, estimates of V G and V P were larger in females than in males confirming the trends described above. However, estimates of V E were invariably lower than V G and quite similar between sexes (Table 3). These results are certainly a consequence of our experimental design, since flies were reared under controlled conditions of density, temperature, humidity and photoperiod to minimize environmental variation. Another plausible explanation for the low V E is that we considered the vial as the experimental unit, implying that the input data consisted of the average of 10 observations per vial.
Table 3. Estimates of quantitative genetic parameters of SR for each population in females and males
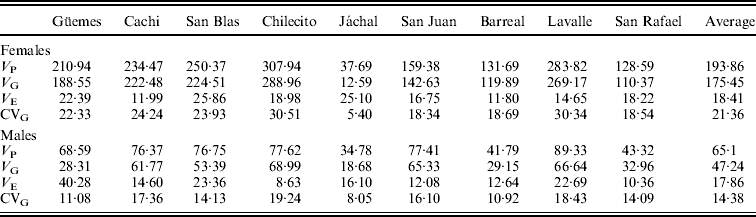
V P: phenotypic variance; V G: genetic variance; V E: environmental variance; CVG: genetic coefficient of variation.
A similar pattern was detected for the genetic coefficient of variation (CVG), which ranged from 5·4% to 30·5% in females and from 8% to 19·2% in males (Table 3).
4. Discussion
Our study of SR variation in nine natural populations of D. melanogaster from Argentina revealed that populations harbour a substantial amount of genetic variation and that populations are slightly (though significantly) differentiated in their ability to survive to food shortage. Differentiation among populations in SR may be an adaptive response to environmental heterogeneity and/or the result of demographic processes. Unfortunately, we do not have any direct evidence to rule out demographic factors. However, it is noteworthy that most populations studied here were also assessed for larval and adult olfactory behaviour and developmental time showing extensive among population differentiation (Lavagnino et al., Reference Lavagnino, Anholt and Fanara2008; Folguera et al., Reference Folguera, Ceballos, Spezzi, Fanara and Hasson2008; Mensch et al., Reference Mensch, Carreira, Lavagnino, Goenaga, Folguera, Hasson and Fanara2010). Taking into consideration that non-adaptive processes (demographic and historical) are expected to equally affect all traits, the dissimilar patterns of geographic variation observed across traits studied so far suggest that non-adaptive processes cannot be responsible for the among populations variation in SR.
Moreover, differentiation among populations did not correlate with geographic (latitude nor altitude) nor climatic variables, suggesting that the ability to survive during periods of food shortage does not correlate with ecologically relevant variables that covary with latitude or altitude or climatic variables. One possible explanation for the absence of clinal trends is that the availability of feeding resources (rotting fruits in orchards and vineyards) does not covary with latitude or altitude. We should also consider the possibility that limitations of the sampling strategy may account for the failure to detect clines. However, populations were sampled over an area encompassing an ample range of latitude (12°) and altitude (1600 m) uncovering wide spectrum of habitats involving different types of fruits (see Lavagnino et al., Reference Lavagnino, Anholt and Fanara2008 for details). Our results are concordant with previous reports that also failed to find evidences of latitudinal clines in SR in other areas of D. melanogaster vast distribution (Robinson et al., Reference Robinson, Zwaan and Partridge2000; Hoffmann et al., Reference Hoffmann, Shirriffs and Scott2005). Nevertheless, negative latitudinal clines for SR were reported for D. melanogaster and other Drosophila species in India, as well as for D. simulans in Australia (Karan & Parkash, Reference Karan and Parkash1998; Karan et al., Reference Karan, Dahiya, Munjal, Gibert, Moreteau, Parkash and David1998; Arthur et al., Reference Arthur, Weeks and Sgrò2008). Our results suggest that trends of geographic variation in SR vary greatly across continents.
The study of the apportionment of genetic variation across different geographic scales may help to understand how natural genetic variation for quantitative traits is organized and the evolutionary processes involved. Our study shows that within population variation explains a greater proportion of SR variation than among populations, a pattern that is consistent with observations in Australian D. melanogaster and other species as D. simulans and D. birchii from the same area (Hoffmann et al., Reference Hoffmann, Hallas, Sinclair and Mitrovski2001; Griffiths et al., Reference Griffiths, Schiffer and Hoffmann2005; Arthur et al., Reference Arthur, Weeks and Sgrò2008). Taking into consideration all these evidences, we suggest that the large amount of genetic variation within populations may be a common feature of stress resistance traits.
We also detected a clear SD in SR; females outlived males under starving conditions, a pattern that was consistent across all populations surveyed. SD is presumed to be the result of natural selection favouring different optimal character states in the two sexes (Fairbairn et al., Reference Fairbairn, Blanckenhorn and Székely2007). Thus, the SD in SR may be explained by sex-specific expression in reproductive traits correlated with SR. In Drosophila, SR has been shown to be correlated with egg production (Chippindale et al., Reference Chippindale, Leroi, Kim and Rose1993; Salmon et al., Reference Salmon, Marx and Harshman2001), ovariole number (Wayne et al., Reference Wayne, Soundararajan and Harshman2006) and the ability to enter in reproductive diapause (Schmidt et al., Reference Schmidt, Matzkin, Ippolito and Eanes2005). In contrast, several male reproductive aspects such as the production of accessory gland fluids and sperm and courtship are not correlated with SR (Cordts & Partridge, Reference Cordts and Partridge1996). However, it is known that the expression of some male accessory gland proteins is affected by the absence of food, leading to a decrease in male reproductive success (Harbison et al., Reference Harbison, Chang, Kamdar and Mackay2005; Fricke et al., Reference Fricke, Bretman and Chapman2008). Alternatively, the SD in SR may result from differences in basic physiological processes that determine the allocation of limiting energy reserves between survival and reproduction (Service et al., Reference Service, Hutchinson, Mackinley and Rose1985; van Noordwijk & de Jong, Reference van Noordwijk and de Jong1986; Chippindale et al., Reference Chippindale, Leroi, Kim and Rose1993; Zwaan et al., Reference Zwaan, Bijlsma and Hoekstra1995; Magwere et al., Reference Magwere, Chapman and Partridge2004; Harbison et al., Reference Harbison, Chang, Kamdar and Mackay2005).
Interestingly, estimates of quantitative genetic parameters also differed between sexes. Again females showed larger values than males in all populations. Such dissimilarity may denote differential constraints imposed by genetic correlations with other complex traits, indicating differences in the genetic architecture of SR across sexes. In our work, measures of SR were obtained in non-virgin females, and, thus, differences in the reproductive status among females could be a plausible explanation for the sex-specificity observed.
Our study detected noticeable changes in the magnitude of the SD among genotypes (lines) in all populations, as shown by the significant contribution of the G×S interaction to total phenotypic variation. A previous study using P-element insertion lines identified a large number of genes that affected the expression of SR and revealed that many of these genes exhibited a clear sex-specific effect (Harbison et al., Reference Harbison, Yamamoto, Fanara, Norga and Mackay2004). In this sense, the significant G×S interaction detected in our study provides evidence that the sex-specific effect detected in P-element insertion lines (Harbison et al., Reference Harbison, Yamamoto, Fanara, Norga and Mackay2004) is also present in natural populations. Therefore, it might be argued that even though natural selection may act upon genetic factors involved in the G×S interaction, still would explain a high percentage of variation in nature. Indeed, G×S may be a key factor in the maintenance of genetic variation in SR in nature.
Homologous traits in females and males usually covary (Poissant et al., Reference Poissant, Wilson and Coltman2009), because they are typically influenced by the same genes (Roff, Reference Roff1997). Therefore, sex-specific selection may preclude that males and females reach an optimum phenotype (Lande, Reference Lande1980). In this sense, the cross-sex genetic correlation, r mf, is a quantitative genetic parameter that may be used to predict the potential for independent evolution of sexes (Bonduriansky & Chenoweth, Reference Bonduriansky and Chenoweth2009). Additionally, r mf may indicate to what extent the same traits are affected by the same set of genes in each sex. In our study, cross-sex genetic correlations were positive but significantly lower than unity, suggesting a certain degree of genetic independence between sexes. Such independence may allow further evolution of the SD in SR.
The authors thank T. Morgan for critical reading of previous versions of this paper. We also express our appreciation to the editor W. G. Hill and two anonymous reviewers for insightful comments and suggestions that helped to improve previous version of the manuscript. This work was supported with grants awarded by ANPCyT, CONICET and Universidad de Buenos Aires (Argentina). JG is a recipient of a scholarship and JJF and EH are members of Carrera de Investigador Cientifico of CONICET (Argentina).


