


1. Introduction
Tracing crustal thickness through deep time is key to understanding orogenic evolution, as the thickness of the overriding plate is sensitive to tectonic transitions, such as shifts between trench retreat and advance along convergent plate boundaries (Luffi & Ducea, Reference Luffi and Ducea2022; Profeta et al. Reference Profeta, Ducea, Chapman, Paterson, Gonzales, Kirsch, Petrescu and DeCelles2015; Sundell et al. Reference Sundell, George, Carrapa, Gehrels, Ducea, Saylor and Pepper2022; Tang et al. Reference Tang, Ji, Chu, Wu and Chen2020; Zhu et al. Reference Zhu, Wang, Cawood, Zhao and Mo2017). Recently, several proxies based on trace elements in arc magmas, such as LaN/YbN and Sr/Y ratios, have been proposed to estimate crustal thickness. These proxies are based on the assumption that thicker arc crust generally shows higher LaN/YbN or Sr/Y ratios, due to the fractionation of garnet and/or amphibole during magma differentiation in deeper crustal environments (Chapman et al. Reference Chapman, Ducea, DeCelles and Profeta2015; Luffi & Ducea, Reference Luffi and Ducea2022; Profeta et al. Reference Profeta, Ducea, Chapman, Paterson, Gonzales, Kirsch, Petrescu and DeCelles2015; Zhu et al. Reference Zhu, Wang, Cawood, Zhao and Mo2017). These methods have been successfully applied to reconstruct crustal thickness in both modern and ancient orogens, such as Tibet and the central Andes (Profeta et al. Reference Profeta, Ducea, Chapman, Paterson, Gonzales, Kirsch, Petrescu and DeCelles2015; Zhu et al. Reference Zhu, Wang, Cawood, Zhao and Mo2017). Alternatively, Nd-Hf isotope evolution in arc magmas has also been used to trace subduction dynamics (such as the advance and retreat of subduction zones) in regions like eastern Australia and Central Asia given that crustal thickening can lead to increased crustal input into the magma, and episodes of crustal extension typically result in a greater contribution of mantle-derived juvenile materials to the magma (Collins et al. Reference Collins, Belousova, Kemp and Murphy2011; Han et al. Reference Han, Zhao, Cawood, Sun, Eizenhöfer, Hou, Zhang and Liu2016; Kemp et al. Reference Kemp, Hawkesworth, Collins, Gray and Blevin2009; Li et al. Reference Li, Sun, Shu, Yuan, Jiang, Zhang and Cai2019; Zhang et al. Reference Zhang, Zhao, Sun, Eizenhöfer, Han, Hou, Liu, Wang, Liu and Xu2016). However, the time-shifted Hf and Nd isotope evolution observed in the Sierra Nevada batholith of the Cordilleran orogen has been linked to variable contributions of fertile materials to the magma, driven by cyclical changes in lithosphere fertility and foundering, rather than trench migration (Chapman & Ducea, Reference Chapman and Ducea2019). A recent study of the Patagonian Andes suggests a potential decoupling between isotopic trends and tectonic transitions (Rey et al. Reference Rey, Malkowski, Fosdick, Dobbs, Calderón, Ghiglione and Graham2024), challenging the use of isotopic records to track tectonic shifts. This apparent discrepancy between trace element and isotope proxies in tracking crustal thickness can be further evaluated by comparing LaN/YbN trends with Nd-Hf isotope evolution in the same region.
In this study, we investigate the westernmost Mongol-Okhotsk Orogen (Hangay Mountains) to evaluate the reliability of Nd-Hf isotopes in tracing variations in crustal thickness. Our results reveal a decoupling between the Nd-Hf isotopic evolution of the Permian–Triassic Hangay Batholith and changes in crustal thickness, highlighting the limitations of using isotopic records to track transitions between extensional and contractional tectonic regimes.
2. Geological setting
The Mongol-Okhotsk Orogen extends from the Hangay Mountains (central Mongolia) to the Okhotsk Sea (Fig. 1). It shows a U-shaped geometry in a map view, which was referred as to the Mongolian Orocline or the Tuva-Mongolian Orocline (Li et al. Reference Li, Sun, Narantsetseg, Jourdan, Hu and Yuan2022; Van der Voo et al. Reference Van der Voo, van Hinsbergen, Domeier, Spakman and Torsvik2015; Xiao et al. Reference Xiao, Windley, Sun, Li, Huang, Han, Yuan, Sun and Chen2015). Precambrian microcontinental blocks, Late Neoproterozoic to Palaeozoic accretionary complexes, and Permian to Jurassic magmatism in the Mongol-Okhotsk Orogen are spatially distributed around the Mongolian Orocline (Fig. 1). In the Early Permian, an Andean-type subduction system was established around the whole Mongolian Orocline (Badarch et al. Reference Badarch, Cunningham and Windley2002; Donskaya et al. Reference Donskaya, Gladkochub, Mazukabzov and Ivanov2013; Wang et al. Reference Wang, Tong, Xiao, Guo, Windley, Donskaya, Li, Tserendash and Zhang2022). This subduction system was likely terminated in the Jurassic as the development of the Mongolian orocline and the closure of the Mongol-Okhotsk Ocean (Van der Voo et al. Reference Van der Voo, van Hinsbergen, Domeier, Spakman and Torsvik2015; Zhao et al. Reference Zhao, Xu and Chen2023).
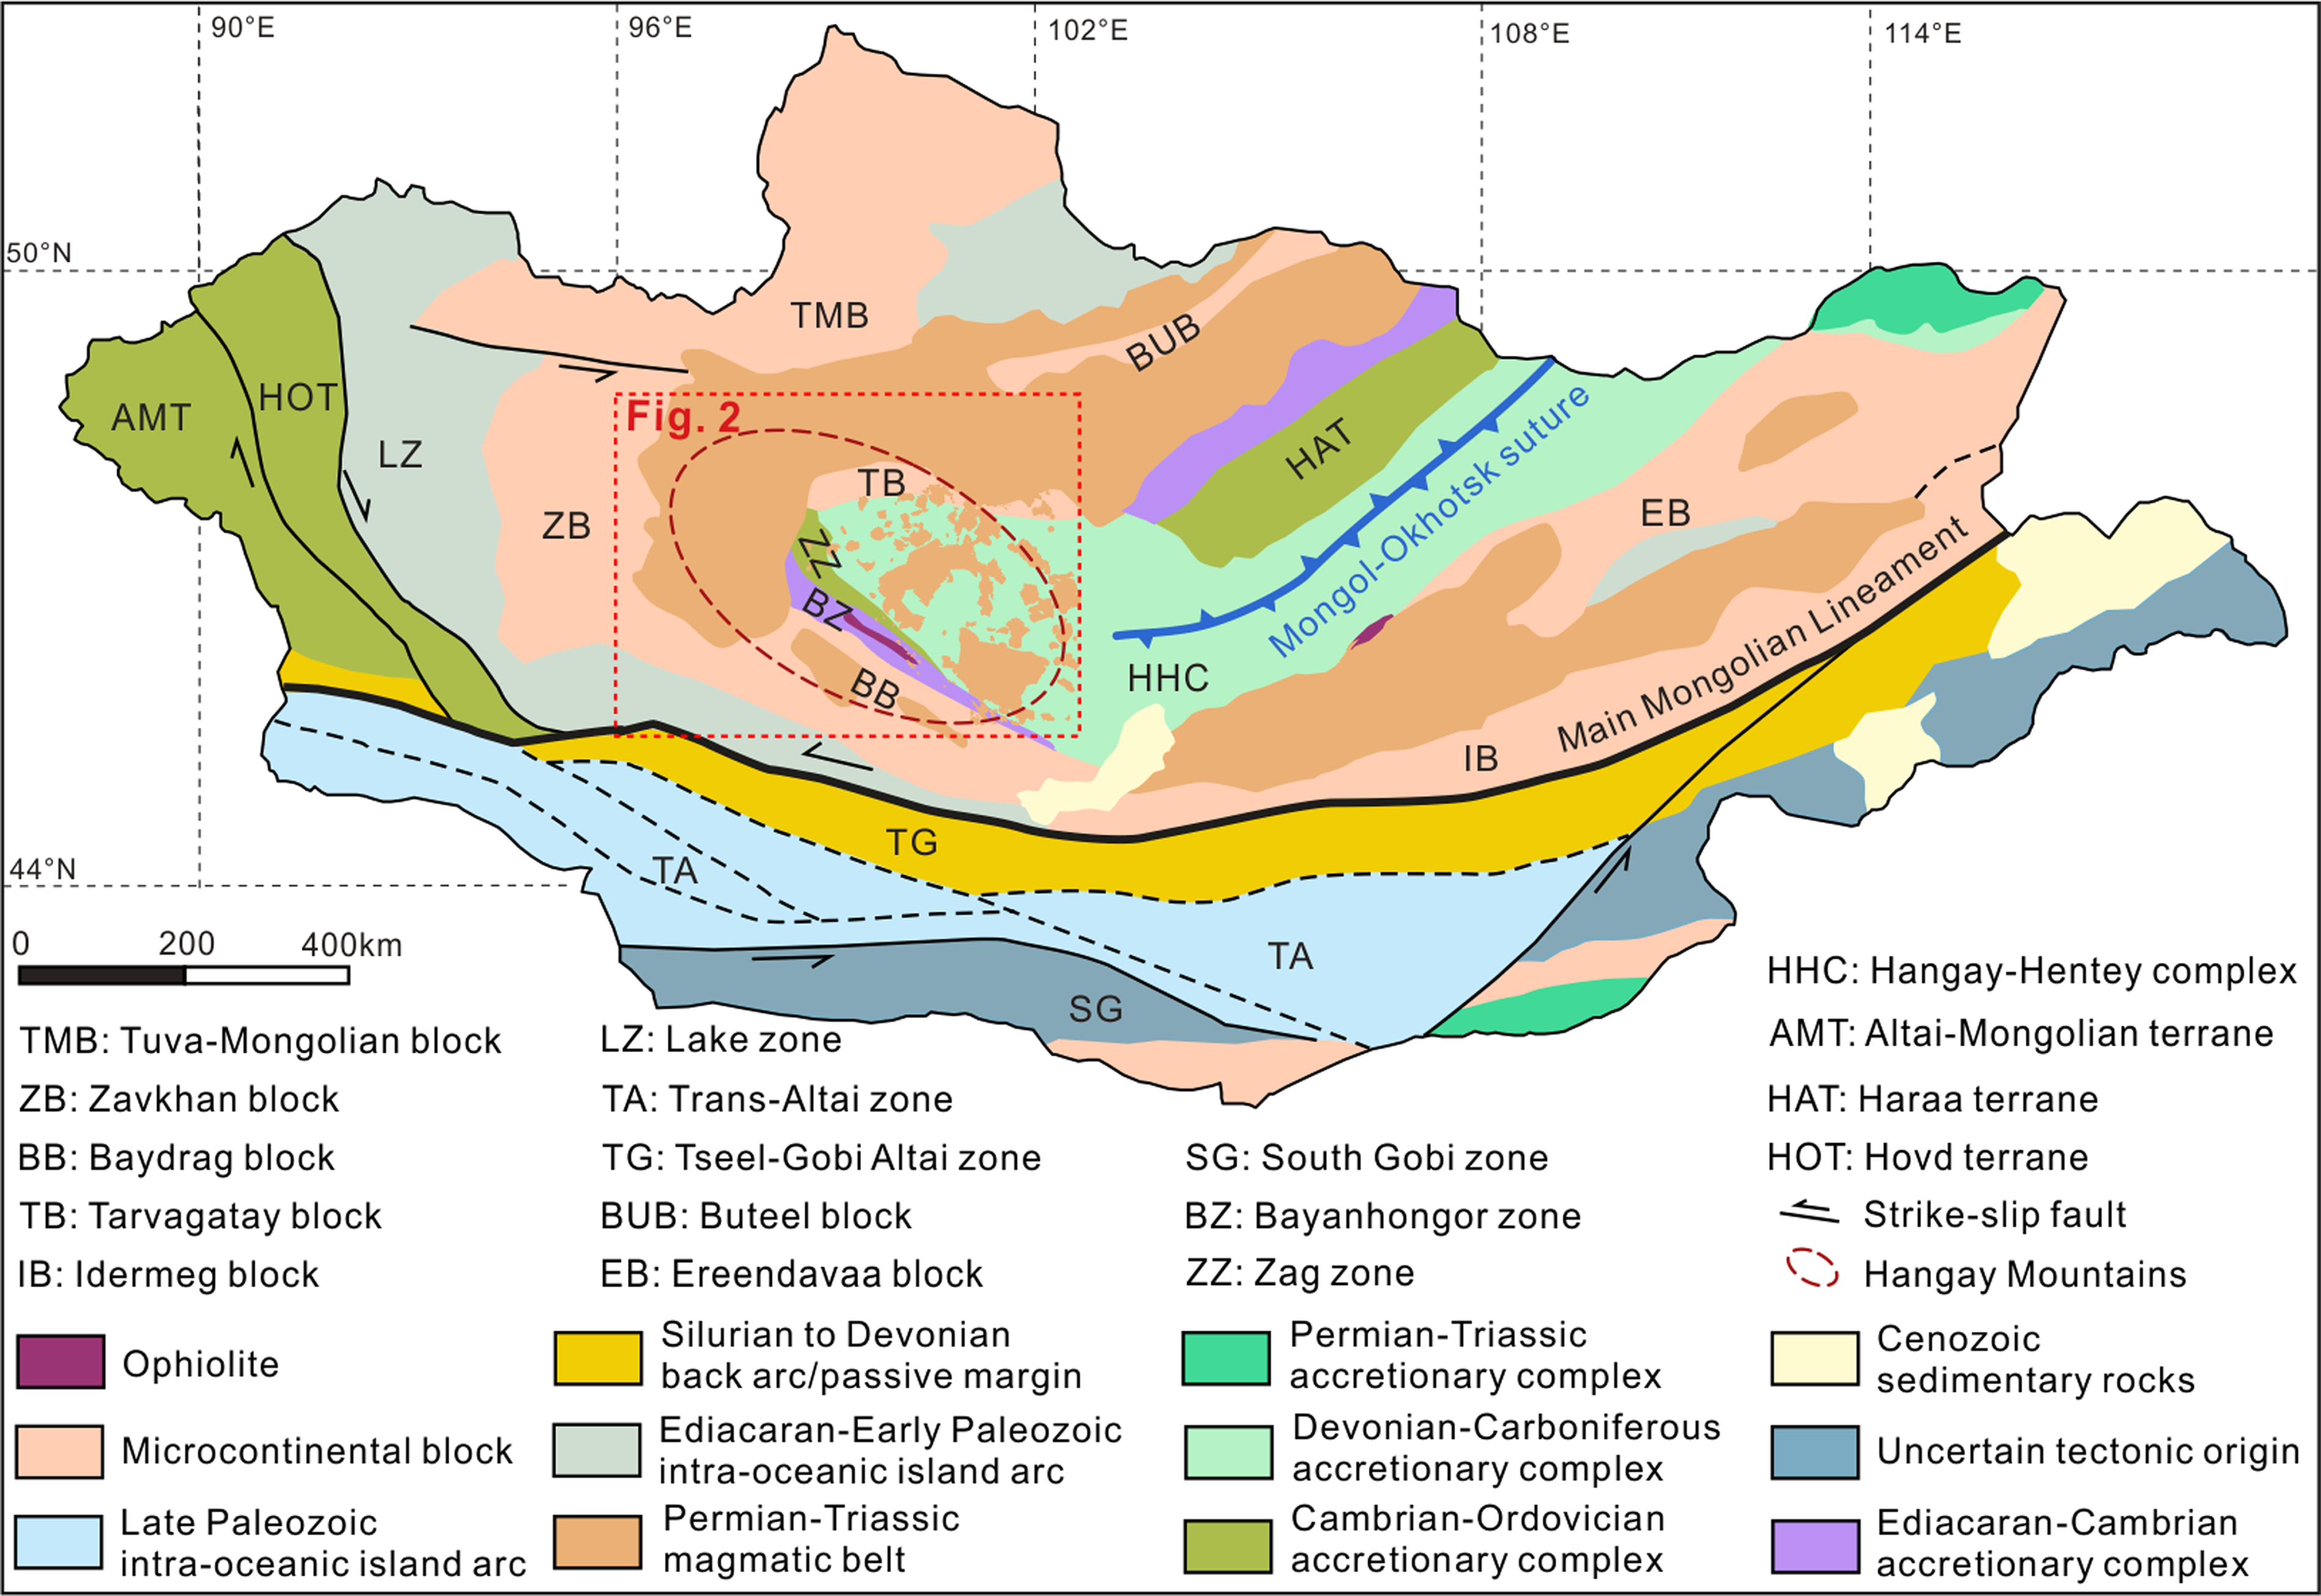
Figure 1. The tectonic map of Mongolia, which is modified from Li et al. (Reference Li, Sun, Narantsetseg, Jourdan, Hu and Yuan2022) and Ling et al. (Reference Ling, Li, Yuan, Rosenbaum, Sun, Li and Narantsetseg2024).
Precambrian microcontinental blocks around the Hangay Mountains include the Tarvagatay, Zavkhan, and Baydrag blocks (Figs. 1 and 2). The Tarvagatay block in the north is dominated by Archaean to Palaeoproterozoic gneiss, amphibolite, and schist, which are overlain by Neoproterozoic to Early Cambrian limestone and Devonian-Carboniferous sandstone and conglomerate (Badarch et al. Reference Badarch, Cunningham and Windley2002; Kozakov et al. Reference Kozakov, Kozlovsky, Yarmolyuk, Kovach, Bibikova, Kirnozova, Plotkina, Zagornaya, Fugzan, Erdenejargal, Lebedev and Eenjin2011; Kröner et al. Reference Kröner, Kovach, Kozakov, Kirnozova, Azimov, Wong and Geng2014). Farther southwest, the Zavkhan block has a Proterozoic basement (Bold et al. Reference Bold, Crowley, Smith, Sambuu and Macdonald2016; Kröner et al. Reference Kröner, Kovach, Kozakov, Kirnozova, Azimov, Wong and Geng2014), which is covered by Neoproterozoic volcanic rocks, clastic rocks, and carbonates (Kozakov et al. Reference Kozakov, Kirnozova, Kovach, Terent’eva, Tolmacheva, Fugzan and Erdenezhargal2015; Kröner et al. Reference Kröner, Kovach, Kozakov, Kirnozova, Azimov, Wong and Geng2014). In the south, the Baydrag block comprises Archaean to Proterozoic tonalitic to granitic gneiss and granulite, overlain by Neoproterozoic sandstone and Devonian to Permian volcaniclastic rocks (Demoux et al. Reference Demoux, Kröner, Badarch and Jian2009; Kröner et al. Reference Kröner, Kovach, Kozakov, Aranovich, Xie, Tolmacheva, Kirnozova, Fuzgan, Serebryakov, Wang and Lee2017).
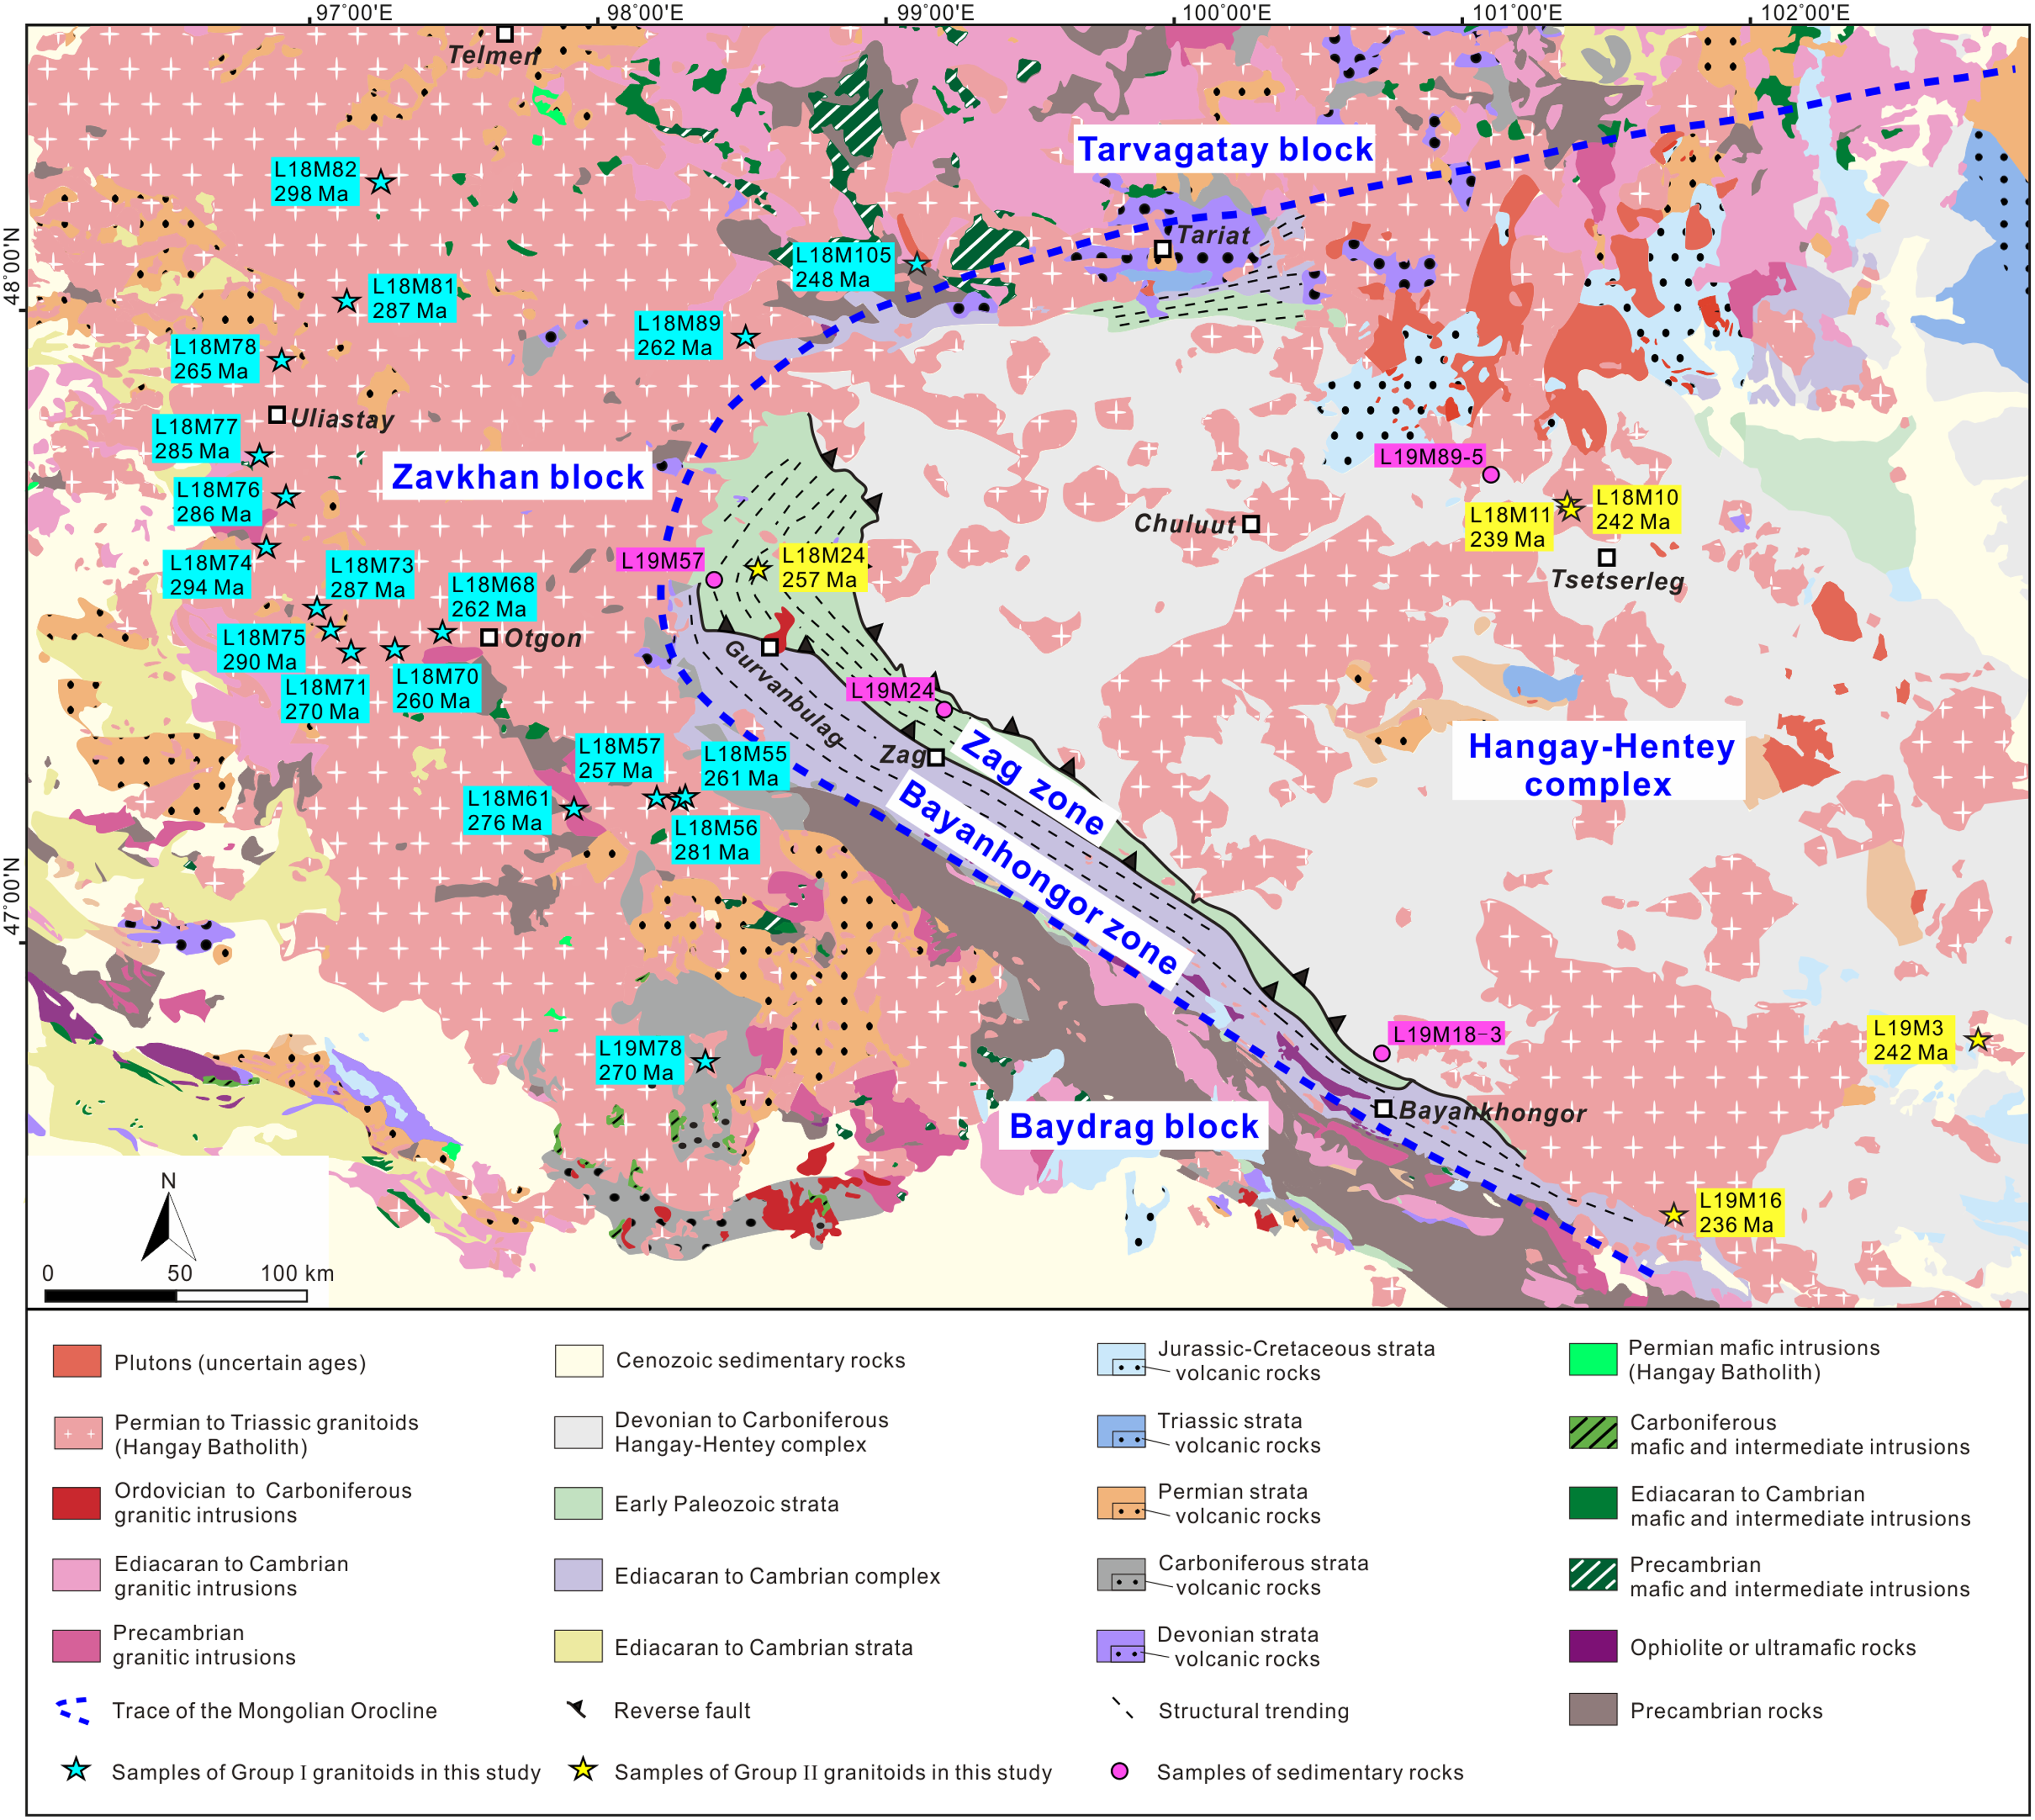
Figure 2. Geological maps in the Hangay Mountains (central Mongolia) based on Ling et al. (Reference Ling, Li, Yuan, Rosenbaum, Sun, Li and Narantsetseg2024).
Late Neoproterozoic to Palaeozoic accretionary complexes were developed around the Hangay Mountains, which include, from west to east, the Bayanhongor zone, the Zag zone, and the Hangay-Hentey complex (Fig. 2) (Şengör et al. Reference Şengör, Natal’in, Sunal and van der Voo2018; Şengör et al. Reference Şengör, Natal’in and Burtman1993). The Bayanhongor zone is represented by a pile of late Neoproterozoic to Cambrian tectonic mélange with ∼647–630 Ma ophiolite incorporated (Buchan et al. Reference Buchan, Cunninghan, Windley and Tomurhuu2001; Jian et al. Reference Jian, Kröner, Windley, Shi, Zhang, Miao, Tomurhuu, Zhang and Liu2010). The Zag zone mainly consists of Cambrian to Ordovician pelitic and psammitic schist, metasiltstone, metasandstone, and minor conglomerate that were metamorphosed under greenschist facies (Badarch et al. Reference Badarch, Cunningham and Windley2002; Buchan et al. Reference Buchan, Cunninghan, Windley and Tomurhuu2001; Li et al. Reference Li, Sun, Narantsetseg, Jourdan, Hu and Yuan2022; Osozawa et al. Reference Osozawa, Tsolmon, Majigsuren, Sereenen, Niitsuma, Iwata, Pavlis and Jahn2008). The Hangay-Hentey complex predominantly consists of the Devonian to Carboniferous turbidite that is mixed with the exotic oceanic plate stratigraphy of interlayed basalt and chert (Erdenesaihan et al. Reference Erdenesaihan, Ishiwatari, Orolmaa, Arai and Tamura2013a ; Tsukada et al. Reference Tsukada, Nakane, Yamamoto, Kurihara, Otoh, Kashiwagi, Chuluun, Gonchigdorj, Nuramkhaan, Niwa and Tokiwa2013).
Both Precambrian microcontinental blocks and accretionary complexes around the Hangay Mountains are intruded by Permian–Triassic magmatic rocks (Hangay Batholith) that represent a magmatic arc associated with the subduction of the Mongol-Okhotsk oceanic plate (Figs. 1 and 2) (Badarch et al. Reference Badarch, Cunningham and Windley2002; Donskaya et al. Reference Donskaya, Gladkochub, Mazukabzov and Ivanov2013; Ling et al. Reference Ling, Li, Yuan, Rosenbaum, Sun, Li and Narantsetseg2024; Wang et al. Reference Wang, Tong, Xiao, Guo, Windley, Donskaya, Li, Tserendash and Zhang2022). According to Ling et al. (Reference Ling, Li, Yuan, Rosenbaum, Sun, Li and Narantsetseg2024), magmatic rocks of the Hangay Batholith can be classified into two groups: Group I, which was emplaced into the Precambrian basement (Tarvagatay, Zavkhan, and Baydrag blocks), and Group II, which intruded into accretionary complexes (Bayanhongor zone, Zag zone, and Hangay-Hentey complex) or along the boundary between the accretionary complexes and the Precambrian microcontinental blocks (Fig. 2).
3. Sample description and analytical methods
3.a. Sample descriptions
Twenty-three granitic samples were taken from the Hangay Batholith around the Hangay Mountains for Sr, Nd, and Hf isotopic analysis (Fig. 2). Lithological descriptions and U-Pb zircon ages of analysed samples are summarized in Ling et al. (Reference Ling, Li, Yuan, Rosenbaum, Sun, Li and Narantsetseg2024) and are presented in Table S1.
Four sedimentary samples were collected from accretionary complexes around the Hangay Mountains for Sr-Nd isotopic analysis. Two metasiltsone samples (L19M24 and L19M57) from the Zag zone (Fig. 2) are characterized by the occurrence of a penetrative foliation that is defined by the oriented alignment of quartz, feldspar, and minor muscovite (Fig. S1a and b). Two samples (L19M18-3 and L19M89-5) are from the Hangay-Hentey complex (Fig. 2). Sample L19M18-3 is a siltstone with quartz and feldspar clasts in a clay-rich matrix (Fig. S1c), while sample L19M89-5 is a fine-grained sandstone that is mainly composed of quartz, plagioclase, and opaque minerals (Fig. S1d).
3.b. Analytical methods
3.b.1. Sr-Nd isotopes
Whole-rock Sr and Nd isotopes were analysed by Neptune Plus MC-ICP-MS (Thermo Fisher Scientific, Dreieich, Germany) at the Wuhan Sample Solution Analytical Technology Co., Ltd, Wuhan, China. Approximately 50–100 mg of powdered sample was placed in a Teflon bomb, and 1–3 ml of HNO₃ and HF were gradually added. Afterward, the Teflon bomb was put in an oven, and heated to 190°C over 24 h. After cooling, the Teflon bombs were evaporated to dryness, and then 1 ml of HNO₃ was added and evaporated to dryness again. Next, 1.5 ml of HCl was added to the evaporated sample. Following this, the sample was processed by centrifuge, with Sr fractions separated with an ion-exchange column of AG50W resin. Nd fractions were further separated by ion-exchange columns of LN resins. Finally, Sr and Nd isotopes were collected for mass-spectrometric measurement.
In this study, the Sr isotopic standard of NBS SRM 987 was applied to estimate instrumental reproducibility and accuracy. The measured 87Sr/86Sr ratio of the NBS SRM 987 is 0.710243 ± 5 (2σ, n = 14), consistent with the reported value (0.710241 ± 12; Thirlwall, Reference Thirlwall1991). In addition, two Nd isotopic standards (Jndi-1 and GSB) were applied to evaluate the instrumental reproducibility and accuracy during the analysis of the samples. The 143Nd/144Nd ratio of the Jndi-1 is 0.512116 ± 9 (2σ, n = 7), which is similar to the recommended values (0.512115 ± 7, Tanaka et al. Reference Tanaka, Togashi, Kamioka, Amakawa, Kagami and Hamamoto2000). The measured 143Nd/144Nd ratio of the GSB is 0.512440±5 (2σ, n = 9), compatible with the recommended values (0.512439 ± 10; Li et al. Reference Li, Tang, Zhu and Pan2017).
3.b.2. Zircon Hf isotope
Zircon Hf isotope was analysed by the Neptune Plus MC-ICP-MS (Thermo Scientific) at the Key Laboratory of Mineralogy and Metallogeny (Guangzhou Institute of Geochemistry, Chinese Academy of Sciences) connected with a RESOlution M-50 193 nm laser ablation system (Resonetics). The diameter and frequency of the laser were set to 45 μm and 6 Hz, respectively. The laser energy density of 4 Jcm–2 was applied to ablate zircons. Helium was used as the carrier gas to transport ablating materials. 173Yb and 175Lu were used for correcting the isobaric interference of 176Yb and 176Lu on 176Hf. The recommended values of 176Yb/173Yb and 176Lu/175Lu adapted for the correction are 0.79381 (Segal et al. Reference Segal, Halicz and Platzner2003) and 0.02656 (Wu et al. Reference Wu, Yang, Xie, Yang and Xu2006), respectively. The detailed analytical method and data reduction are documented in Wu et al. (Reference Wu, Yang, Xie, Yang and Xu2006) and Li et al. (Reference Li, He, Qi and Zhang2015). In this study, the chondritic values of 176Hf/177Hf (0.282772) and 176Lu/177Hf (0.0332), reported by Blichert-Toft & Albarede (Reference Blichert-Toft and Albarede1997), were adapted to calculate the εHf(t) values. The present-day depleted mantle values (176Hf/177Hf = 0.283250 and 176Lu/177Hf = 0.0384, Griffin et al. Reference Griffin, Pearson, Elusive, Jackson, van Achtenberg, O’Reilly and She2000) were taken to calculate the single-stage Hf model ages (TDM1). Two-stage model ages (TDM2) were calculated by using the mean fLu/Hf value of –0.34 for the lower crust (Amelin et al. Reference Amelin, Lee, Halliday and Pidgeon1999) and 0.16 for the depleted mantle (Griffin et al. Reference Griffin, Wang, Jackson, Pearson and O’Reilly2002).
4. Results
Whole-rock Sr-Nd and zircon Hf isotopic data of granitoids from the Hangay Batholith are listed in Tables S2 and S3. Spatially, Group I granitoids were emplaced into the Precambrian basement terranes, and Group II mainly intruded into accretionary complexes (Fig. 2), but both of them have similar Sr-Nd-Hf isotopic composition as documented below.
Eighteen samples of Group I granitoids with Permian ages are characterized by initial 87Sr/86Sr ratios from 0.70449 to 0.71117, and their εNd(t) values range from –9.6 to +1.7 with two-stage Nd model ages of 0.9–1.8 Ga (Fig. 3a). These samples have a wide range of zircon Hf isotopes (εHf(t)=–5.4 to +12.6), which correspond to two-stage Hf model ages from 0.5 Ga to 1.6 Ga (Fig. 4a). The other sample of Group I granitoids has a Triassic age (∼248 Ma), with an initial 87Sr/86Sr ratio of 0.70541 and a εNd(t) value is –0.7 (Fig. 3a). This sample has εHf(t) values between +1.2 and +9.5, which correspond to two-stage Hf model ages of (0.7–1.2 Ga, Fig. 4a).
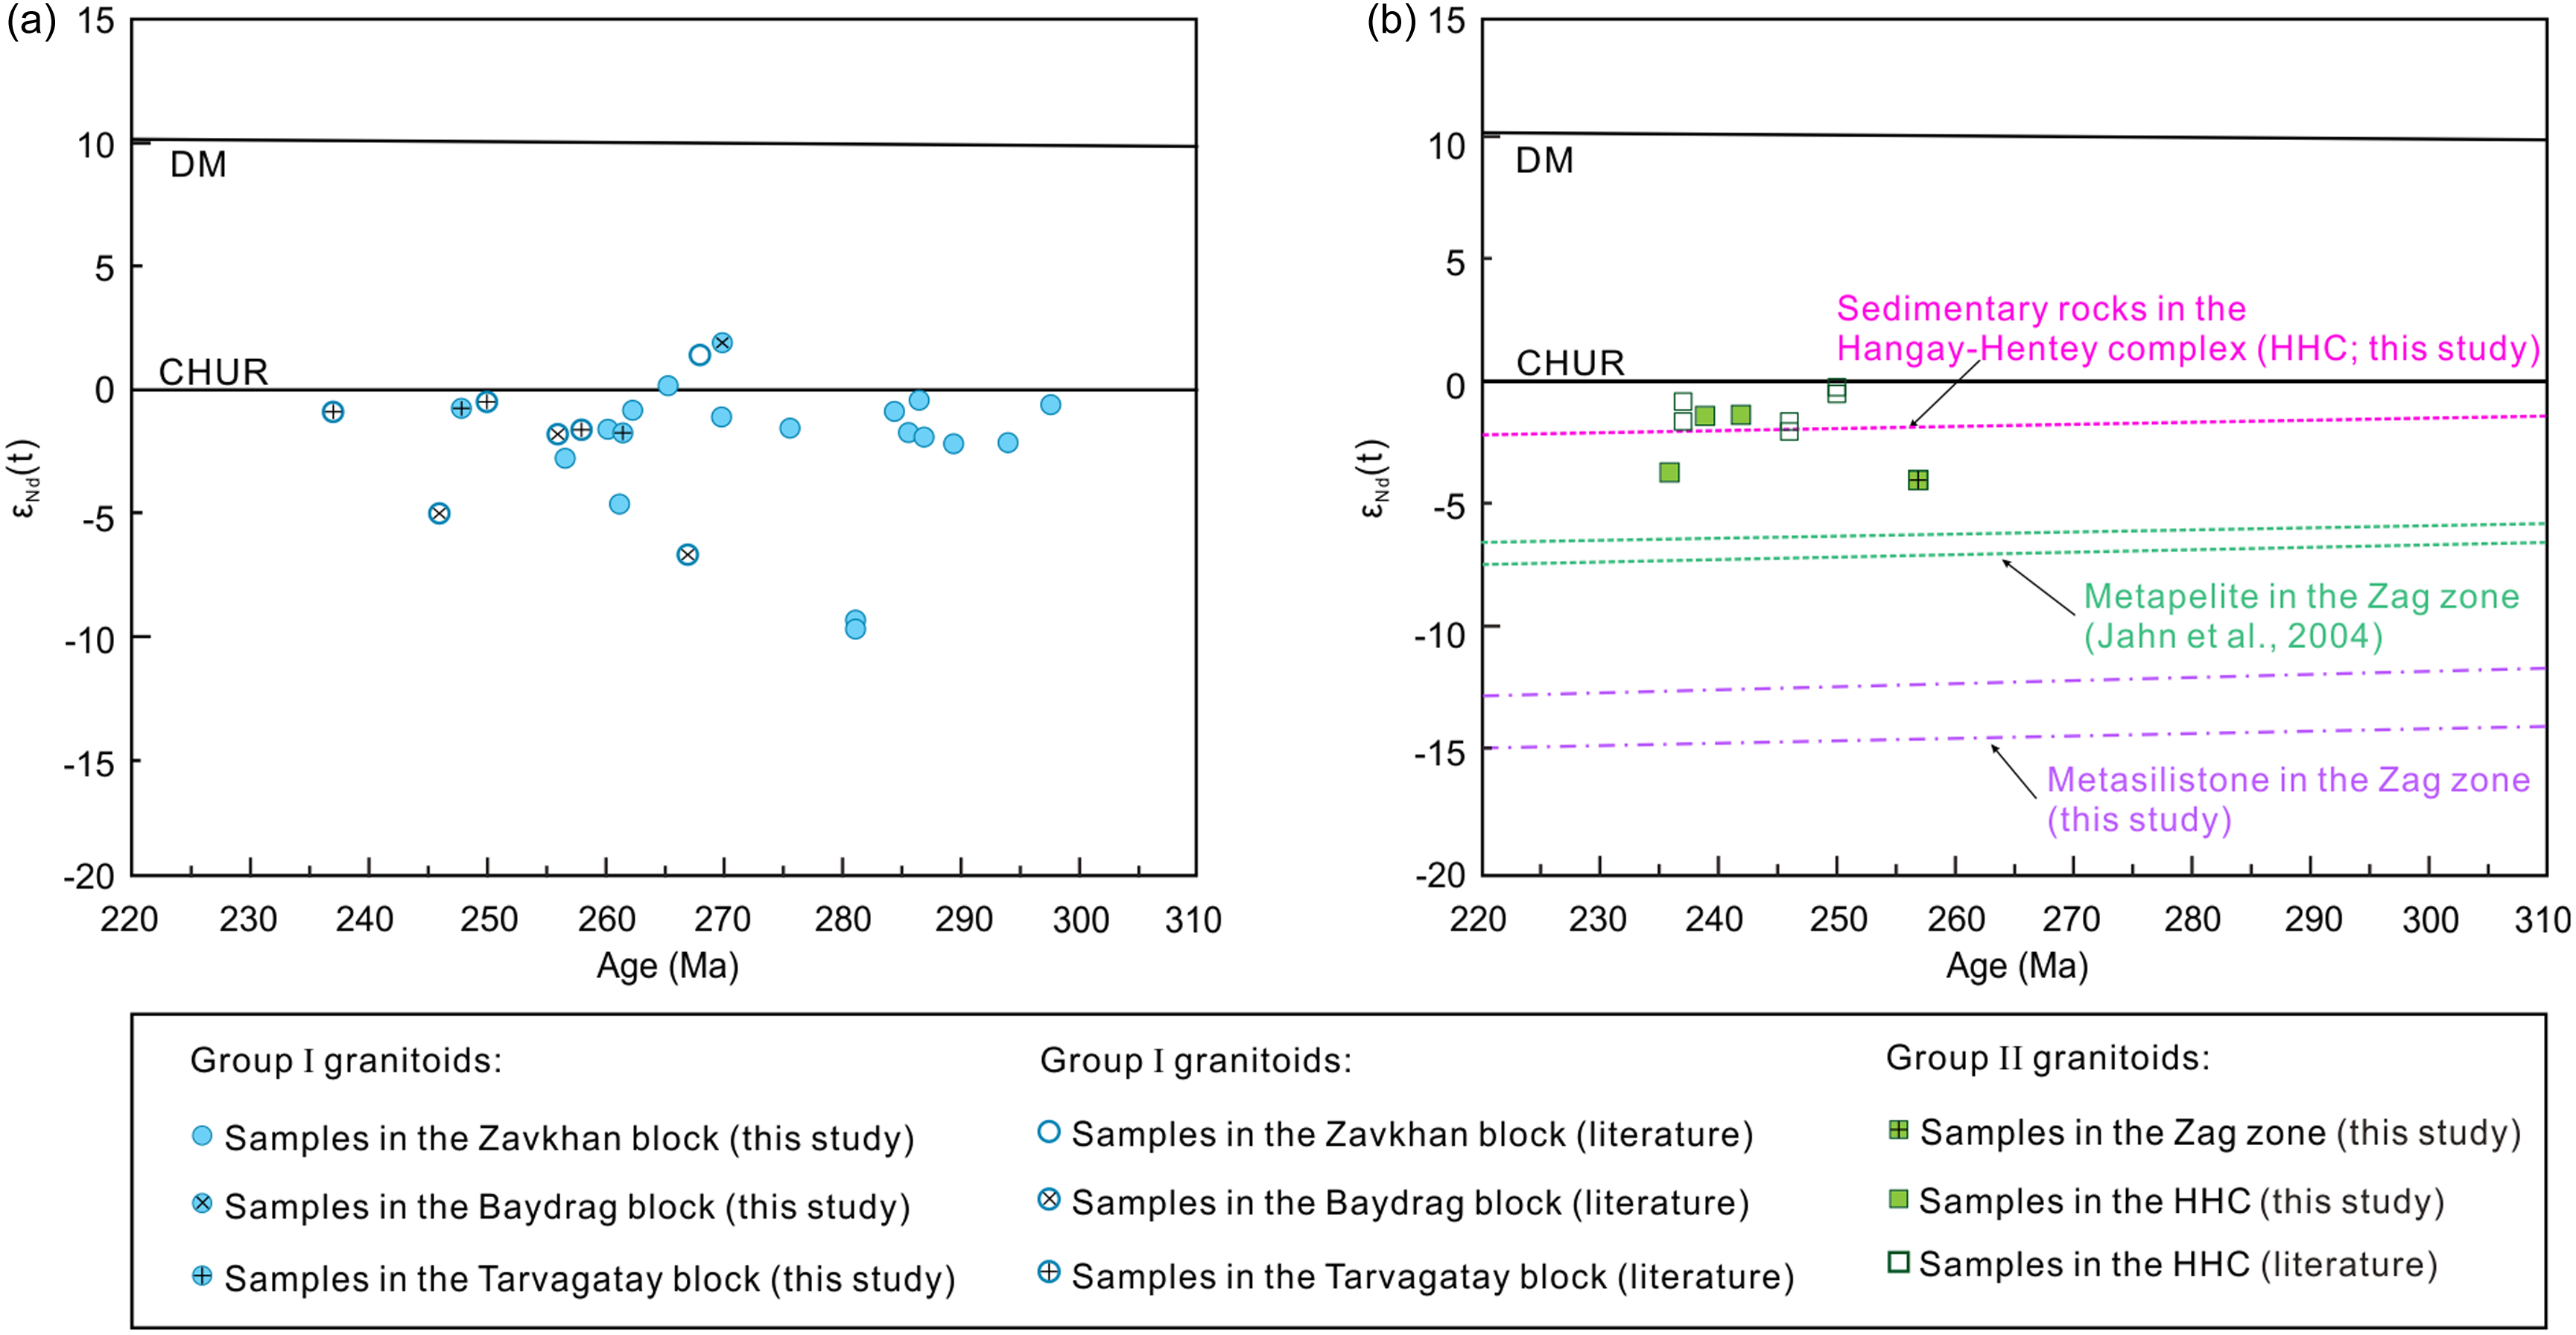
Figure 3. (a) Diagram of εNd(t) values versus crystallizing ages for Group I granitoids; (b) diagram of εNd(t) values versus crystallizing ages for Group II granitoids and sedimentary rocks in the Zag zone and the Hangay-Hentey complex. The Nd isotopic data in the literature are from Jahn et al. (Reference Jahn, Capdevila, Liu, Vernon and Badarch2004) and Yarmolyuk et al. (Reference Yarmolyuk, Kozlovsky, Savatenkov, Kovach, Kozakov, Kotov, Lebedev and Eenjin2016).
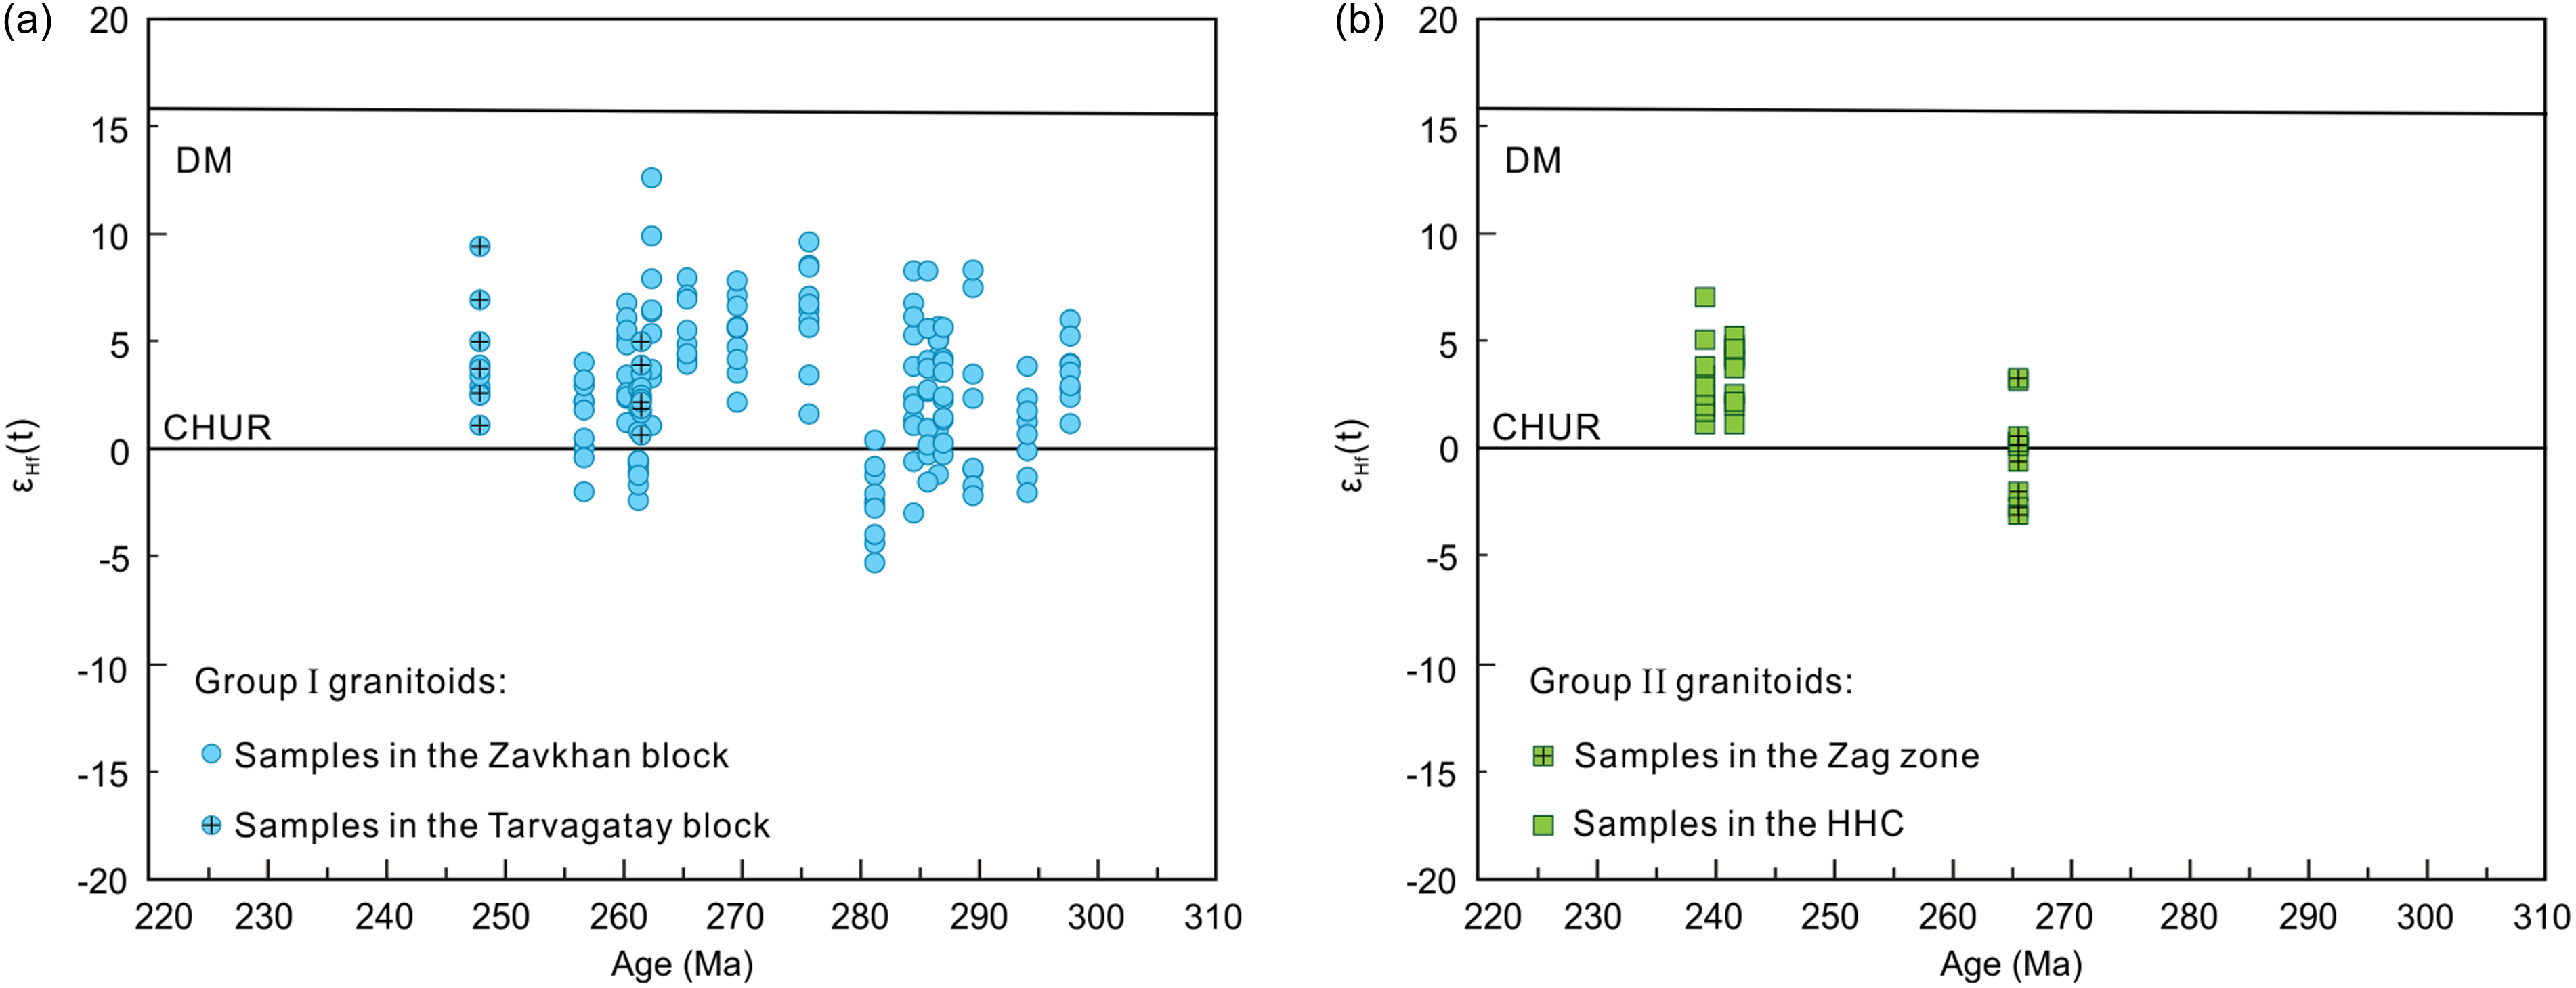
Figure 4. (a) Diagram of εHf(t) values versus crystallizing ages for Group I granitoids; (b) diagram of εHf(t) values versus crystallizing ages for Group II granitoids.
One Permian sample (∼257 Ma) of Group II granitoids has a low initial 87Sr/86Sr ratio of 0.70612, and a εNd(t) value of –4.2 (Fig. 3b). This sample shows a wide εHf(t) values (–3.2 to +3.2) and two-stage Hf model ages (1.1–1.5 Ga; Fig. 4b). The other four samples of Group II granitoids yield Triassic ages, with low initial 87Sr/86Sr ratios (0.70508–0.70712) and moderate εNd(t) values from –1.5 to –3.8 (corresponding to two-stage Nd model age of 1.1–1.3 Ga; Fig. 3b). Two of them were analysed for the Hf isotope, giving positive εHf(t) values (+1.1 to +7.0) that correspond to two-stage Hf model ages from 0.8 Ga to 1.2 Ga (Fig. 4b).
Whole-rock Sr-Nd isotopic data for four samples of sedimentary rocks from Palaeozoic accretionary complexes are summarized in Table S2. Two metasiltstones (L19M24 and L19M57) are from the Cambrian to Ordovician Zag Zone (Fig. 2). Assuming ∼460 Ma deposition ages for these two samples, we obtain initial 87Sr/86Sr ratios of 0.71444 and 0.72544, as well as εNd(t) values of –10.6 and –12.8 (corresponding to two-stage Nd model ages of 2.0 Ga and 2.2 Ga, respectively) for the two metasiltstone samples (Table S2). The other two samples (L19M18-3 and L19M89-5) from the Devonian to Carboniferous Hangay-Hentey Complex give low initial 87Sr/86Sr ratios (0.70545 and 0.70580) and moderate εNd(t) values of –1.2 and +0.7 (Table S2), based on an assumption of their deposition ages at ∼350 Ma.
5. Discussion
5.a. Petrogenesis
Previous studies show that the Hangay Batholith likely represents a magmatic arc associated with the subduction of the Mongol-Okhotsk Ocean based on rock associations and their geochemical characteristics (Donskaya et al. Reference Donskaya, Gladkochub, Mazukabzov and Ivanov2013; Wang et al. Reference Wang, Tong, Xiao, Guo, Windley, Donskaya, Li, Tserendash and Zhang2022). Granitoids from the Hangay Batholith have lower Cr and Ni contents than mantle-derived primary melts (Ni >400 ppm and Cr >1000 ppm; Şengör et al. Reference Şengör, Natal’in and Burtman1993; Wilson, Reference Wilson1989), suggesting a potential crustal source (Donskaya et al. Reference Donskaya, Gladkochub, Mazukabzov and Ivanov2013; Jahn et al. Reference Jahn, Capdevila, Liu, Vernon and Badarch2004; Ling et al. Reference Ling, Li, Yuan, Rosenbaum, Sun, Li and Narantsetseg2024; Wang et al. Reference Wang, Tong, Xiao, Guo, Windley, Donskaya, Li, Tserendash and Zhang2022; Yarmolyuk et al. Reference Yarmolyuk, Kozlovsky, Savatenkov, Kovach, Kozakov, Kotov, Lebedev and Eenjin2016). They are enriched in LILEs and depleted in HFSEs, which is compatible with the composition of continental crust (Donskaya et al., Reference Donskaya, Gladkochub, Mazukabzov and Ivanov2013; Jahn et al. Reference Jahn, Capdevila, Liu, Vernon and Badarch2004; Ling et al. Reference Ling, Li, Yuan, Rosenbaum, Sun, Li and Narantsetseg2024; Rudnick & Gao, Reference Rudnick and Gao2003; Wang et al. Reference Wang, Tong, Xiao, Guo, Windley, Donskaya, Li, Tserendash and Zhang2022; Yarmolyuk et al. Reference Yarmolyuk, Kozlovsky, Savatenkov, Kovach, Kozakov, Kotov, Lebedev and Eenjin2016).
Group I granitoids were emplaced into Precambrian microcontinental blocks of Tarvagatay, Zavkhan, and Baydrag (Fig. 2), which are characterized by a wide range of εNd(t) and εHf(t) values for their basement rocks (Fig. 5a and b). Nd and Hf isotopic data for Group I granitoids from both this study and previous work (Jahn et al. Reference Jahn, Capdevila, Liu, Vernon and Badarch2004; Yarmolyuk et al. Reference Yarmolyuk, Kozlovsky, Savatenkov, Kovach, Kozakov, Kotov, Lebedev and Eenjin2016) are plotted either above or on the evolution lines of Precambrian microcontinental blocks (Fig. 5a and b). In the Sr-Nd diagram, Group I granitoids fall near the mixing curve of Precambrian microcontinental blocks and depleted mantle (DM) (Fig. 5c), indicating that they are likely sourced from the melting of the Precambrian microcontinental blocks with additional mantle contribution that is also supported by the occurrence of mafic microgranular enclaves within some Group I granitoids (Fig. S1e and f).
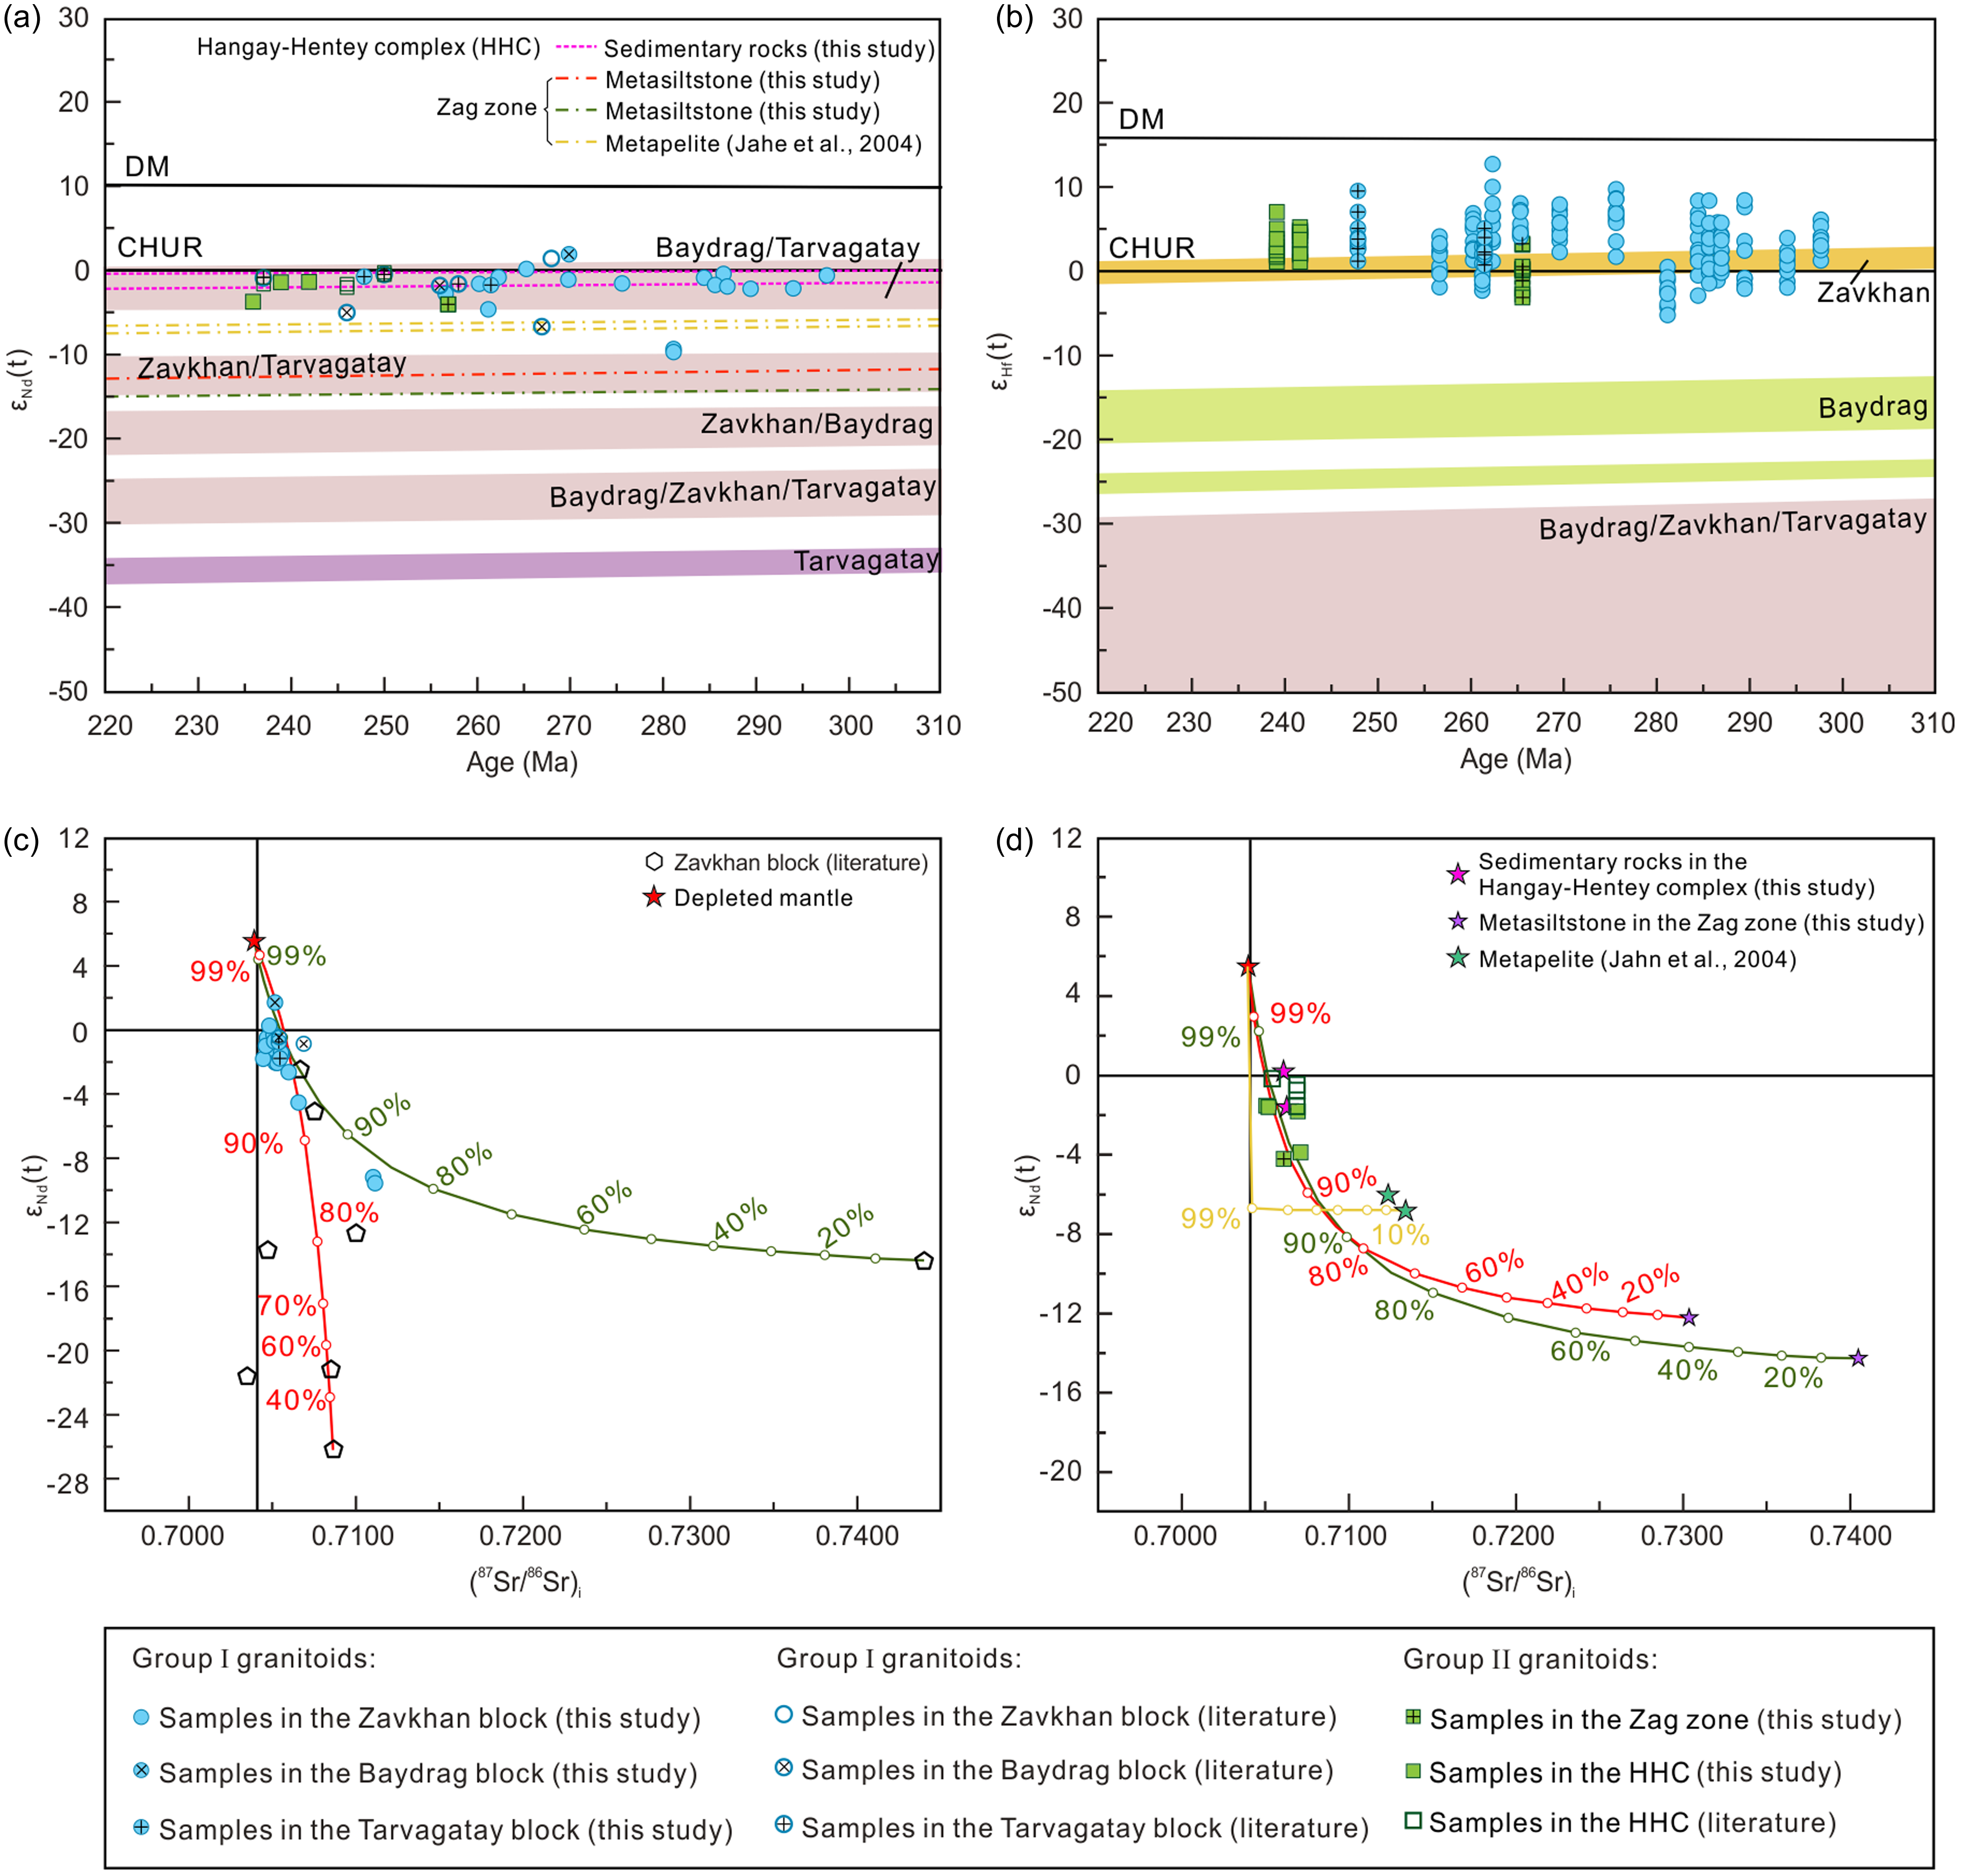
Figure 5. (a) Diagram of εNd(t) versus crystallizing ages for granitoids from the Hangay Batholith; (b) diagram of εHf(t) values versus crystallizing ages for the Hangay Batholith; (c) mixing εNd(t)-initial (87Sr/86Sr)i curves between the depleted mantle and Precambrian blocks and their relationship with Group I granitoids are discussed in the main text; (d) diagram of εNd(t) values versus crystallizing ages, illustrating the potential relationship between Group II granitoids and accretionary complexes (see details in the main text). The isotopic data of the Precambrian blocks are from Kozakov et al. (Reference Kozakov, Kirnozova, Kovach, Terent’eva, Tolmacheva, Fugzan and Erdenezhargal2015); Kozakov et al. (Reference Kozakov, Kozlovsky, Yarmolyuk, Kovach, Bibikova, Kirnozova, Plotkina, Zagornaya, Fugzan, Erdenejargal, Lebedev and Eenjin2011); Kröner et al. (Reference Kröner, Kovach, Kozakov, Aranovich, Xie, Tolmacheva, Kirnozova, Fuzgan, Serebryakov, Wang and Lee2017); Kröner et al. (Reference Kröner, Kovach, Kozakov, Kirnozova, Azimov, Wong and Geng2014) and Soejono et al. (Reference Soejono, Janoušek, Peřestý, Schulmann, Svojtka, Hanžl, Hora, Míková, Štípská, Guy, Collett and Otgonbaatar2023), while Sr-Nd isotopic data of depleted mantle are from Salters and Stracke (Reference Salters and Stracke2004).
Group II granitoids intruded into the Palaeozoic accretionary complex of the Zag zone and the Hangay-Hentey complex (Fig. 2). One Permian sample (∼257 Ma) within the Zag zone exhibits moderate εHf(t) and εNd(t) values (Fig. 5a and b). The εNd(t) value is slightly elevated above the evolution lines of the Zag zone (Fig. 5a), suggesting a minor mantle contribution to the magma source. This is further supported by the mixing curve between metasiltstones in the Zag zone and depleted mantle (DM) in the Sr-Nd diagram, where the Permian sample is plotted near this mixing curve (Fig. 5d). The rest of the Triassic granitoids that intruded into the Hangay-Hentey complex have a roughly similar Sr-Nd isotopic composition as the Hangay-Hentey complex (Fig. 5a and d), suggesting that these granitoids may predominantly originate from the melting of Hangay-Hentey complex though the possible minor contribution of the adjacent Zag zone cannot be excluded.
5.b. Decoupling between isotopic evolution and crustal thickness variation
Our results show that both Group I and II granitoids of the Hangay Batholith are sourced from crustal melting with possible additional contribution of mantle materials. They have moderate εNd(t) and εHf(t) values without obvious increasing and decreasing trend over time (Fig. 6b and c). Such an isotopic evolution trend seems indicative of a relatively constant crustal thickness of the westernmost Mongol-Okhotsk Orogen (around Hangay Mountains) from Permian to Triassic. Previous studies from the Tasmanides (eastern Australia) and the western Central Asian Orogenic Belt show that a decreasing trend of εNd(t) and εHf(t) over time may illustrate an increasing contribution of crustal materials during magma generation and assent, which could result from crustal thickening that causes more crustal inputs into magma (Collins et al. Reference Collins, Belousova, Kemp and Murphy2011; Han et al. Reference Han, Zhao, Cawood, Sun, Eizenhöfer, Hou, Zhang and Liu2016; Kemp et al. Reference Kemp, Hawkesworth, Collins, Gray and Blevin2009). In contrast, an increasing trend of εNd(t) and εHf(t) over time implies the enhanced contribution of mantle-derived juvenile materials to magma, commonly in response to an episode of crustal extension (Collins et al. Reference Collins, Belousova, Kemp and Murphy2011; Han et al. Reference Han, Zhao, Cawood, Sun, Eizenhöfer, Hou, Zhang and Liu2016; Kemp et al. Reference Kemp, Hawkesworth, Collins, Gray and Blevin2009; Li et al. Reference Li, Sun, Shu, Yuan, Jiang, Zhang and Cai2019; Zhang et al. Reference Zhang, Zhao, Sun, Eizenhöfer, Han, Hou, Liu, Wang, Liu and Xu2016).
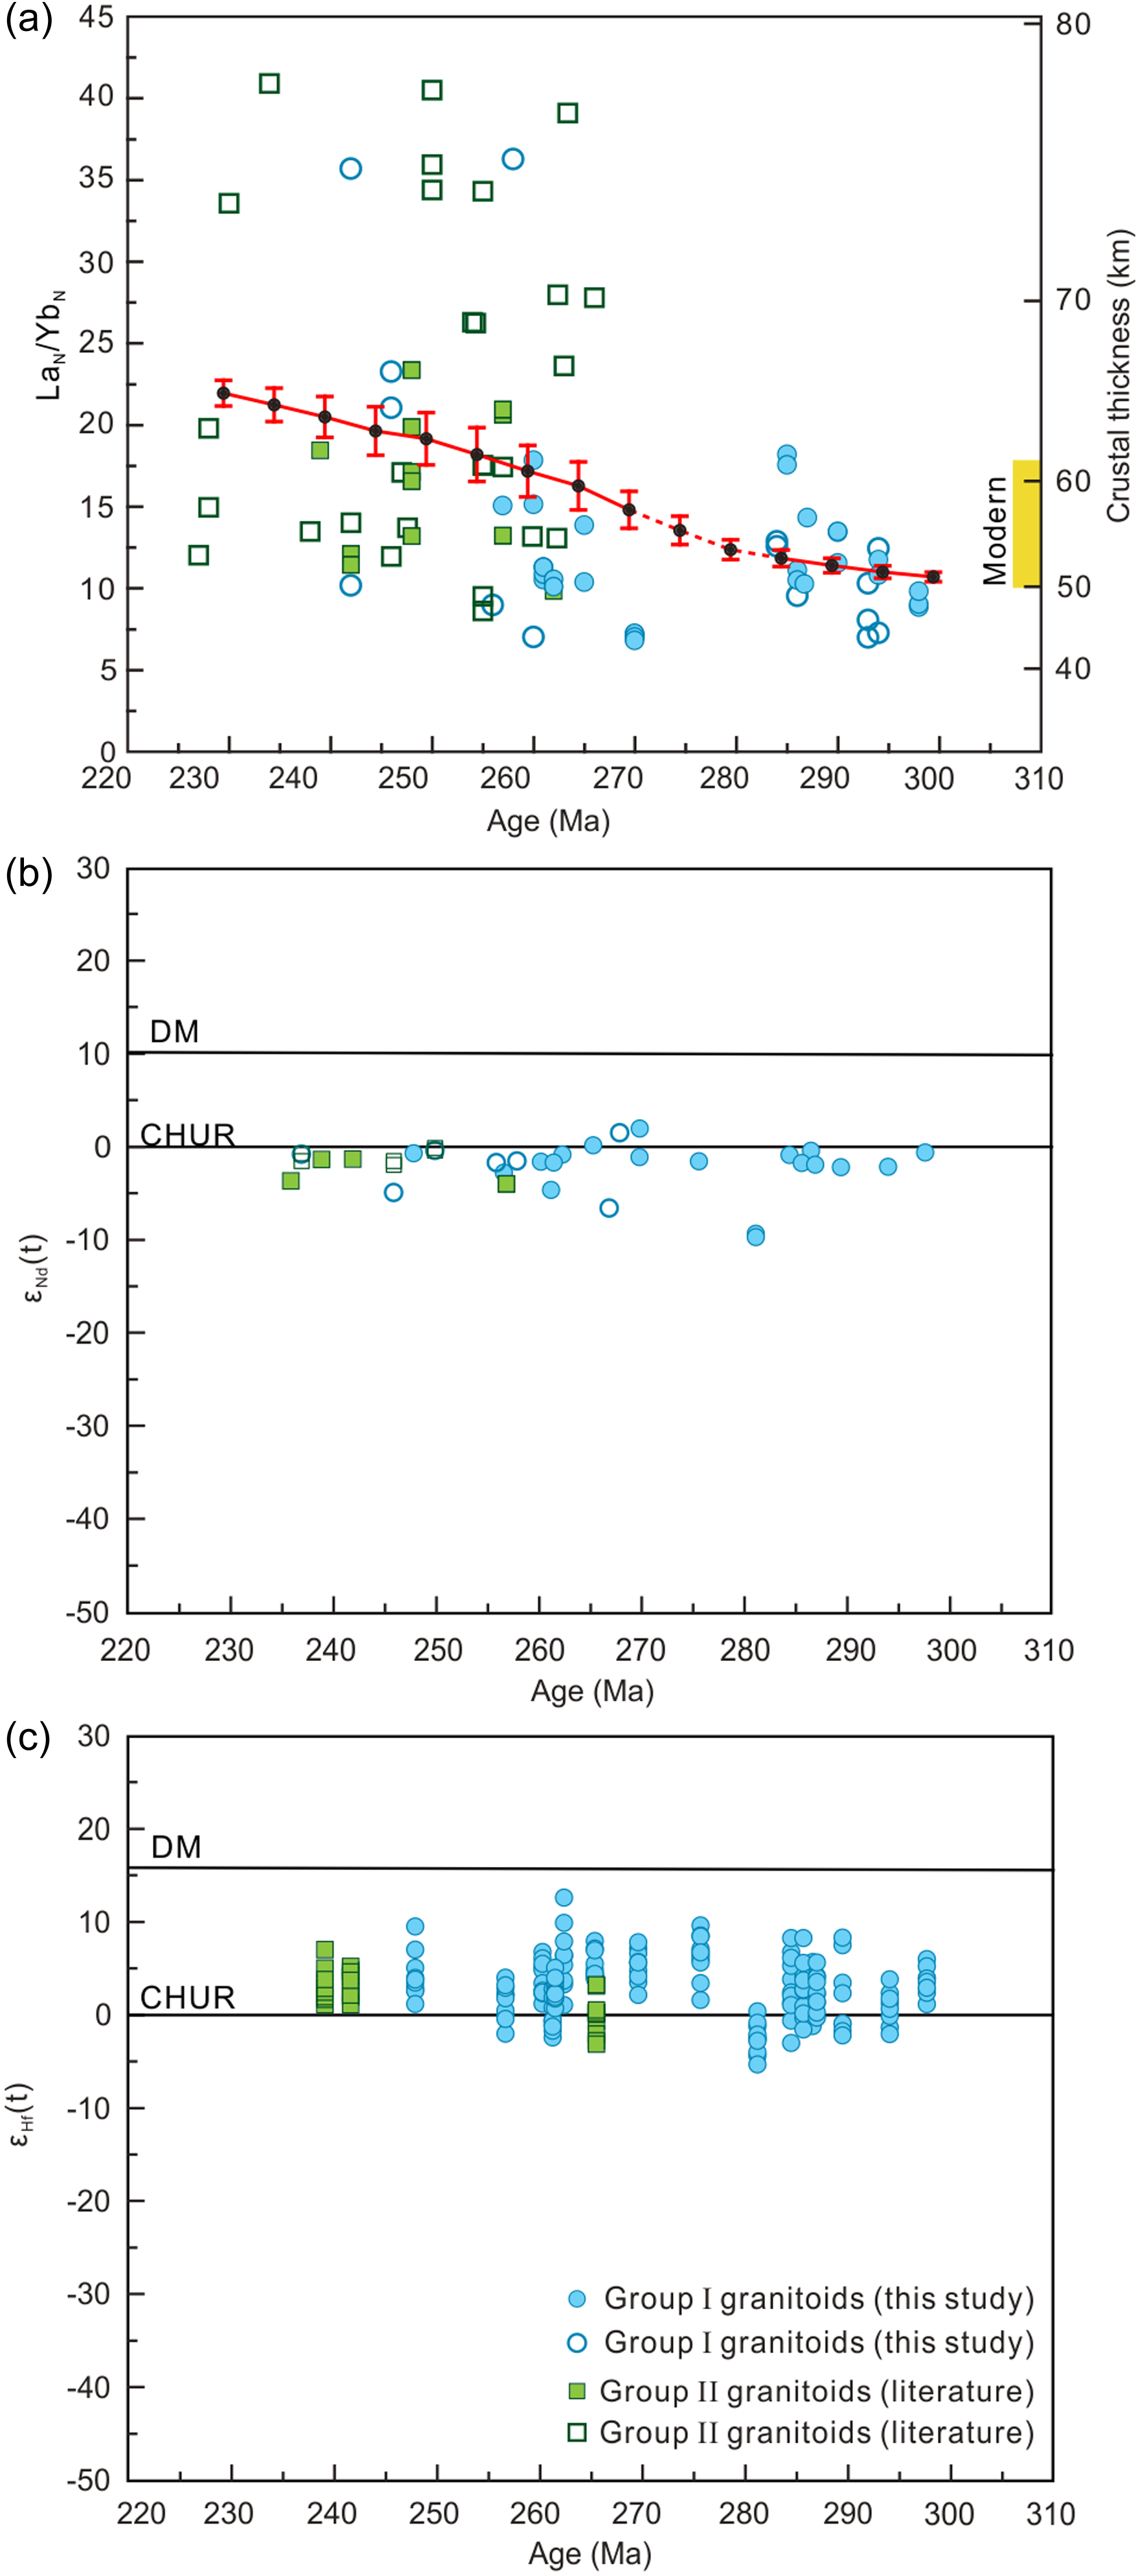
Figure 6. (a) Diagram of LaN/YbN ratios of granitoids versus ages from the Hangay Batholith, illustrating the increase in LaN/YbN ratios and crustal thickness from Permian to Triassic (modified from Ling et al., Reference Ling, Li, Yuan, Rosenbaum, Sun, Li and Narantsetseg2024). The red line with two sigma error bars represents the average trend of LaN/YbN ratios as documented in Ling et al. (Reference Ling, Li, Yuan, Rosenbaum, Sun, Li and Narantsetseg2024). The yellow rectangle shows the present-day crustal thickness around Hangay Mountains; (b) diagram of εNd(t) versus crystallizing ages from the Hangay Batholith, showing no time-shifted trend; (c) diagram of εHf(t) values versus crystallizing ages from the Hangay Batholith, indicating a relatively constant trend over time.
Recent crustal thickness reconstruction in the westernmost Mongol-Okhotsk Orogen (around the Hangay Mountains) based on LaN/YbN ratios of granitoids from the Hangay Batholith suggests progressive crustal thickening from Permian to Triassic, with average crustal thickness increasing from ∼50 km to ∼65 km in response to inner-hinge contraction as progressive development of the Mongolian Orocline (Fig. 7a; Ling et al. Reference Ling, Li, Yuan, Rosenbaum, Sun, Li and Narantsetseg2024). This is inconsistent with the Hf and Nd isotopic evolution trend (Fig. 6b and c), which seems indicative of a constant crustal thickness as discussed above. The method for LaN/YbN ratio as a crustal thickness proxy is based on the theory that magmatic rocks originating from thicker arc crust generally possess higher LaN/YbN ratios than those in thinner arc crust given garnet and/or amphibole fractionation during magma differentiation in a deeper crustal environment (Luffi & Ducea, Reference Luffi and Ducea2022; Profeta et al. Reference Profeta, Ducea, Chapman, Paterson, Gonzales, Kirsch, Petrescu and DeCelles2015). This method for tracing crustal thickness has been shown to be effective in both modern and ancient orogens (Luffi & Ducea, Reference Luffi and Ducea2022; Profeta et al. Reference Profeta, Ducea, Chapman, Paterson, Gonzales, Kirsch, Petrescu and DeCelles2015; Song et al. Reference Song, Mitchell, Xiao, Mao, Wan and Ao2023; Wang et al. Reference Wang, Cai, Sun, Zhao, Xiao and Xia2020; Zhu et al. Reference Zhu, Wang, Cawood, Zhao and Mo2017). In contrast, the link between Hf and Nd isotopic evolution and crustal thickness variation is based on an assumption of relatively homogeneous composition for arc crust. However, the composition of the overriding plate along convergent plate boundaries could be heterogeneous or modified due to prolonged subduction, which is obvious in particular for the accretionary orogen, such as the Central Asian Orogenic Belt (Broussolle et al. Reference Broussolle, Jiang, Sun, Yu, Wong, Shu and Xu2020). In the case of the westernmost Mongol-Okhotsk Orogen, the subduction might have initiated in the Ediacaran (Demoux et al. Reference Demoux, Kröner, Badarch and Jian2009; Jahn et al. Reference Jahn, Capdevila, Liu, Vernon and Badarch2004; Zhang et al. Reference Zhang, Sun, Yuan, Xu, Long, Tomurhuu, Wang and He2015), and lasted until the Early Mesozoic (Donskaya et al. Reference Donskaya, Gladkochub, Mazukabzov and Ivanov2013; Ling et al. Reference Ling, Li, Yuan, Sun, Zhang, Narantsetseg, Wang, Jiang and Hu2021; Van der Voo et al. Reference Van der Voo, van Hinsbergen, Domeier, Spakman and Torsvik2015; Wang et al. Reference Wang, Tong, Xiao, Guo, Windley, Donskaya, Li, Tserendash and Zhang2022). The prolonged subduction could result in the continuing addition of juvenile crust under the Precambrian microcontinents of Tarvagatay, Zavkhan, and Baydrag blocks via either magmatically underplating or tectonic accretion (Collins et al. Reference Collins, Belousova, Kemp and Murphy2011). In addition, Triassic Group II granitoids of the Hangay Batholith intruded into the Palaeozoic accretionary complexes of the Zag zone and the Hangay-Hentey complex, which are characterized by heterogeneous rock associations with overriding plate-derived sedimentary rocks (moderate εNd(t) values as shown in Fig. 5a), mixed with off-scarping oceanic plate stratigraphy (basalt and chert) (Erdenesaihan et al. Reference Erdenesaihan, Ishiwatari, Orolmaa, Arai and Tamura2013b ; Tsukada et al. Reference Tsukada, Nakane, Yamamoto, Kurihara, Otoh, Kashiwagi, Chuluun, Gonchigdorj, Nuramkhaan, Niwa and Tokiwa2013). Overall, it seems reasonable to propose a heterogeneous source for the Hangay Batholith. Consequently, the evolution of Hf and Nd isotopes does not appear to be sensitive to increases in crustal thickness, as the greater contribution of the relatively juvenile crust during progressive thickening would not significantly lower the εNd(t) and εHf(t) values.
Our results highlight a decoupling between the Permian to Triassic evolution of Hf and Nd isotopes in arc magmas and crustal thickness variation in the westernmost Mongol-Okhotsk Orogen. This decoupling may also occur in other arc systems over deep time. Therefore, caution is needed when linking Hf and Nd isotope evolution to crustal thickness variations, even though such links have commonly been used to trace subduction advance and retreat along convergent plate boundaries (Han et al. Reference Han, Zhao, Cawood, Sun, Eizenhöfer, Hou, Zhang and Liu2016; Kemp et al. Reference Kemp, Hawkesworth, Collins, Gray and Blevin2009). A recent study in the Patagonian Andes shows a trend towards isotopically positive values as the back-arc extension related to the trench retreat, but it does not exhibit the trend towards isotopically negative values during the back-arc closure and arc-continent collision that is typically expected in advancing orogens (Rey et al. Reference Rey, Malkowski, Fosdick, Dobbs, Calderón, Ghiglione and Graham2024). The prolonged juvenile isotopic signature for tens of millions of years after the back-arc basin closure in the Patagonian Andes has been attributed to the partial melting of underthrusted isotopically juvenile crust that was formed during earlier back-arc extension (Rey et al. Reference Rey, Malkowski, Fosdick, Dobbs, Calderón, Ghiglione and Graham2024), thus underscoring the limitations of using isotopic records to trace contractional and extensional tectonic processes.
6. Conclusions
This study obtains new whole-rock Sr-Nd and zircon Hf isotopic from granitoids of the Permian to Triassic Hangay Batholith and Palaeozoic accretionary complex in the westernmost Mongol-Okhotsk Orogen (Hangay Mountains). Group I granitoids of the Hangay Batholith, which intruded the Precambrian microcontents, have predominantly moderate initial 87Sr/86Sr ratios (0.70449 to 0.71117), εNd(t) values (–9.6 to +1.7) and zircon εHf(t) values (–5.4 to +12.6). Similarly, Group II granitoids of the Hangay Batholith, which mainly intruded into Palaeozoic accretionary complexes, have moderate initial 87Sr/86Sr ratios (0.70508 to 0.70712), εNd(t) values (–4.2 to –1.5), and εHf(t) values (–3.2 to +7.0). Combining with isotope data from Precambrian microcontinents and Palaeozoic accretionary complexes, we conclude that both Group I and II granitoids were produced by partial melting of crustal materials (microcontinents or accretionary complexes) with possible additional mantle contribution. In addition, Group I and II granitoids do not show time-shifted evolution of εNd(t) and εHf(t) values, which is decoupled with the crustal thickness variation as traced by LaN/YbN ratios of these granitoids. Such a decoupling is likely due to the heterogeneous crustal architecture.
Supplementary material
The supplementary material for this article can be found at https://doi.org/10.1017/S0016756825000081
Acknowledgements
This study was financially supported by the National Science Foundation of China (grant no. 42172237), the international partnership programme of the Chinese Academy of Sciences (CAS) (grant no. 132744KYSB20200001), and Guangdong Province of China (grant no. 2019QN01H101). This is a contribution of the Guangzhou Institute of Geochemistry (GIG)-CAS (No. IS-3652).
Competing interests
The authors declare none.


 Open access