


1. Introduction
The Niagara Escarpment is a landform composed of sedimentary rocks that extends through southern Ontario and into New York, Michigan and Wisconsin (Armstrong & Dodge, Reference Armstrong and Dodge2007; Figs 1, 2). The structure exposes sandstone, shale and dolostone deposited during the Ordovician and Silurian periods. Exposed sedimentary strata have been subject to differential erosion during the Cenozoic, including throughout Quaternary glaciation, resulting in the formation of a steeply sloped cuesta (Hewitt, Reference Hewitt1971; Armstrong & Dodge, Reference Armstrong and Dodge2007). The Niagara Escarpment is the part of the cuesta that bisects southern Ontario (Fig. 1) and has been integrated into neighboring urban landscapes during the growth of local cities (Formenti et al. Reference Formenti, Peace, Waldron, Eyles and Lee2021). In particular, the city of Hamilton has been built both topographically below and above the Niagara Escarpment (Fig. 2; Hewitt, Reference Hewitt1971).
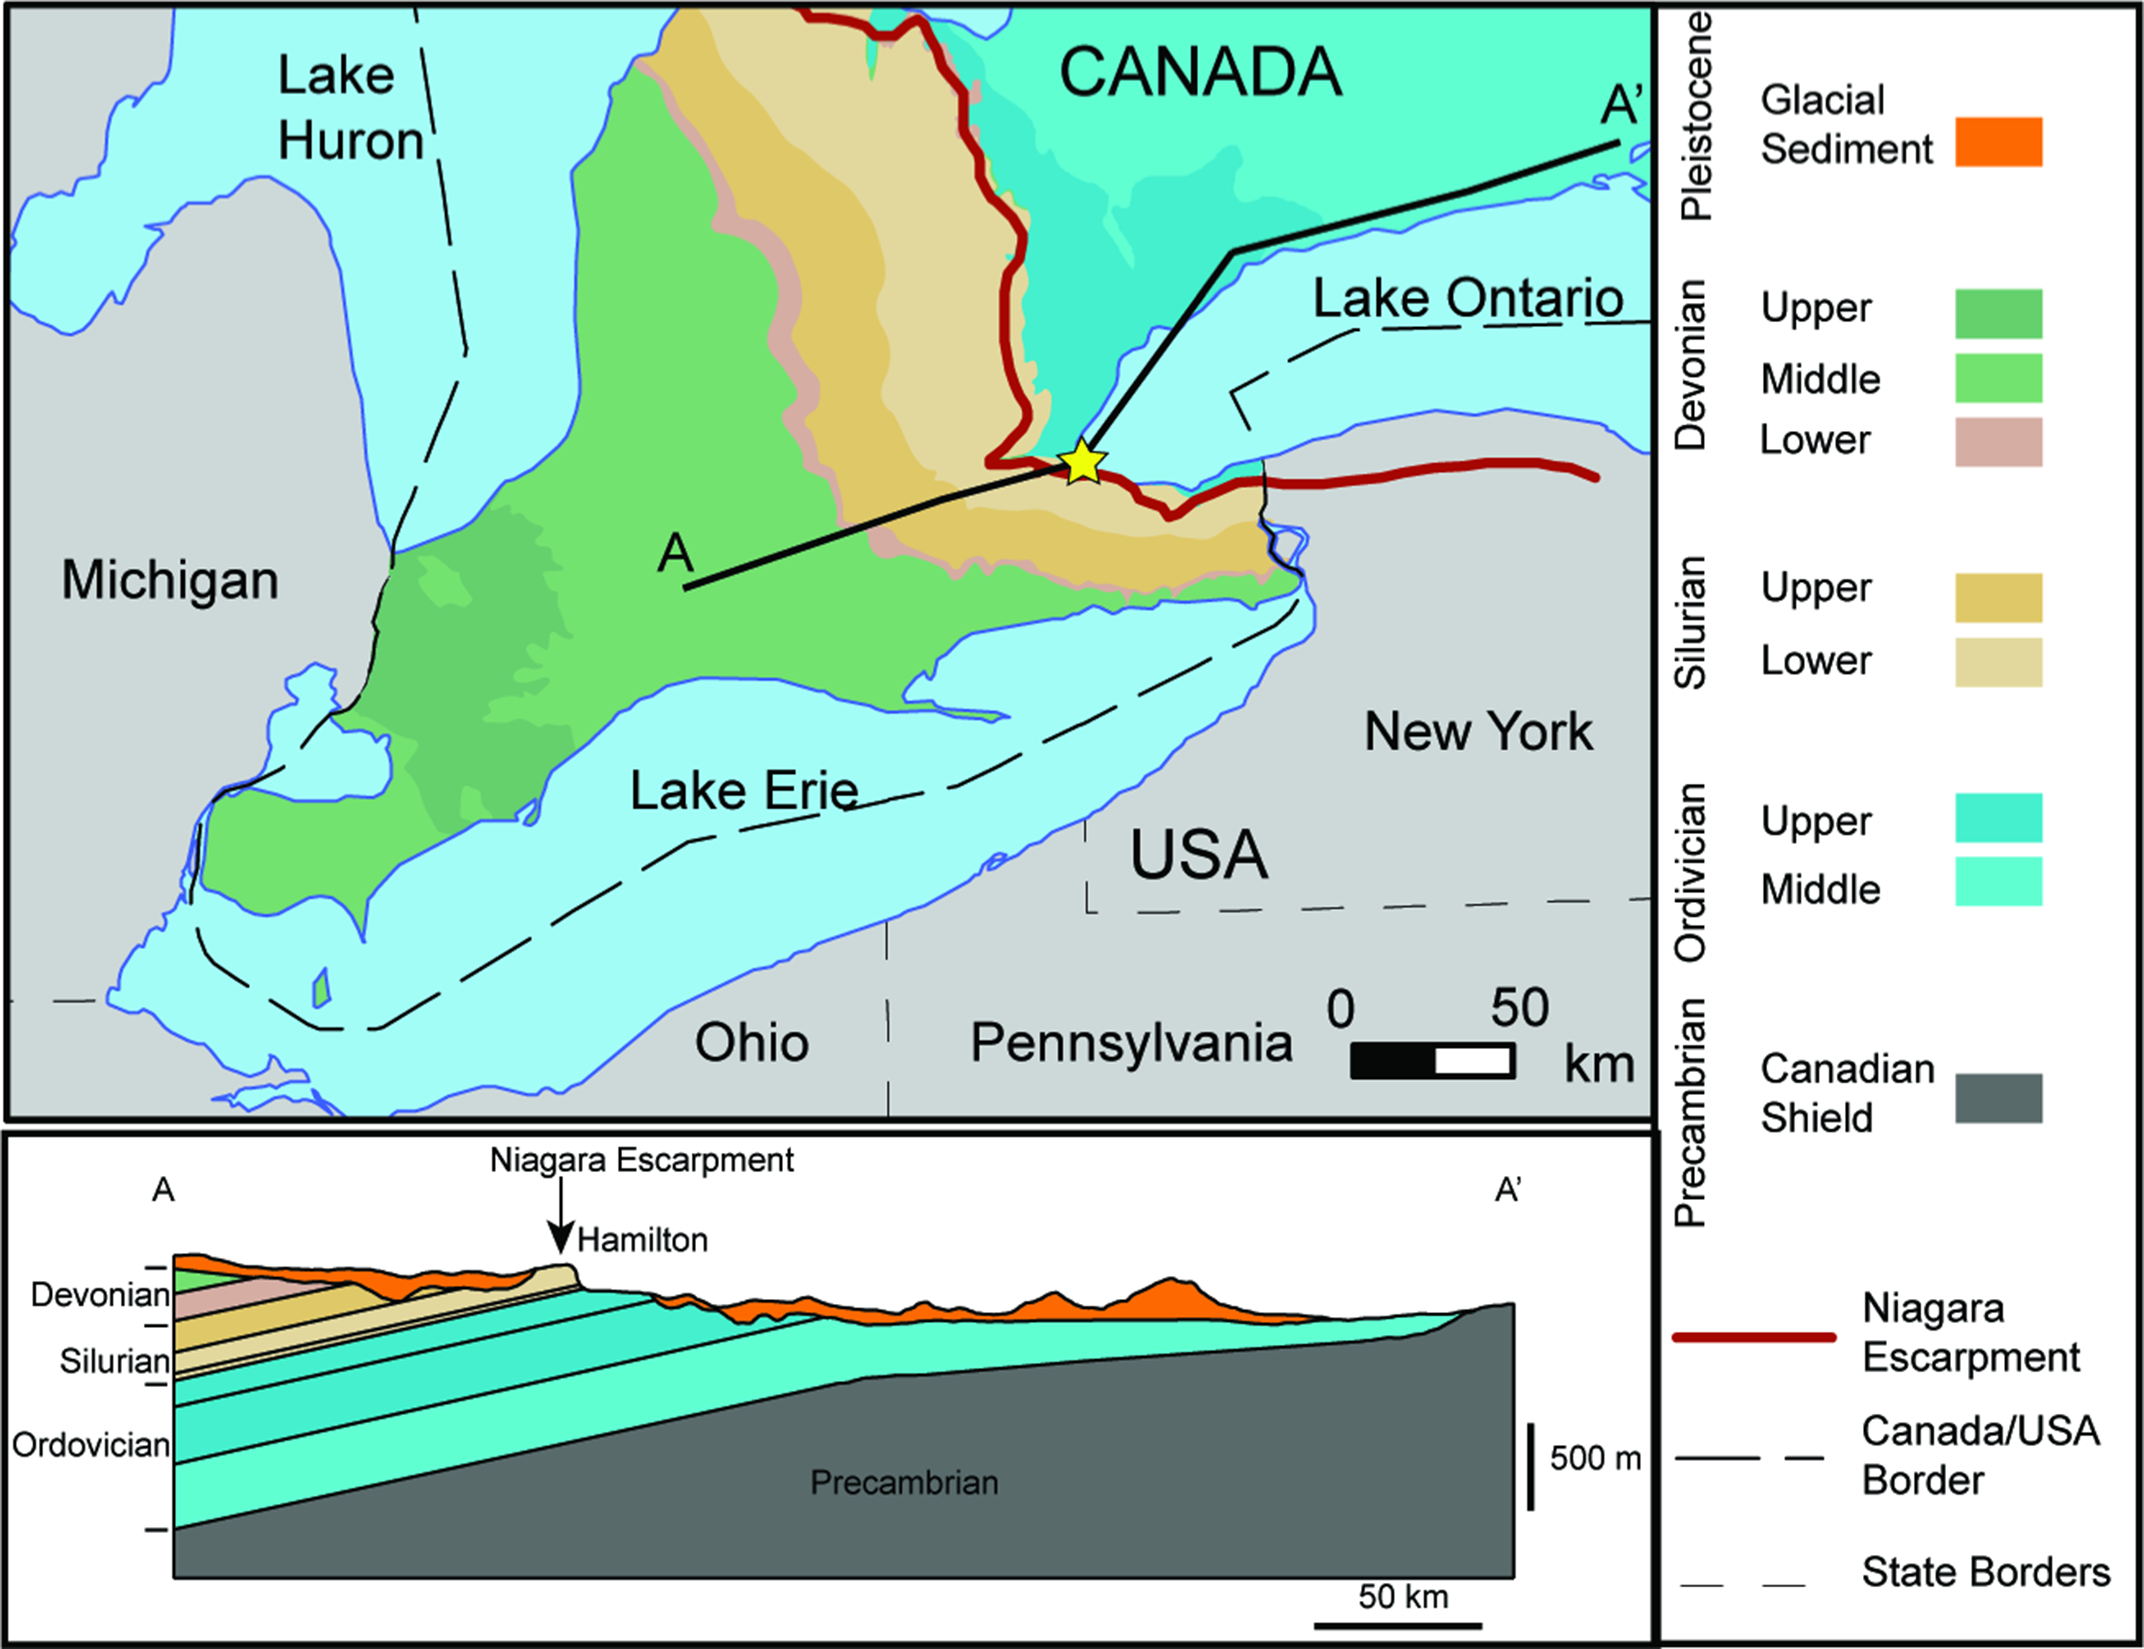
Fig. 1. Geological map and cross-section of southern Ontario showing Pleistocene sediments, Palaeozoic sedimentary strata and underlying Precambrian shield rock. Hamilton is located at the yellow star (Eyles, Reference Eyles2002; Ontario Geological Survey, 2011).
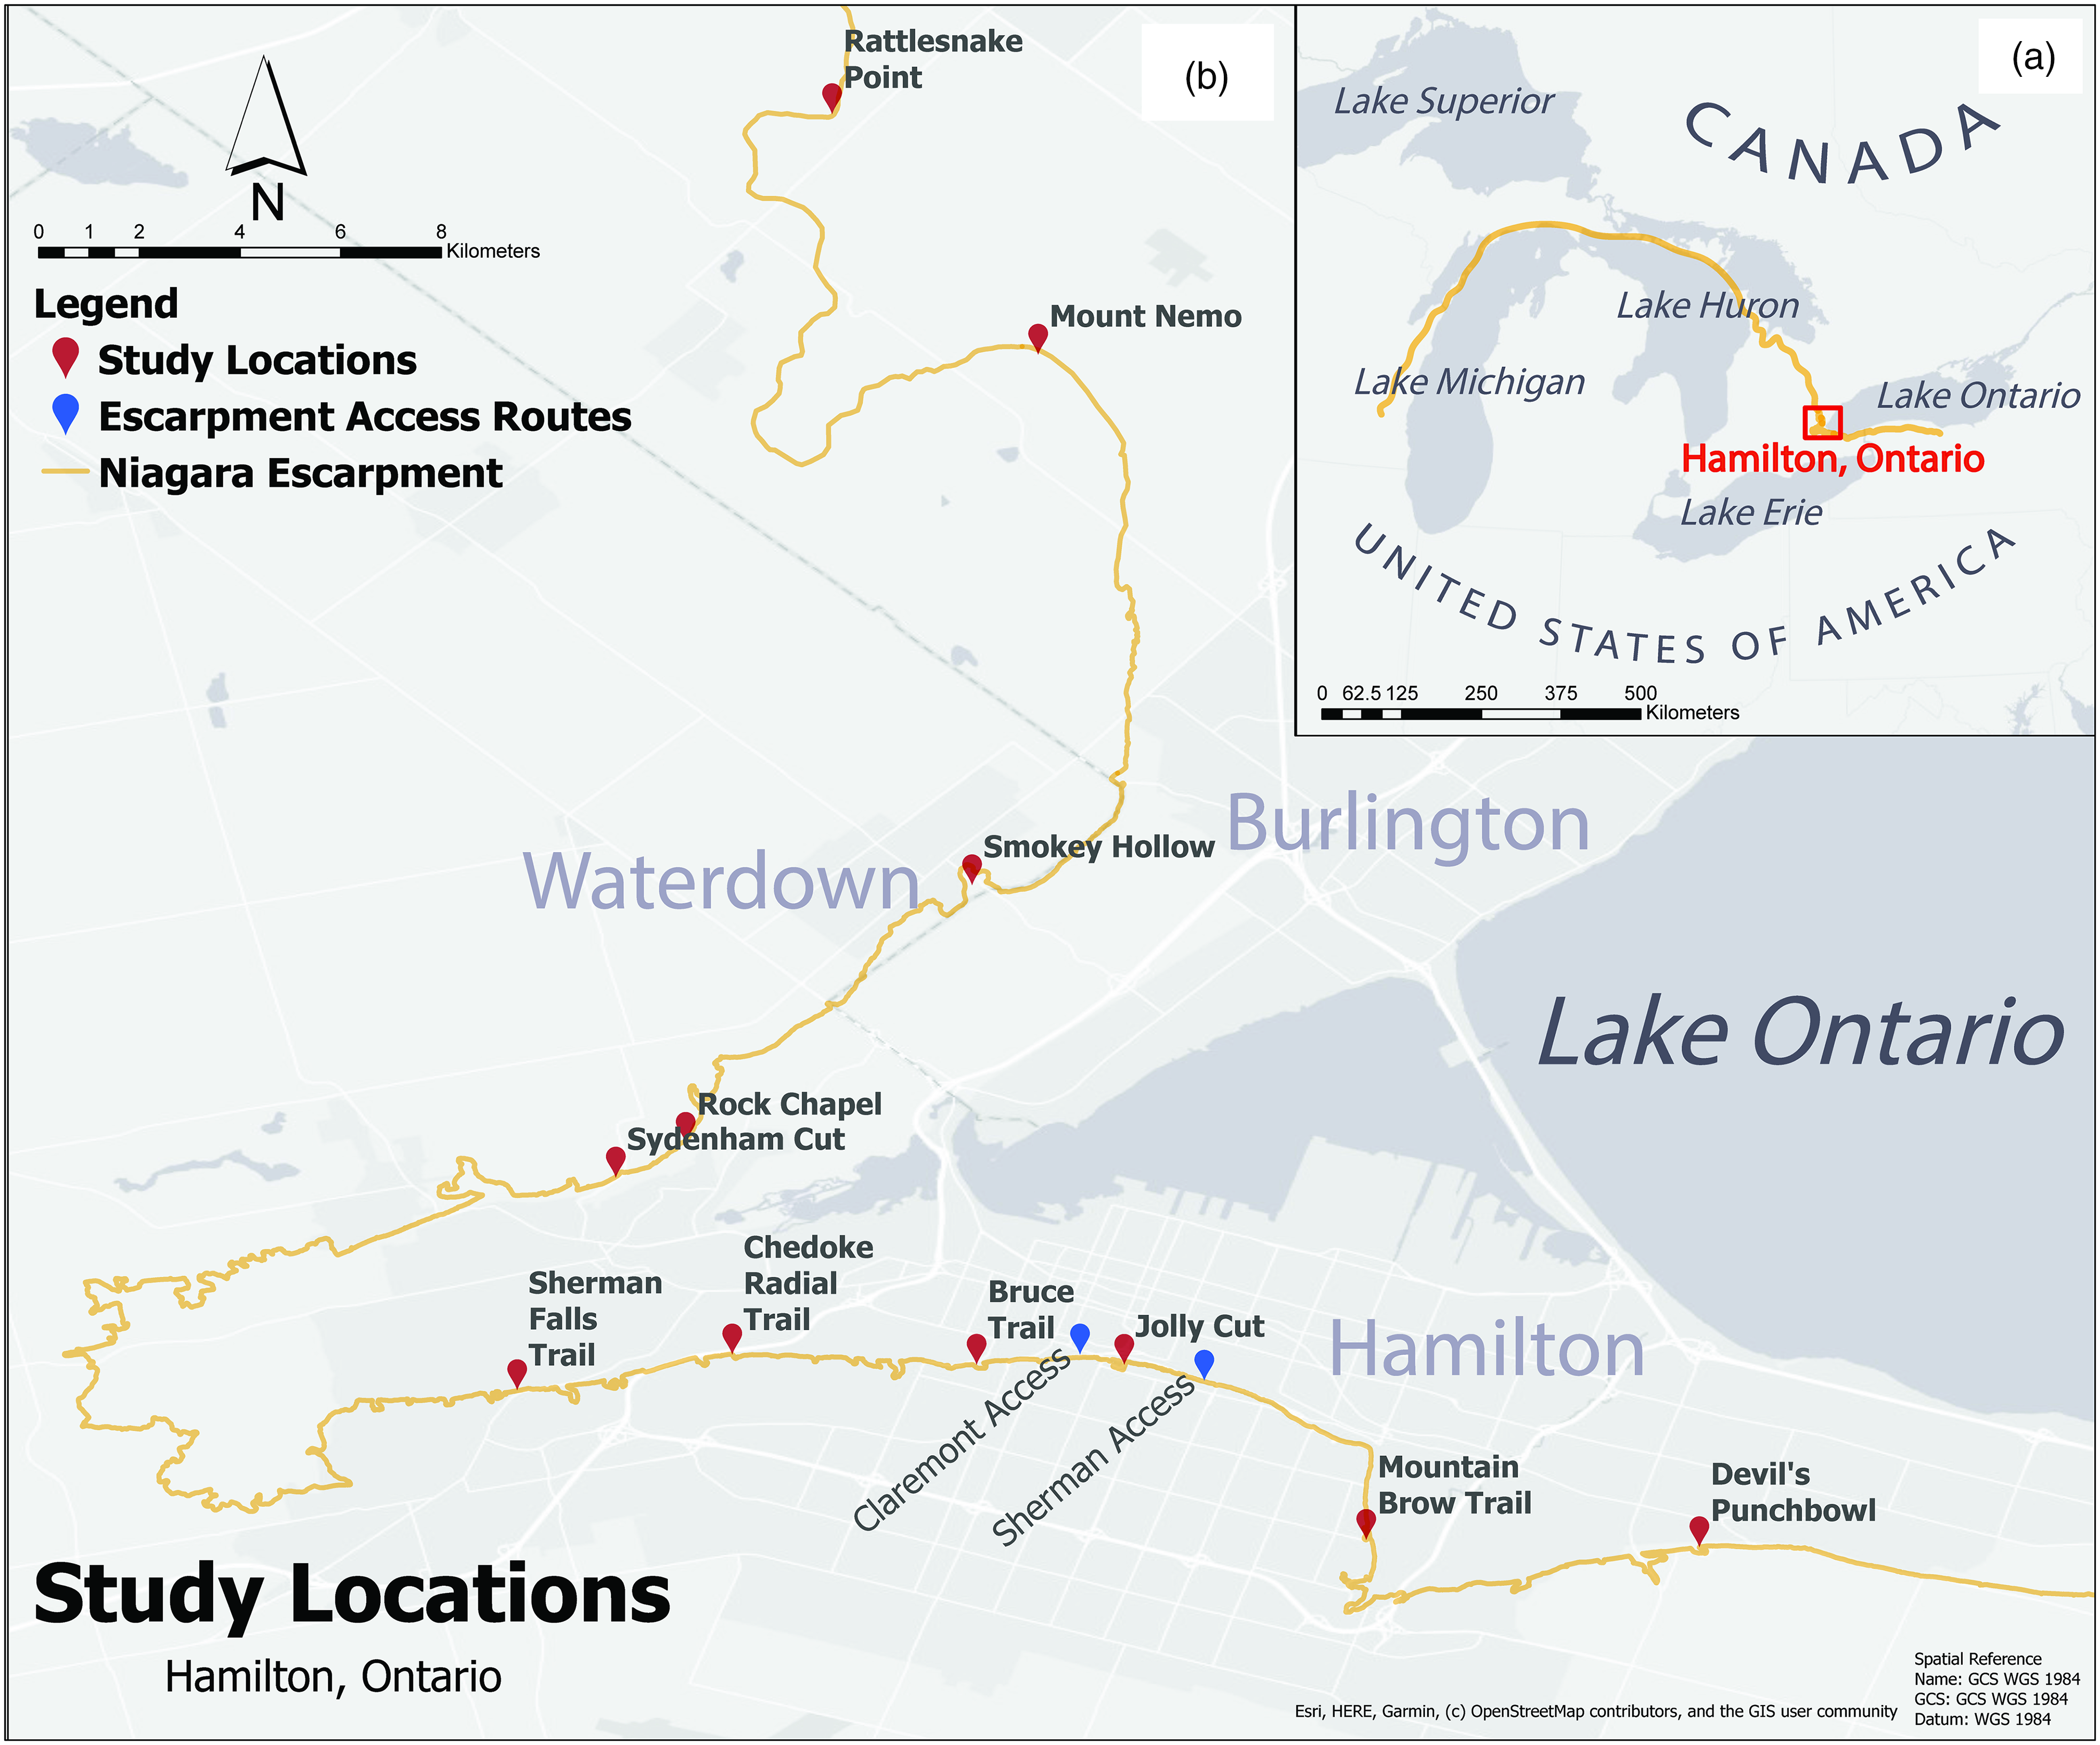
Fig. 2. (a) Map of southern Ontario and the northeastern United States showing the location of the study area near the westernmost part of Lake Ontario. (b) The location of the Niagara Escarpment near Hamilton, Ontario, where it crops out locally as a steep rock face up to 100 m high (Brunton & Brintnell, Reference Brunton and Brintnell2020). Study locations and urban escarpment access routes are marked at locations along the escarpment.
Along the Niagara Escarpment, the alternation of dolostone, shale and sandstone strata has resulted in an unstable rock face (Formenti et al. Reference Formenti, Peace, Waldron, Eyles and Lee2021). More easily eroded shales undercut overlying strata, leaving unstable overhangs of more erosion-resistant dolostones and sandstones (Chorley et al. Reference Chorley, Dunn and Beckinsale1964: 336–7; Hewitt, Reference Hewitt1971). Additionally, the bedded sedimentary rocks of the Niagara Escarpment, with a gentle southwestward dip of 0.3° (Brigham, Reference Brigham1971), are paired with extensive networks of sub-vertical fracture sets. This combination of discontinuities, in which sub-vertical fractures intersect sub-horizontal bedding planes, has promoted the removal of blocks of varying size from the rock face (Fig. 3; Gross & Engelder, Reference Gross and Engelder1991). Block failure and rockfall events are widely recognized to have high rates of occurrence on fractured bedrock slopes (e.g., Lambert et al. Reference Lambert, Thoeni, Giacomini, Casagrande and Sloan2012; Collins & Stock, Reference Collins and Stock2016; Lebedeva & Brantley, Reference Lebedeva and Brantley2017; Priebe et al. Reference Priebe, Brunton, Rudolph and Neville2019; Gage et al. Reference Gage, Eyles and Lee2021). These previous studies suggest that fracturing, in conjunction with fluid-flow and freeze–thaw processes, contributes substantially to erosion of cliff faces such as that of the Niagara Escarpment. This occurs when intersecting fractures compartmentalize the rock face into easily eroded blocks and create fluid migration pathways that further facilitate block removal.

Fig. 3. Examples of rockfalls at the Chedoke Radial Trail including: (a) a north-facing outcrop of the escarpment showing a limestone and shale rockfall originating from the Rochester Formation and lower Lockport Group; (b) a north-facing outcrop of the escarpment showing a dolostone rockfall from the lower Lockport Group just above the Rochester Formation; (c) a north-facing outcrop of the escarpment showing a dolostone rockfall from the Reynales Formation; and (d) an east-facing outcrop of the escarpment showing gaps in the dolostone rock face where rockfall occurred from the Lockport Group.
Due to the unique position of the Niagara Escarpment within the city of Hamilton (Fig. 2), infrastructure features, including escarpment access routes, hiking trails and nearby buildings, are placed at an elevated risk from block failure and slope instability (Van Dongen, Reference Van Dongen2016). Concerns regarding the stability of the escarpment have increased in recent years as the steep slopes have failed, causing rockfalls onto major escarpment access routes (Van Dongen, Reference Van Dongen2016; City of Hamilton, 2020). For example, a 2016 slope movement at the Claremont Access Route (Fig. 2) resulted in lane closures (Van Dongen, Reference Van Dongen2016). More recently, in October 2020, parts of the Sherman Access Route (Fig. 2) were closed due to construction efforts aimed at restoring slope stability (City of Hamilton, 2020). These events were well documented in local media as vehicle traffic was diverted in response to rockfall events and threats, emphasizing the need for a better understanding of the structural geology of the Niagara Escarpment, specifically fracture-induced rockfalls (Van Dongen, Reference Van Dongen2016; City of Hamilton, 2020).
To date, the characteristics of sub-vertical fractures in the sedimentary rocks exposed along the escarpment are understudied, yet they likely contribute to economically and socially significant slope failures by facilitating rockfalls (Van Dongen, Reference Van Dongen2016). The purpose of this study is therefore to quantify the distribution, geometry, relationships, and fluid-flow properties of fractures exposed along the Niagara Escarpment in the city of Hamilton to determine their role in creating geohazards.
Data and observations of fracture characteristics were collected in a field study and processed using computer-based directional statistics in the software OrientTM (Vollmer, Reference Vollmer2015) to define two primary fracture sets. These sets were subsequently modelled, using discrete fracture networks (DFNs) in the MOVETM (version 2019.1) structural geology modelling suite by Petroleum Experts Ltd, to determine the overall characteristics and distribution of fractures in the studied exposures. This work shows that sub-vertical geological fractures in the Niagara Escarpment present a first-order control on block formation and release, and that mitigation plans for local geohazards require detailed understanding of these fracture networks.
2. Geological setting
The Niagara Escarpment crops out discontinuously over c. 725 km, extending from New York State, through Ontario, to Wisconsin, and has a maximum local height in Hamilton of 100 m (Hewitt, Reference Hewitt1971). The stratigraphy and lithology of the Niagara Escarpment have been described in works by Hewitt (Reference Hewitt1971), Armstrong and Dodge (Reference Armstrong and Dodge2007) and Brunton and Brintnell (Reference Brunton and Brintnell2020). Primary lithologies include dolostone, shale and sandstone (Figs 1, 4) deposited during the Late Ordovician and Llandovery to Wenlock epochs of the Silurian Period in a relatively shallow epeiric sea in the Appalachian Basin (Armstrong & Dodge, Reference Armstrong and Dodge2007). The warm, shallow conditions favoured deposition of both bioclastic and fine-grained carbonates, producing carbonate-rich near-horizontal strata with varying fossil content (Armstrong & Dodge, Reference Armstrong and Dodge2007). In many locations along the Niagara Escarpment, these carbonate-rich deposits have been diagenetically converted to dolostone (Armstrong & Dodge, Reference Armstrong and Dodge2007).
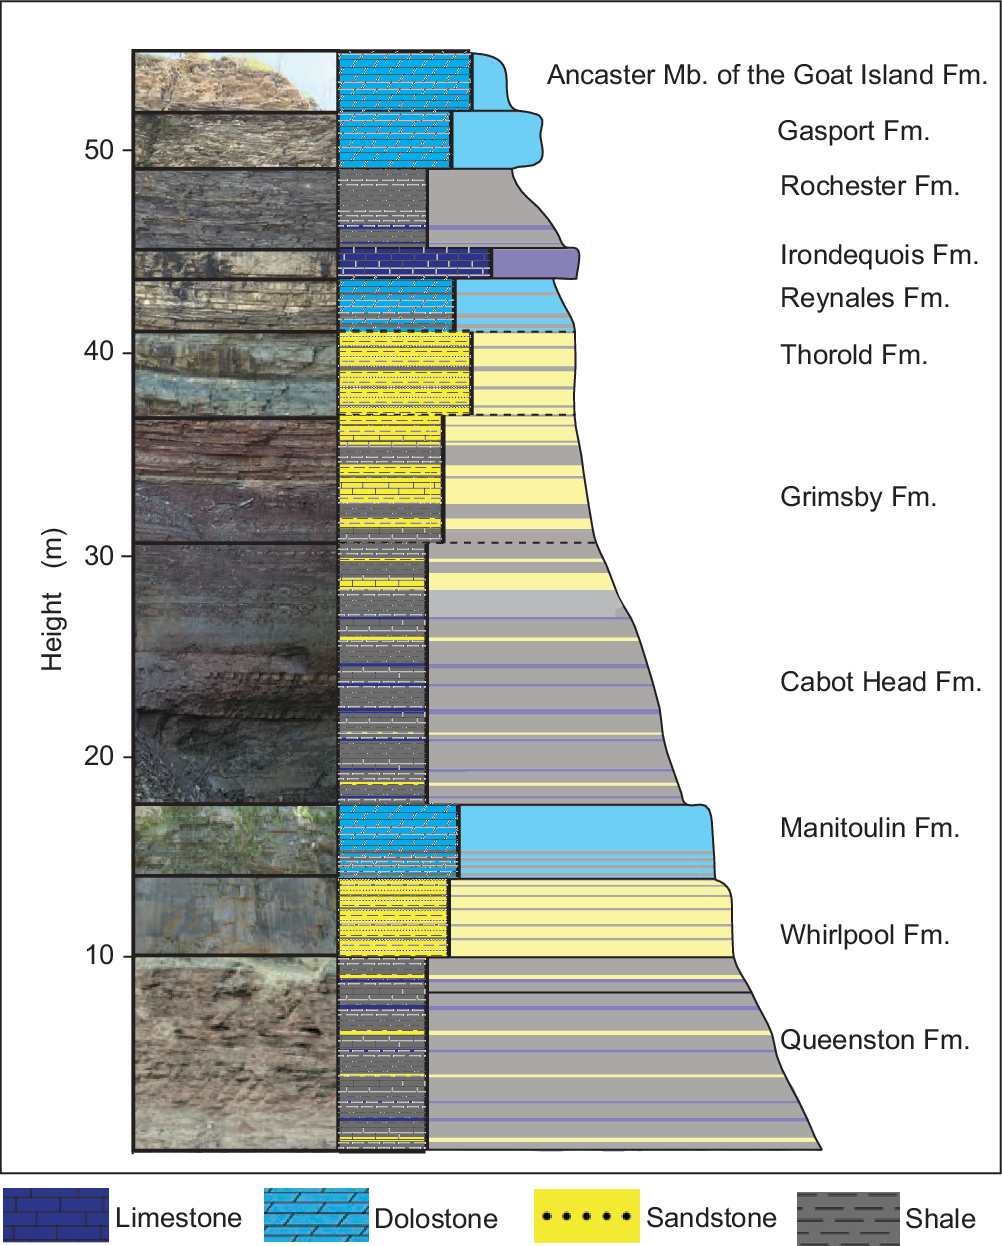
Fig. 4. The geological formations of the Niagara Escarpment and dominant lithologies cropping out in and around Hamilton, Ontario (Fig. 2; Brunton & Brintnell, Reference Brunton and Brintnell2020). The focus of the present study is the top two geological units, the Gasport Formation and the Ancaster Member of the Goat Island Formation, both part of the Lockport Group. These units are the source of significant and damaging rockfalls due to the height of the formation and undercutting of the underlying Rochester shale formation (Hayakawa & Matsukura, Reference Hayakawa and Matsukura2010; Van Dongen, Reference Van Dongen2016).
2.a. The Niagara escarpment
The Niagara Escarpment is an erosional cuesta, formed in part by differential erosion of alternating layers of shale, sandstone and carbonate-rich lithologies (Fig. 4; Hewitt, Reference Hewitt1971). Locally, the easily weathered Queenston and Rochester Formations, composed of shale, undercut the sub-vertical slopes of the more resistant Whirlpool sandstone and dolostone-rich Irondequoit Formation and Lockport Group, which form overhangs (Hewitt, Reference Hewitt1971; Brunton & Brintnell, Reference Brunton and Brintnell2020). This differential erosion yields an abrupt termination of strata at the escarpment face (Fig. 5; Chorley, et al. Reference Chorley, Dunn and Beckinsale1964: 336–7; Armstrong & Dodge, Reference Armstrong and Dodge2007; Hayakawa & Matsukura, Reference Hayakawa and Matsukura2010). Areas of the escarpment protected from basal undercutting have lower slope angles, whereas areas subject to active basal undercutting are characterized by steeper slopes; this highlights the importance of differential erosion processes in the development of extremely steep escarpment slopes in the Hamilton area (Fig. 5; Chorley et al. Reference Chorley, Dunn and Beckinsale1964: 336–7).

2.b. Studied lithological units
The Niagara Escarpment exposes a series of distinctive lithological units grouped into a number of regionally extensive formations (Armstrong & Dodge, Reference Armstrong and Dodge2007; Brunton & Brintnell, Reference Brunton and Brintnell2020; Fig. 4). This study focuses on sub-vertical fractures within formations exposed in the upper part of the Niagara Escarpment, above and including the Reynales Formation (Figs 3c, 5a); these upper units were selected for study as they are easily accessible in the city of Hamilton and have made the greatest contributions to significant rockfall events (Van Dongen, Reference Van Dongen2016). The uppermost formations, including the dolostone-rich Gasport Formation and Ancaster Member of the Goat Island Formation, are included in the Lockport Group (Brunton & Brintnell, Reference Brunton and Brintnell2020), and determine the overall stability of the uppermost part of the cuesta in Hamilton. The Lockport Group has experienced significant rockfalls due to its position overlying the Rochester Formation, which is composed of shale and tends to undercut overlying units (Hewitt, Reference Hewitt1971; Brunton & Brintnell, Reference Brunton and Brintnell2020). The following are brief descriptions of the lithological and structural characteristics of the geological units examined in this study (Fig. 4).
The Reynales Formation is composed of medium beds of laminated fine-grained dolostone with shale interbeds (Hewitt, Reference Hewitt1971). The proportion of shale increases upwards in the formation through increasing thicknesses of shale interbeds and an increase in the amount of shaly dolostone (Hewitt, Reference Hewitt1971; Brunton & Brintnell, Reference Brunton and Brintnell2020). The overlying Irondequoit Formation consists of a single massive unit of fossiliferous and highly bioturbated vuggy dolostone that has a relatively consistent thickness of between 1 and 2 m in the Hamilton area (Hewitt, Reference Hewitt1971; Figs 4, 5). This unit is overlain by the Rochester Formation, a relatively thick unit of grey, laminated shale with minor interbeds of dolostone and limestone which become more prominent upwards in the stratigraphy (Hewitt, Reference Hewitt1971; Brunton & Brintnell, Reference Brunton and Brintnell2020). The Lockport Group forms the resistant cap rock of the Niagara Escarpment, which consists of two distinct units, the Gasport Formation and the Ancaster Member of the Goat Island Formation, which are prominent in the Hamilton area (Armstrong & Dodge, Reference Armstrong and Dodge2007). The Gasport Formation lies at the base of the Lockport Group, and is composed of medium to thickly bedded fossiliferous dolostone with minor chert nodules and discontinuous thin shale interbeds and lenses (Brunton & Brintnell, Reference Brunton and Brintnell2020). The Ancaster Member of the Goat Island Formation has a gradational contact with the Gasport, and is composed of highly irregular and fractured thin to medium beds of dolostone with abundant chert nodules, typically elongated parallel to the bedding (Hewitt, Reference Hewitt1971; Brunton & Brintnell, Reference Brunton and Brintnell2020).
2.c. Fractures in the Niagara Escarpment
Within the studied outcrops in the Hamilton area (Fig. 2), discontinuities are present in two primary forms: (1) horizontal bedding discontinuities, separating strata and bedding habits of lithological units, and (2) sub-vertical, primarily stratabound joints (Fig. 6; Gross & Engelder, Reference Gross and Engelder1991; Priebe et al. Reference Priebe, Brunton, Rudolph and Neville2019). Slope stability is intrinsically linked to the characteristics and extent of these discontinuities, as fracturing controls the formation of blocks of rock that are subject to rockfalls from exposed rock faces (Priebe et al. Reference Priebe, Brunton, Rudolph and Neville2019, Reference Priebe, Frape, Jackson, Rudolph and Brunton2021).

Fig. 6. Geological fractures in (a) the lower Gasport Formation; (b) the middle Gasport Formation; and (c) the Ancaster Member of the Goat Island Formation of the Lockport Group. Horizontal bedding planes (grey) and sub-vertical joints (red) are indicated on the photographs.
In addition, Priebe et al. (Reference Priebe, Brunton, Rudolph and Neville2019, Reference Priebe, Frape, Jackson, Rudolph and Brunton2021) examined hydraulic conductivity values associated with the Palaeozoic carbonate groundwater systems in southern Ontario, concluding that high hydraulic conductivity correlates with dense fracture networks and karstic features (Priebe et al. Reference Priebe, Brunton, Rudolph and Neville2019). Flow is especially notable at stratigraphic breaks in the rocks compared to carbonate rock matrices, highlighting the importance of bedding planes, which connect sub-vertical joints, in controlling fluid-flow properties (Priebe et al. Reference Priebe, Brunton, Rudolph and Neville2019).
3. Methodology
In this study, fractures in rocks exposed along the Niagara Escarpment in Hamilton were quantified in three ways: (1) in the field, (2) by statistical analysis, and (3) through the construction of DFN numerical models. The study focused on stratabound joints and horizontal bedding planes within the dolostone formations including and lying above the Reynales Formation (Fig. 4). Fractures in the intervening shale formations were not quantified, as the fine-grained sedimentary rocks facilitate ductile deformation rather than brittle deformation and/or fractures were too small and closely spaced to be quantified (Sone & Zoback, Reference Sone and Zoback2014; Massaro et al. Reference Massaro, Corradetti, Vinci, Tavani, Iannace, Parente and Mazzoli2018).
3.a. Field data acquisition
Fractures have a quantifiable orientation and aperture (Schultz, Reference Schultz2019) which can be documented for a range of purposes including the understanding of hydrocarbon reservoirs (Massaro et al. Reference Massaro, Corradetti, Vinci, Tavani, Iannace, Parente and Mazzoli2018, Reference Massaro, Corradetti, Tramparulo, d’Assisi, Prinzi, Iannace, Parente, Invernizzi, Morsalnejad and Mazzoli2019; Giuffrida et al. Reference Giuffrida, La Bruna, Castelluccio, Panza, Rustichelli, Tondi, Giorgioni and Agosta2019, Reference Giuffrida, Agosta, Rustichelli, Panza, La Bruna, Eriksson, Torrieri and Giorgioni2020), structural inheritance and fluid-flow properties (Gross & Engelder, Reference Gross and Engelder1991; Eyles & Scheidegger, Reference Eyles and Scheidegger1995; Peace et al. Reference Peace, Dempsey, Schiffer, McCaffrey, Imber and Phethean2018; Samsu et al. Reference Samsu, Cruden, Micklethwaite, Grose and Vollgger2020). Semi-automated methods of fracture quantification have also been developed which have been shown to be useful in the acquisition of large data sets, in addition to limiting observer biases (Thiele et al. Reference Thiele, Grose, Samsu, Micklethwaite, Vollgger and Cruden2017; Lee et al. Reference Lee, Maclachlan and Eyles2020; Palamakumbura et al. Reference Palamakumbura, Krabbendam, Whitbread and Arnhardt2020; Samsu et al. Reference Samsu, Cruden, Micklethwaite, Grose and Vollgger2020). While digital quantification methods minimize observer biases, manual observations allow measurements to be taken on a case-by-case basis and are most appropriate for documenting complex fracture patterns (Thiele et al. Reference Thiele, Grose, Samsu, Micklethwaite, Vollgger and Cruden2017; Andrews et al. Reference Andrews, Roberts, Shipton, Bigi, Tartarello and Johnson2019). In this study, we use a manual method for fracture quantification (Mauldon et al. Reference Mauldon, Dunne and Rohrbaugh2001; Watkins et al. Reference Watkins, Bond, Healy and Butler2015; Andrews et al. Reference Andrews, Roberts, Shipton, Bigi, Tartarello and Johnson2019), rather than a digital method (Thiele et al. Reference Thiele, Grose, Samsu, Micklethwaite, Vollgger and Cruden2017; Lee et al. Reference Lee, Maclachlan and Eyles2020; Palamakumbura et al. Reference Palamakumbura, Krabbendam, Whitbread and Arnhardt2020; Samsu et al. Reference Samsu, Cruden, Micklethwaite, Grose and Vollgger2020), as it allows more detailed examination of the relationship between fracture strike direction and the orientation of the rock face (Thiele et al. Reference Thiele, Grose, Samsu, Micklethwaite, Vollgger and Cruden2017; Andrews et al. Reference Andrews, Roberts, Shipton, Bigi, Tartarello and Johnson2019), a relationship that is highly variable in the study location. To minimize observational biases in measuring fracture orientation, ≥30 measurements by a single observer were made in each survey (Mauldon & Dershowitz, Reference Mauldon and Dershowitz2000; Andrews et al. Reference Andrews, Roberts, Shipton, Bigi, Tartarello and Johnson2019).
Manual fracture quantification was completed using both scanline and areal (also called ‘window’ (Watkins et al. Reference Watkins, Bond, Healy and Butler2015)) surveys, both of which are standard methods used in similar studies (Gross & Engelder, Reference Gross and Engelder1991; Watkins et al. Reference Watkins, Bond, Healy and Butler2015; Massaro et al. Reference Massaro, Corradetti, Vinci, Tavani, Iannace, Parente and Mazzoli2018, Reference Massaro, Corradetti, Tramparulo, d’Assisi, Prinzi, Iannace, Parente, Invernizzi, Morsalnejad and Mazzoli2019; Andrews et al. Reference Andrews, Roberts, Shipton, Bigi, Tartarello and Johnson2019; Giuffrida et al. Reference Giuffrida, La Bruna, Castelluccio, Panza, Rustichelli, Tondi, Giorgioni and Agosta2019, Reference Giuffrida, Agosta, Rustichelli, Panza, La Bruna, Eriksson, Torrieri and Giorgioni2020). Surveys of both types were completed initially to capture vertical and horizontal variations in fracture distribution. Strike and dip of fractures were measured using a compass–clinometer, while aperture was recorded using a digital caliper in the centre of each fracture within the survey areas, or where the scanline intersected the fracture. Bedding thickness was also recorded.
Scanline fracture quantification involved establishing a level datum on an outcrop and recording fracture attributes (strike, dip and aperture) for all fractures intersecting the line (Gross & Engelder, Reference Gross and Engelder1991; Watkins et al. Reference Watkins, Bond, Healy and Butler2015). Scanlines were selected to ideally be 10 m in length, although shorter scanlines were necessary for the Ancaster Member due to the intensity of fractures in these strata for feasibility. When a greater length of outcrop was available, longer scanlines were surveyed. The scanline methodology allows fracture distribution to be measured laterally across an outcrop, but is subject to orientation bias, as the scanline does not intersect sub-horizontal bedding planes, which were also quantified as discontinuities in this study (Watkins et al. Reference Watkins, Bond, Healy and Butler2015).
Area surveys were completed by marking an area (window) on the outcrop of interest and then quantifying each fracture within the area, together with those intersecting its borders, to capture multiple stratigraphic layers (Watkins et al. Reference Watkins, Bond, Healy and Butler2015). This method should involve consistent area size between study sites, and is associated with minimum orientation bias (Watkins et al. Reference Watkins, Bond, Healy and Butler2015). Areas were selected to be ideally 1 m × 1 m in dimensions for most surveys, although some surveys of the Ancaster Member of the Goat Island Formation were slightly smaller (0.5 to 0.75 m by 0.5 to 0.75 m).
Outcrops of interest were located along the exposed, high-angle cliff face of the Niagara Escarpment in Hamilton (Fig. 5) with the help of satellite imagery. The following criteria were used in selecting study sites: (1) a minimum of 10 m in length and 1 m in height, (2) inclusion of at least one of the lithological units identified for the study, and (3) safe accessibility for the observer.
Fracture characteristics (strike, dip and aperture) were documented at 11 sites across Hamilton (Fig. 2) using both scanline and area surveys. Data from seven sites (Rock Chapel, Sydenham Cut, the Sherman Falls Trail, the Chedoke Radial Trail, the Bruce Trail, Jolly Cut and Mountain Brow Trail; Fig. 2) were selected and used for further analyses due to their visual lithological homogeneity. These sites were used to produce a representative model of fracture characteristics for the uppermost units of the Lockport Group. Data from other study locations (Fig. 2) were excluded from statistical analysis and DFN modelling because they did not pertain to the Lockport Group (e.g. Smokey Hollow), did not reflect primary local lithologies in Hamilton (e.g. Rattlesnake Point and Mt Nemo) and/or lacked sufficient measurements (e.g. Devil’s Punchbowl). However, the data from these excluded sites were used to document overall fracture and rockfall characteristics, and regional context.
Subsequent analyses to define and model fracture sets were conducted separately for the Gasport Formation and overlying Ancaster Member of the Goat Island Formation as these units continuously crop out at each study site and are associated with most rockfall events. The collected data were divided into four groups based on the method of acquisition and sampled stratigraphic unit as follows:
-
(1) Area survey data from the Gasport Formation, comprising 11 surveys (n = 313);
-
(2) Scanline survey data from the Gasport Formation, comprising 11 surveys (n = 404);
-
(3) Area survey data from the Ancaster Member, comprising 9 surveys (n = 310);
-
(4) Scanline survey data from the Ancaster Member, comprising 7 surveys (n = 249).
These data groups are analysed and discussed in detail in the following subsections. Statistical analyses were conducted on each individual data set listed above, while DFN modelling combined the scanline survey data sets and the area survey data sets to model each unit (Fig. 4).
3.b. Statistical analysis and data preparation
Data collected from field surveys of different study sites along the escarpment (Fig. 2) were analysed to identify statistical patterns (Fig. 7). The data were prepared for analysis by defining sets of sub-parallel fractures from the collected field data based on observed fracture strike. In order to consider such linear features in a three-dimensional (3-D) vector space, trend and plunge values of poles for each measurement were entered into OrientTM spherical data analysis software (version 3.12.0; Vollmer, Reference Vollmer2015) in which analysis was conducted. Statistical analysis of the fractures involved calculating the mean fracture aperture, identifying strike orientation clusters and calculating the respective maximum and minimum eigenvectors and associated confidence intervals for each fracture set in each data group (Vollmer, Reference Vollmer1990, Reference Vollmer1995). Apertures measured as <1 mm were assigned representative values of 0.5 mm in the statistical analyses. In addition, some fractures had apertures that were not measurable, and thus were excluded from average calculations. As most beds identified in this study had sub-horizontal orientation, fractures parallel to beds were treated as horizontal discontinuities and excluded from the generated spherical projections (Fig. 8). In Orient, cluster analysis and cones of confidence were used to define sub-vertical joint sets (Vollmer, Reference Vollmer1990, Reference Vollmer1995).

Fig. 7. PGR (point-girdle-random) plots of the N–S and E–W joint sets for (a) the Gasport Formation area surveys; (b) the Gasport Formation scanline surveys; (c) the Ancaster Member area surveys; and (d) the Ancaster Member scanline surveys. All joint sets plot closest to the P (point) index, indicating that they represent a point distribution.

Fig. 8. Fracture orientations plotted as poles from field data shown on equal-area spherical projections produced in Orient (Vollmer, Reference Vollmer2015) for (a) the Gasport Formation area surveys; (b) the Gasport Formation scanline surveys; (c) the Ancaster Member area surveys; and (d) the Ancaster scanline surveys. The N–S and E–W sets were defined using the cluster analysis function in Orient with the respective minimum and maximum eigenvectors representing the locations of minimum and maximum pole density, respectively (Vollmer, Reference Vollmer1990).
3.c. Discrete fracture network (DFN) modelling in MOVETM
The escarpment strata and fractures documented in the field were modelled in MOVETM, a discrete fracture network (DFN) modelling program successfully applied in many previous studies (Panza et al. Reference Panza, Agosta, Zambrano, Tondi, Prosser, Giorgioni and Janiseck2015, Reference Panza, Agosta, Rustichelli, Zambrano, Tondi, Prosser, Giorgioni and Janiseck2016; Massaro et al. Reference Massaro, Corradetti, Vinci, Tavani, Iannace, Parente and Mazzoli2018, Reference Massaro, Corradetti, Tramparulo, d’Assisi, Prinzi, Iannace, Parente, Invernizzi, Morsalnejad and Mazzoli2019; Giuffrida et al. Reference Giuffrida, La Bruna, Castelluccio, Panza, Rustichelli, Tondi, Giorgioni and Agosta2019, Reference Giuffrida, Agosta, Rustichelli, Panza, La Bruna, Eriksson, Torrieri and Giorgioni2020; Rimando & Peace, Reference Rimando and Peace2021). DFNs are computer-based, stochastic models that represent the geometrical characteristics of fracture networks, from which porosity and hydraulic conductivity can be estimated (Panza et al. Reference Panza, Agosta, Zambrano, Tondi, Prosser, Giorgioni and Janiseck2015, Reference Panza, Agosta, Rustichelli, Zambrano, Tondi, Prosser, Giorgioni and Janiseck2016; Lei, Latham & Tsang, Reference Lei, Latham and Tsang2017; Massaro et al. Reference Massaro, Corradetti, Vinci, Tavani, Iannace, Parente and Mazzoli2018, Reference Massaro, Corradetti, Tramparulo, d’Assisi, Prinzi, Iannace, Parente, Invernizzi, Morsalnejad and Mazzoli2019; Giuffrida et al. Reference Giuffrida, La Bruna, Castelluccio, Panza, Rustichelli, Tondi, Giorgioni and Agosta2019, Reference Giuffrida, Agosta, Rustichelli, Panza, La Bruna, Eriksson, Torrieri and Giorgioni2020).
Massaro et al. (Reference Massaro, Corradetti, Vinci, Tavani, Iannace, Parente and Mazzoli2018) used the MOVETM software to model a series of DFNs in dolostones in Italy, linking the fracture properties of individual beds to determine resultant characteristics in the rock mass. A similar approach was used herein to model strata of the Niagara Escarpment based on data collected in the field. It should be noted that the model size and number of modelled beds were limited by the available computational power.
In this study, beds from the Ancaster Member of the Goat Island Formation were modelled, forming a total model domain volume of c. 5 m × 5 m × 5 m (Fig. 9). We modelled horizontal bedding planes as DFNs since bedding discontinuities contribute to fluid flow. As the regional bedding in the study area is very close to horizontal according to our observations and previous work (dipping ∼0.3° towards the south; Formenti et al. Reference Formenti, Peace, Waldron, Eyles and Lee2021), bedding discontinuities were considered horizontal in both models. Two separate models were produced, each comprised of beds from both the Gasport Formation and the Ancaster Member, one using data from area surveys and a second using data from scanline surveys. This was done to examine the differences, if any, between area and scanline data and to test the reproducibility of the modelling process. The model-building process is summarized in Fig. 9.

Fig. 9. Workflow from field data acquisition through modelling in MOVETM created to model the sub-vertical joints and bedding planes of the Niagara Escarpment in the Hamilton area.
To produce DFNs in MOVETM, input parameters were derived from field data (Tables 1–3). The models were built by defining sedimentary beds, separated by horizontal, manually placed fractures representing bedding discontinuities, and assigning each bed two DFNs representative of the two sub-vertical joint sets observed in the field (N–S and E–W striking sets; Fig. 10). Parameters were defined using mean values from field measurements and their associated confidence intervals (Table 1). Bed thicknesses, fracture apertures and the strike of joint sets were derived from fracture set characteristics selected for each bed by generating semi-random parameters from a Gaussian distribution of parameters measured in the field. The values were used to define bed thicknesses, apertures and strikes of the joint sets.
Table 1. Average orientations and confidence intervals of fracture sets, apertures and bedding thicknesses used to derive model parameters. These values were calculated from field data

Table 2. Final parameters for the area survey model derived from field data and the literature. These parameters were used in the fracture modelling module in MOVETM to generate unique pairs of DFNs (composed of a N–S set and an E–W set) which were repeated three times for a total of nine beds in each formation. An additional DFN was created to represent the beds

Table 3. Final parameters for the scanline survey model derived from field data and the literature. These parameters were used in the fracture modelling module in MOVETM to generate unique pairs of DFNs (composed of a N–S set and an E–W set) which were repeated three times for a total of nine beds in each formation. An additional DFN was created to represent the beds


Fig. 10. Two different views of 3D DFN models produced in MOVETM for the Lockport Group from area survey data (a, b) and scanline survey data (c, d). The DFNs for the Lockport Group comprise two units in Hamilton: the Gasport Formation joints (blue and teal) and the Ancaster Member joints (red and orange). Each unit comprises nine beds for each Member containing two stratabound joint sets generated with the fracture modelling module in MOVETM. Both models have a width and length of 5 m, while the height varies based on the bedding thicknesses, totalling to 5 m for the area survey model and 4.8 m for the scanline survey model. The bedding planes (grey) are modelled as a DFN representative of their role as a real-world geological discontinuity.
The fracture aspect ratio applied in the DFNs was selected based on values from within the literature (Odling, Reference Odling1997; Olson, Reference Olson2003; Massaro et al. Reference Massaro, Corradetti, Vinci, Tavani, Iannace, Parente and Mazzoli2018, Reference Massaro, Corradetti, Tramparulo, d’Assisi, Prinzi, Iannace, Parente, Invernizzi, Morsalnejad and Mazzoli2019). To facilitate the construction of the DFNs, the dip of the bedding-confined fractures was set constant at 90° as the majority (87 %) of joints measured from both the Gasport and Ancaster were sub-vertical (dip above 75°).
Once the DFNs based on the field data obtained by area and scanline acquisition methods were constructed, calculation of the porosity and permeability resulting from the synthetic fractures across the entire domain volume was undertaken using a resolution defined by 5 cm × 5 cm × 5 cm cubic cells. Giuffrida et al. (Reference Giuffrida, La Bruna, Castelluccio, Panza, Rustichelli, Tondi, Giorgioni and Agosta2019) successfully modelled stratabound fractures with DFNs in MOVETM using a 20 cm × 20 cm × 20 cm cell size for a 7 m × 7 m × 7 m model volume. This suggests that the 5 cm × 5 cm × 5 cm cell size utilized herein is more than sufficient to quantify and predict the hydraulic properties of interest. Two DFN models (Fig. 10) were produced, in which all fluid flow was assumed to occur via geological fractures; no further lithological parameters are included in these models as fractures are considered to have the dominant influence on fluid-flow properties (Allan & Sun, Reference Allan and Sun2003; Massaro et al. Reference Massaro, Corradetti, Vinci, Tavani, Iannace, Parente and Mazzoli2018, Reference Massaro, Corradetti, Tramparulo, d’Assisi, Prinzi, Iannace, Parente, Invernizzi, Morsalnejad and Mazzoli2019; Giuffrida et al. Reference Giuffrida, La Bruna, Castelluccio, Panza, Rustichelli, Tondi, Giorgioni and Agosta2019, Reference Giuffrida, Agosta, Rustichelli, Panza, La Bruna, Eriksson, Torrieri and Giorgioni2020). Modelled permeability is considered to be representative of migration pathways for meteoritic water in the fracture networks.
4. Results
4.a. Field observations
Observations from the field sites show two distinct sub-vertical fracture sets with different orientations, along with bed-parallel sub-horizontal discontinuities, making up three fracture sets in total (Figs 2, 4, 5). Bed thickness varies in each lithological unit. All sites display sub-vertical, primarily stratabound joints, formed without shear offset, representing mode I fractures. While most of these fractures abut horizontal beds, some throughgoing fractures were observed. Visually, chert nodules, which typically form horizontal lenses of c. 10 cm in diameter, appear to facilitate the propagation and deflection of irregular joint patterns, often changing the orientation of the joints, which run along the edges of the chert nodules. Numerous micro-fractures were observed within the chert nodules but were not included in this analysis. Chert nodules were observed to increase in frequency upwards through the studied sections, with relatively few in the Gasport Formation (Fig. 6a, b) and many in the Ancaster Member of the Goat Island Formation (Fig. 6c). The resulting joint deflections made the measurement of fracture orientation in the Ancaster Member particularly challenging.
Shale interbeds, such as those separating dolostone beds in the Reynales Formation (Figs 2c, 3) at the Chedoke Radial Trail (Fig. 2), terminate sub-vertical joints. Joints cross-cutting sub-horizontal bedding planes, observed in other formations where bedding discontinuities occur between two carbonate lithologies, are not observed in shales, suggesting that deformation in shale was mesoscopically ductile, and therefore did not develop visible fractures (Sone & Zoback, Reference Sone and Zoback2014; Massaro et al. Reference Massaro, Corradetti, Vinci, Tavani, Iannace, Parente and Mazzoli2018).
4.b. Statistical analysis of joint orientations
Statistical analysis of joint orientation data collected in the field demonstrated that the sub-vertical joints make up two distinct sets striking roughly N–S and E–W respectively (Figs 7, 8). Both sets were not visible simultaneously at individual field sites as each site consisted of a single two-dimensional rock face (Fig. 6). One exception was at a curved section of the rock face on the Chedoke Radial Trail (Fig. 2) which exposed the two sub-vertical joint sets later identified through analysis of field measurements. Plotting data collected at sites with different aspects on equal-area spherical projections clearly shows the two fracture sets with two dense clusters of poles (Fig. 8).
The equal-area spherical projections (Fig. 8) paired with point-girdle-random (PGR) distribution plots (Fig. 7) show that both joint sets form point distributions (Vollmer Reference Vollmer2015), corresponding to clusters of similarly striking joints, which guided cluster analysis. Two clusters were identified and summarized by calculating the maximum and minimum eigenvectors for each cluster (ϵ 1 and ϵ 3). The average strikes from ϵ 1 for each joint set in each data group are presented in Table 1 with the respective confidence limits derived from the elliptical cones of confidence.
By definition, ϵ 3 plots at the point of lowest fracture density and is oriented 90° from the point of highest density (Vollmer, Reference Vollmer1990). Orientations of ϵ 3 for each of the two sub-vertical joint sets (Fig. 8) lie near the origin of the projection, corresponding to planes with dip ≈ 0°. If all sub-vertical joints making up the fracture sets had a dip of 90°, as assumed in the models, the ϵ 3 values would be representative of the bedding planes, being oriented 90° from the joints. The data do not consist of exclusively vertical joints; however, since the ϵ 3 values plot as poles representative of planes with a dip of 0°, our inference that the high-angle joints are bounded by horizontal or sub-horizontal discontinuities is supported mathematically.
4.c. Discrete fracture network modelling results
The two DFNs produced in this study, generated from two different sets of data (i.e. scanline- and area-survey-derived data), are shown in Figure 10, and the resultant corresponding porosity and meteoritic water migration pathway models are shown in Figure 11. The models show that similar patterns are displayed by either set of input data (from area- or scanline-derived measurements), and that a clear distinction between the hydraulic and fracture parameters of the Gasport Formation and Ancaster Member can be identified. The porosity and fluid migration pathway models in both the area and scanline DFNs show that the longer and deeper fractures present in the Gasport Formation compared to the Ancaster Member lead to a higher degree of horizontal connectivity in the Gasport.

Fig. 11. The permeability (red scale), calculated in darcys (Oda, Reference Oda1985), and porosity (blue scale), calculated as the ratio of fracture volume to cell volume, of each model are displayed with a 125 cm3 cell size. Three faces of the 3D model are shown: the north face, the bottom face (showing joints in the Gasport Formation) and the top face (showing joints in the Ancaster Member). Note that the permeability and porosity scales are different for the area survey model (a, b) and the scanline survey model (c, d) due to variations in aperture. The larger fracture apertures in the scanline model drastically increased the permeability and porosity values, rendering the need for a different scale. Cells with calculated values of zero (inactive cells) are excluded from the modelling for viewing ease. These areas are representative of solid blocks of rocks containing no joints.
In addition, all three modelled fracture sets show a high degree of connectivity in three dimensions, in both DFNs created from the scanline and area data (Fig. 11). The three fracture sets are all oriented approximately perpendicular to one another, forming discrete rectangular blocks. This is consistent with the field observations of displaced blocks from rockfalls (Fig. 3). The DFNs illustrate how smaller blocks are formed in the Ancaster Member because of the abundance of shorter, more densely clustered joints, and thinner beds, in comparison to blocks released from the Gasport Formation (Fig. 6).
Fluid-flow magnitude (Fig. 11) is proportional to the aperture of the joint sets, and thus the scanline model yields substantially greater porosity and permeability values due to larger apertures provided as input parameters (Table 3).
5. Discussion
5.a. Escarpment rockfalls and implications for geohazards
This study identifies three sets of discontinuities in the studied sites along the Niagara Escarpment, striking at c. 90° to one another, which facilitate the release of rectangular blocks from the exposed rock face (Fig. 3). From the results of this study, we hypothesize that geological fractures present a primary control on the size of blocks included in rockfalls generated along the face of the escarpment. The size of blocks corresponds to fracture density and bedding thickness, block size being proportional to stratigraphic bed thickness and inversely proportional to fracture density. Quantifying block size in the field was beyond the scope of this study. However, the three-dimensional models produced (Fig. 9) illustrate rock compartmentalization by fractures similar to that described by Massaro et al. (Reference Massaro, Corradetti, Vinci, Tavani, Iannace, Parente and Mazzoli2018, Reference Massaro, Corradetti, Tramparulo, d’Assisi, Prinzi, Iannace, Parente, Invernizzi, Morsalnejad and Mazzoli2019). The modelled block size can be compared with qualitative observations (Fig. 3) from rockfall events, yielding a practical application of the workflow presented herein.
The DFN results demonstrate how the Gasport Formation generally produces fewer but larger blocks compared to the overlying Ancaster Member of the Goat Island Formation, due to differences in bedding thickness (Formenti et al. Reference Formenti, Peace, Waldron, Eyles and Lee2021) and fracture density. The larger blocks released from the Gasport Formation present the potential for greater damage and risk to urban infrastructure around Hamilton (Fig. 2). However, the Ancaster Member may have a higher frequency of dispersal of lower-mass blocks. Both of these units of the Lockport Group are commonly found in close proximity to urban infrastructure around Hamilton, and their fracture characteristics thus require consideration from a geohazard risk and mitigation perspective. The workflow used in this study could practically be applied in the characterization (in terms of block size), and management (in terms of risk analysis), of rockfall events. It may be used to enhance understanding of the 3-D nature of fracture networks in local rock outcrops and the creation of different block volumes via the intersection of the three perpendicular fracture sets. However, it should be noted that variations in lithology will affect fracture and rock block geometry such that the model presented here is only applicable in the present study area.
5.b. Fluid flow through rocks of the Niagara Escarpment
Field observations show that sub-vertical joints are consistently connected via bedding planes, thereby yielding high porosity and permeability. Permeability was calculated in MOVETM, but since the models are based on DFN characteristics and the nature of the rock matrix was not considered, the results more accurately describe fluid migration pathways through the rock body. Erosion is commonly facilitated by fluid flow (Collins & Stock, Reference Collins and Stock2016; Lebedeva & Brantley, Reference Lebedeva and Brantley2017; Gage et al. Reference Gage, Eyles and Lee2021) and this is especially true for the carbonate strata of the Niagara Escarpment where interbedded shales with low permeability force fluids into the carbonates (Priebe et al. Reference Priebe, Brunton, Rudolph and Neville2019, Reference Priebe, Frape, Jackson, Rudolph and Brunton2021). The fracture apertures used in the Gasport scanline survey model (Table 3) were larger than those used in the area survey model (Table 2). This was unexpected, but possible given the input parameters and semi-random parameter selection using a Gaussian distribution. This yielded far higher porosity and permeability values for the scanline survey model of the Gasport Formation compared to the area survey model, so much so that the resolution of the model domain itself appears coarser due to the greater range of values between cells with and without fractures. Although the large differences in calculated fluid-flow values cause visual presentation challenges, this demonstrates a worthwhile point. The aperture of joints has a significant effect on fracture-induced fluid-flow properties. Since a wide range of apertures were observed at the studied sites on the Niagara Escarpment (<1 mm to >40 mm wide), fluid-flow properties should also be considered to be highly variable. This study also supports previous works (Allan & Sun, Reference Allan and Sun2003; Massaro et al. Reference Massaro, Corradetti, Vinci, Tavani, Iannace, Parente and Mazzoli2018, Reference Massaro, Corradetti, Tramparulo, d’Assisi, Prinzi, Iannace, Parente, Invernizzi, Morsalnejad and Mazzoli2019; Giuffrida et al. Reference Giuffrida, La Bruna, Castelluccio, Panza, Rustichelli, Tondi, Giorgioni and Agosta2019, Reference Giuffrida, Agosta, Rustichelli, Panza, La Bruna, Eriksson, Torrieri and Giorgioni2020) that suggest fracture aperture (Fig. 11) exerts a first-order control on fluid-flow properties.
The variability in fracture aperture recorded in this study, paired with the associated variability in fluid-flow properties, suggests that erosion potential is highly variable along the escarpment. Examination of fractures and block formation from individual sites would be a useful means of predicting the highly variable geohazards associated with rockfalls around the City of Hamilton.
5.c. Fracture formation in the Niagara Escarpment
The results of this study, in conjunction with previous works, have allowed us to consider the characteristics of, and mechanisms governing the origin of, the sub-vertical joint sets. More research is needed to confirm the origin of these joints, although the following discussion introduces some of the possible factors contributing to their formation.
Along the Niagara Escarpment, fractures may be related to: (1) horizontal regional tectonic stress (Heidbach et al. Reference Heidbach, Rajabi, Reiter and Ziegler2016 and references therein; Gross & Engelder, Reference Gross and Engelder1991), (2) structural inheritance from underlying bedrock joints (Eyles & Scheidegger, Reference Eyles and Scheidegger1995; Eyles et al. Reference Eyles, Arnaud, Scheidegger and Eyles1997), (3) non-tectonic stresses due to post-glacial rebound from the retreat of the Laurentide Ice Sheet (Quinlan, Reference Quinlan1984; Adams, Reference Adams1989), and (4) post-glacial freeze–thaw action (Moss & Nickling, Reference Moss and Nickling1980; Fahey & Lefebure, Reference Fahey and Lefebure1988). These hypotheses all relate to the sub-vertical joint sets, which abut at bedding planes formed during deposition and are discussed in the following subsections. Throughgoing fractures were found to be less common and are not the focus of the present study.
5.c.1. Regional tectonic stress
Hancock and Engelder (1989) and Gross and Engelder (Reference Gross and Engelder1991) noted that fractures in the northeastern United States, including sections of the Lockport Group, propagated ENE, parallel to the direction of the contemporary horizontal maximum stress axis, as recorded in previous works (Plumb & Cox, Reference Plumb and Cox1987; Adams, Reference Adams1989; Evans et al. Reference Evans, Engelder and Plumb1989; Heidbach et al. Reference Heidbach, Rajabi, Reiter and Ziegler2016). The E–W joint sets identified in this study are oblique to this horizontal maximum stress axis, having average strikes of 281°, 281°, 269° and 096°, for the four data groups (Fig. 8). Gross & Engelder (Reference Gross and Engelder1991) state that ENE-oriented throughgoing fractures cut through the escarpment, whereas the results presented here mostly reveal relatively small-scale stratabound joints that do not correspond in orientation with the inferred regional horizontal maximum stress axis.
5.c.2. Structural inheritance
Gross and Engelder (Reference Gross and Engelder1991) propose that joint orientation in exposed rocks of the Niagara Escarpment was perhaps influenced by pre-existing bedrock joints, paired with the local maximum horizontal stress field, similar to the conclusions of Eyles et al. (Reference Eyles, Arnaud, Scheidegger and Eyles1997). Our statistical analysis of the fractures observed in this study shows that the N–S and E–W fracture sets are not consistent with the fracture orientations recorded by Eyles et al. (Reference Eyles, Arnaud, Scheidegger and Eyles1997). The fracture orientations documented by Eyles et al. (Reference Eyles, Arnaud, Scheidegger and Eyles1997) fall just outside the confidence intervals of the orientation data recorded in this study (Table 1). Eyles et al. (Reference Eyles, Arnaud, Scheidegger and Eyles1997) propose a neotectonic origin for the joints, based on their vertical orientation, shallow depth of formation, and orientation consistent with the current horizontal maximum stress axis, oriented ENE (Gross & Engelder, Reference Gross and Engelder1991). These authors identified local Palaeozoic bedrock joints in southern Ontario oriented 164° and 52–54°, which were noted to correspond with the orientations of ancient bedrock channels and modern rivers respectively, due to structural inheritance. The N–S fracture set (Table 1), with strikes of 183°, 183°, 175° and 179° for the four data groups (Fig. 8), differs by up to 19° from the bedrock joint orientations recorded by Eyles et al. (Reference Eyles, Arnaud, Scheidegger and Eyles1997). Meanwhile, the E–W set does not appear to correlate with any of the bedrock joint orientations recorded by Eyles et al. (Reference Eyles, Arnaud, Scheidegger and Eyles1997). Based on these data, bedrock inheritance is likely not the cause of the joints. However, further research is needed to confirm this.
5.c.3. Stress due to glacial isostatic rebound
Joint formation via post-glacial rebound in North America involves the release of vertical stress by the retreat of the Laurentide Ice Sheet (Quinlan, Reference Quinlan1984; Adams, Reference Adams1989; Steffen et al. Reference Steffen, Eaton and Wu2012) and reorientation of joints, a mechanism described by Dyer (Reference Dyer1988). Dyer (Reference Dyer1988) proposed that propagating fractures may be reorientated to intersect perpendicularly with previously existing fractures, which behave as free surfaces with near-zero shear stress. Vertical stress induced by isostatic uplift following the retreat of the Laurentide Ice Sheet (Carlson et al. Reference Carlson, LeGrande, Oppo, Came, Schmidt, Anslow, Licciardi and Obbink2008), paired with pre-existing bedding planes acting as free surfaces, may provide the most plausible hypothesis for the formation of the sub-vertical joints observed in the present study. In this proposed scenario, fractures would have formed during glacial rebound due to the removal of the vertical stress caused by the overlying Laurentide Ice Sheet. The resulting fractures would have propagated in orientations perpendicular to previously defined bed-parallel discontinuities (Carlson et al. Reference Carlson, LeGrande, Oppo, Came, Schmidt, Anslow, Licciardi and Obbink2008). Local reorientation of fractures in response to these free surfaces would have promoted the propagation of sub-vertical joints that are perpendicular to the beds (Dyer, Reference Dyer1988), as shown by ${\varepsilon _1}$
and
${\varepsilon _1}$
and ${\varepsilon _3}$
of the defined N–S and E–W joint sets (Fig. 8; Vollmer, Reference Vollmer1990). This mechanism can therefore explain the predominantly vertical orientation of joints but not their separation into two distinct strikes, namely N–S and E–W, which are orthogonal to each other (Bai et al. Reference Bai, Maerten, Gross and Aydin2002). However, it is possible that a similar mechanism operated after the formation of one sub-vertical set, promoting orthogonal propagation of the second sub-vertical set, each having formed at different times. Further research is needed to determine if there is an age difference between the two sub-vertical sets, and if this mechanism can explain their orthogonal orientations.
${\varepsilon _3}$
of the defined N–S and E–W joint sets (Fig. 8; Vollmer, Reference Vollmer1990). This mechanism can therefore explain the predominantly vertical orientation of joints but not their separation into two distinct strikes, namely N–S and E–W, which are orthogonal to each other (Bai et al. Reference Bai, Maerten, Gross and Aydin2002). However, it is possible that a similar mechanism operated after the formation of one sub-vertical set, promoting orthogonal propagation of the second sub-vertical set, each having formed at different times. Further research is needed to determine if there is an age difference between the two sub-vertical sets, and if this mechanism can explain their orthogonal orientations.
5.c.4. Freeze–thaw action
Freeze–thaw action involves water infiltrating existing rock discontinuities and applying stress to the rock mass through expansion upon freezing (Moss & Nickling, Reference Moss and Nickling1980). Cycles of freezing and thawing have been shown to contribute to fracture-related erosion in the Niagara Escarpment (Fahey & Lefebure, Reference Fahey and Lefebure1988). Although Fahey and Lefebure (Reference Fahey and Lefebure1988) proposed that this mechanism played a role in fracture formation on a portion of the escarpment north of the current study area, that study focused on different formations and lithologies. Locally, Gage et al. (Reference Gage, Eyles and Lee2021) proposed that site aspect (the orientation of exposed surfaces) has an influence on the effectiveness of freeze–thaw processes, with southeast-facing slopes experiencing more drastic fluctuations in temperature, an important control on freeze–thaw weathering (Fahey & Lefebure, Reference Fahey and Lefebure1988; Gage, et al. Reference Gage, Eyles and Lee2021). Pairing the temperature fluctuations on SE-facing slopes, reported by Gage et al. (Reference Gage, Eyles and Lee2021), with the observations by Gross and Engelder (Reference Gross and Engelder1991), that suggest fracture density increases towards the escarpment face, it is possible that this mechanism facilitates the development of joints at the rock face. However, further research on the characteristics of joints is needed to determine if this mechanism is responsible for the formation of one or both of the sub-vertical joint sets identified in the present study.
5.d. Field data acquisition: area vs scanline methods
Recording data from both area and scanline surveys was initially done to capture the horizontal and vertical variation in fracture attributes at the selected study sites (Watkins et al. Reference Watkins, Bond, Healy and Butler2015). The data and resulting models (Table 1; Fig. 9) were found to be nearly identical for both survey types, showing only minor differences in average joint orientation and aperture values (Fig. 8). The similarity of data collected in each survey type, the redundancy of measuring sub-horizontal bedding planes, and the overall ease of scanline surveys compared to area surveys, suggest that scanline surveys provide a more efficient methodology for the documentation of fracture characteristics in this area, specifically the sub-vertical joint sets.
The selected study sites spanned almost 50 km along the escarpment in Hamilton (Fig. 2), which proved to be valuable, as the variability in site location and aspect allowed identification of two distinct sub-vertical joint sets. Most individual sites (except a curved portion of the Chedoke Radial Trail; Fig. 2) consisted of two-dimensional exposures, revealing only one sub-vertical joint set, striking either N–S or E–W, and only through examination of multiple exposures with different orientations (Fig. 2) could a three-dimensional understanding of joint orientation be gained. Moreover, the consistency of the documented joint orientations, shown by dense clusters of poles on equal-area spherical projections (Fig. 8), indicates that these trends are observed across the study area and that the models produced (Fig. 9) are representative of the study area.
5.e. Limitations of geological fracture modelling workflow
Several limitations of using DFNs to model fracture sets in the Lockport Group became apparent during this study. Most notably, modelling stratabound joints and beds that acted equally as discontinuities was not an inbuilt function within the MOVETM workflow. Facilitating stratabound joints in the DFNs required editing the stochastic nature of the DFNs by manually placing individual sub-vertical joints such that they were situated at the centre of each bed, the boundaries of which were defined by manually placed horizontal bedding planes. In addition, variations in dip angle would not allow all joints to be absolutely bounded by the beds, meaning that each joint set in the DFN was given a dip of 90°. In other words, within the MOVETM workflow it was not possible to both vary the dip and terminate joints at bedding planes. However, the majority of recorded joints are sub-vertical (87 % have dips >75°), and thus, in the context of the field observations, these simplifications are reasonable approximations of a complex real-world system.
Massaro et al. (Reference Massaro, Corradetti, Vinci, Tavani, Iannace, Parente and Mazzoli2018, Reference Massaro, Corradetti, Tramparulo, d’Assisi, Prinzi, Iannace, Parente, Invernizzi, Morsalnejad and Mazzoli2019) present similar DFN models for stratabound fractures in carbonate reservoirs for the purposes of estimating fracture connectivity, fracture-induced porosity and fluid-migration pathways. The results of the current study support their conclusion that fractures have a significant effect on fluid-flow properties such that those of matrix porosity can effectively be ignored due to its low contribution to fluid flow when fractures are present (Massaro et al. Reference Massaro, Corradetti, Vinci, Tavani, Iannace, Parente and Mazzoli2018, Reference Massaro, Corradetti, Tramparulo, d’Assisi, Prinzi, Iannace, Parente, Invernizzi, Morsalnejad and Mazzoli2019).
6. Conclusions
Combined field, statistical and numerical modelling-based data collection and analysis has facilitated quantification of two sub-vertical joint sets and one sub-horizontal set of bedding discontinuities, and their parameters, for a portion of the Niagara Escarpment in and around Hamilton in southern Ontario, Canada. The main conclusions of this work are as follows:
-
(1) The Niagara Escarpment near Hamilton, Ontario, contains three primary fracture sets: (1) sub-horizontal bedding planes, (2) a N–S-striking sub-vertical stratabound joint set, and (3) an E–W-striking sub-vertical stratabound joint set.
-
(2) The presence of the three sets of discontinuities promotes the dislocation of rectangular blocks of rock from the escarpment face, considered a local geohazard.
-
(3) The scanline survey method proved superior to the area survey method for fracture data acquisition due to its ease. However, it remains unknown how universally applicable this is, because of several site-specific parameters at the study locations, including sub-horizontal bedding orientations, and limited outcrop accessibility due to urban features, dense vegetation and steep slopes.
-
(4) DFNs provide a suitable tool for quantifying parameters associated with fracture networks. However, several limitations in their application exist, including failure to consider the fluid-flow properties of the rock matrix and limitations on the stochastic distribution of fractures which required simplification of the distribution of modelled fractures. Despite these limitations, DFNs appear to be a useful tool for assessment and analysis of the bulk fracture and fluid-flow properties of the uppermost units exposed in the Niagara Escarpment. We found that the linking of sub-vertical stratabound joint sets by sub-horizontal bedding planes created continuous migration pathways for meteoritic water and that the amount of fluid flow was proportional to join aperture. Aperture variability and fluid-flow properties are highly variable at sites across the city and may contribute to spatially variable erosion rates.
-
(5) The two sub-vertical joint sets identified in this study are hypothesized to have formed by stress release mechanisms related to isostatic rebound following ice sheet retreat during the early Holocene. In this scenario, bedding planes acted as free surfaces, locally reorienting the stress axes, and promoting the development of sub-vertical joint sets. This hypothesis accounts for the high angle of joint sets, although not for their strike orientations, for which another mechanism must be responsible. However, further research is needed to confirm the validity of this hypothesis.
-
(6) Although further research is needed to determine the origin of fractures in rocks exposed along the Niagara Escarpment, this study effectively quantified and modelled local jointing patterns, developing an understanding of the nature and distribution of fractures and their role in fluid flow and in rockfall events.
Supplementary material
To view supplementary material for this article, please visit https://doi.org/10.1017/S0016756822000462
Acknowledgements
Fieldwork was generously supported by the Keith MacDonald Structural Geology Fund. We also thank field assistant Joseph Hansen and our colleague Dr Jeremy Rimando for offering suggestions and comments throughout the study. We sincerely thank three anonymous journal referees, Dr Anindita Samsu and guest editor Fabrizio Agosta for their time and expertise. Additional thanks are offered to Dr Frederick Vollmer for the creation of the software Orient. Finally, we thank Petroleum Experts Ltd for their kind donation of the MOVETM structural analysis software suite that was used in this study and Dr Alan Vaughan who provided technical support and methodological guidance for the software. Alexander Peace acknowledges Natural Sciences and Engineering Research Council Discovery Grant RGPIN-2021-04011. Carolyn Eyles acknowledges Natural Sciences and Engineering Research Council Discovery Grant RGPIN-2019-06568. John Waldron acknowledges Natural Sciences and Engineering Research Council Discovery Grant RGPIN-2020-04171.
Conflicts of interest
None.


 Open access