


1. Introduction
The Neogene expansion of C4 vegetation represented a major reorganization of the Earth’s terrestrial biome. In many parts of the world, after ∼20 million years, the late Miocene (∼11–5 Ma) witnessed the establishment of grasslands dominated by grass species using the C4 photosynthetic pathway (Edwards et al. Reference Edwards, Osborne, Strömberg and Smith2010; Polissar et al. Reference Polissar, Uno, Phelps, Karp, Freeman and Pensky2021). Distinct carbon isotopic values of C3 and C4 plants are widely used to reconstruct past hydroclimate, where wetter conditions are associated with more abundant C3 plants, and drier conditions by greater C4 coverage (e.g. Kirkels et al. Reference Kirkels, Zwart, Usman, Hou, Ponton, Giosan, Eglinton and Petersen2022 a, b). Using the premise that plant-derived material retains the carbon isotopic signature of its photosynthetic pathway during transfer from plant to sediment, we analysed the isotopic composition of organic carbon (OC) preserved in deep-marine sediments from the Nicobar Fan as a proxy for palaeo-environmental change. We use these carbon isotopes to investigate likely long-term changes in the hydroclimate of the sediment source area for the Middle Miocene-Pleistocene Nicobar Fan, Indian Ocean. In particular, we analysed the finer-grained sediments (mudstones) from the siliciclastic Nicobar Fan as fluvial transport of fine particles generally leads to the enrichment of OC and their effective offshore transport as suspended load (e.g. Bianchi et al. Reference Bianchi, Cui, Blair, Burdige, Eglinton and Galy2018).
Shortly after 10 Ma, a major palaeoclimate transition appears to have led to a synchronous expansion of grasslands on the Indian subcontinent as well as in East Africa and North and South America (e.g. Cerling et al. Reference Cerling, Harris, McFadden, Leakey, Quade, Eisenmann and Ehleringer1997). Evidence for this comes from the C isotopic composition of tooth enamel (Cerling et al. Reference Cerling, Harris, McFadden, Leakey, Quade, Eisenmann and Ehleringer1997), palaeosol carbonate nodules (Quade et al. Reference Quade, Cerling and Bowman1989; Freeman and Colarusso, Reference Freeman and Colarusso2001; Karp et al. Reference Karp, Behrensmeyer and Freeman2018), terrestrial sediments (Vögeli et al. Reference Vögeli, Najman, van der Beek, Huyghe, Wynn, Govin, van der Veen and Sachse2017) and terrigenous marine sediments (Freeman & Colarusso, Reference Freeman and Colarusso2001). All of these record a shift towards higher δ13C values that suggest an expansion of vascular plants utilizing the more complex C4 photosynthetic pathway rather than the C3 pathway of woody plants, marine photosynthesizers and many grasses. Because the C4 pathway produces a lower degree of C isotopic fractionation, the increase in δ13C of both bulk organic matter and terrestrial biomarkers is interpreted to reflect the expansion of C4 plants, most of which are grasses, and are better suited than C3 plants to warmer and more arid conditions. The expansion of C4 plant coverage in the late Miocene is therefore interpreted to be an indication of increasing aridity (e.g. Quade et al. Reference Quade, Cerling and Bowman1989; Cerling et al. Reference Cerling, Harris, McFadden, Leakey, Quade, Eisenmann and Ehleringer1997; Freeman & Colarusso, Reference Freeman and Colarusso2001; Zhisheng et al. Reference Zhisheng, Kutzbach, Prell and Porter2001; An et al. Reference An, Huang, Liu, Guo, Clemens, Li, Prell, Ning, Cai, Zhou, Lin, Zhang, Cao, Qiang, Chang and Wu2005; Scheiter et al. Reference Scheiter, Higgins, Osborne, Bradshaw, Lunt, Ripley, Taylor and Beerling2012; Karp et al. Reference Karp, Behrensmeyer and Freeman2018; Khim et al. Reference Khim, Lee, Ha, Park, Pandey, Clift, Kulhanek, Steinke, Griffith, Suzuki and Xu2020; Morley, Reference Morley2018), but it should also be noted that because the C4 pathway involves a CO2 preconcentration mechanism, low atmospheric pCO2/pO2 will additionally favour C4 grassland expansion (Cerling et al. Reference Cerling, Harris, McFadden, Leakey, Quade, Eisenmann and Ehleringer1997). In a study of past vegetation patterns in the Indian Siwaliks (middle and lower Gangetic Plain), Basu et al. (Reference Basu, Agrawal, Sanyal, Mahato, Kumar and Sarkar2015) concluded that the early appearance of C4 plants occurred at ∼11 Ma. Also, from an analysis of the δ13C values of bulk soil organic matter, n-alkane and n-alkanoic acid in the palaeosols from Late Mio-Pleistocene Siwaliks, Roy et al. (Reference Roy, Ghosh and Sanyal2020) identified two phases of vegetation change between at ∼7 Ma and at ∼3 Ma – an expansion of C4 plants during 7–3 Ma and a higher abundance of C3 plants after 3 Ma. They invoked a morpho-tectonic control for these changes in vegetation.
The late Miocene expansion of C4 vegetation has been considered as globally synchronous, but site-specific studies reveal differences in the timing of this expansion and suggest that local conditions played an important role (e.g. Dunlea et al. Reference Dunlea, Giosan and Huang2020; Tauxe & Feakins, Reference Tauxe and Feakins2020). Data from marine sediments, since ∼6 Ma in the Bay of Bengal at IODP Site U1445, led Dunlea et al. (Reference Dunlea, Giosan and Huang2020) to propose that C4 vegetation on the Indian Peninsula existed before the end of the Miocene but expanded to substantially greater abundance during the mid-Pliocene to mid-Pleistocene (∼3.5–1.5 Ma). In this paper, we also identify the ∼3.5–1.5 Ma expansion (see below). Tauxe and Feakins (Reference Tauxe and Feakins2020) re-evaluated the constraints for the carbon isotopic shifts recorded from the Indian subcontinent and demonstrated a diachronous transition ranging in age from ∼7.8 Ma in Pakistan to as late as ∼6 Ma in Nepal. The record from IODP Expedition 355 Site U1457, drilled on the Indus Fan, shows that the transition in peninsular India began at ∼7.2 Ma, with similar records from the African margin witnessing an earlier shift to C4 dominance starting at ∼10 Ma, with those from Australia and South America during the Pliocene. They argued that diachroneity in vegetation changes around the globe does not invalidate pCO2 as a driver but is consistent with it being one of several drivers of the global C4 expansion.
The Indian subcontinent has received particular attention regarding the C3–C4 transition in part because of the potential relationship between vegetation and monsoon intensity. The strength of monsoon winds is a fundamental control on aridity on the Indian subcontinent where southwesterly winds in summer bring moisture-laden air from the Arabian Sea and northern Indian Ocean inland. Humid air masses deflected upwards by the Himalaya cause extreme precipitation compared to the dry winters in which northeasterly winds provide little moisture. The separate East Asian monsoon system, while not as pronounced, leads to similar intra-annual precipitation patterns in Central and East Asia. Even if intensification of either monsoon system does not lead to an overall increase in annual precipitation, an increase in summer precipitation, particularly with the trade-off of greater winter aridity, will tend to favour C4 grasses (An et al. Reference An, Huang, Liu, Guo, Clemens, Li, Prell, Ning, Cai, Zhou, Lin, Zhang, Cao, Qiang, Chang and Wu2005), which are better suited to warm and dry conditions due to their ability to limit water loss during stomatal gas exchange. The intensity of monsoonal winds has also been inferred from marine productivity, which strengthens upwelling off the Arabian Peninsula during the summer monsoon (Kroon et al. Reference Kroon, Steens and Troelstra1991; Prell & Kutzbach. Reference Prell and Kutzbach1992), and dust flux proxies (Rea et al. Reference Rea, Snoeckx, Joseph and Arbor1998; Wan et al. Reference Wan, Li, Clift and Stuut2007).
Terrestrial records of monsoon intensity tend to reflect local conditions, which means they may not be representative of continental-scale ecological shifts (Freeman & Colarusso, Reference Freeman and Colarusso2001; Vögeli et al. Reference Vögeli, Najman, van der Beek, Huyghe, Wynn, Govin, van der Veen and Sachse2017). Much of the evidence for grassland expansion has come from the Siwalik palaeosols in northern Pakistan and India (Fig. 1), and despite efforts to sample throughout the spatial extent of this unit (e.g. Freeman & Colarusso, Reference Freeman and Colarusso2001; Vögeli et al. Reference Vögeli, Najman, van der Beek, Huyghe, Wynn, Govin, van der Veen and Sachse2017), extrapolating regional results from a single geologic unit can introduce substantial uncertainty. Other efforts to understand long-term climate evolution on the Indian subcontinent have focused on the elemental and isotopic composition of organic matter in terrigenous sediments of the Indus and Bengal Fans (Freeman & Colarusso, Reference Freeman and Colarusso2001; Krishna et al. Reference Krishna, Naidu, Subbaiah, Sarma and Reddy2013; Karp et al. Reference Karp, Behrensmeyer and Freeman2018; Khim et al. Reference Khim, Lee, Ha, Park, Pandey, Clift, Kulhanek, Steinke, Griffith, Suzuki and Xu2020), which integrate ecological signals over entire river catchments, and can therefore better capture large-scale environmental changes with less interference from spatial heterogeneity. Clift et al. (Reference Clift, Hodges, Heslop, Hannigan, van Long and Calves2008) used weathering records from the South China Sea, Bay of Bengal and Arabian Sea to propose that over the past 23 million years, there has been a dynamic coupling between Neogene climate and both erosion and deformation in the Himalaya, that is, a strong tectonic control.

Figure 1. Overview map showing the location of IODP Site U1480 on the Nicobar Fan and sites where other related studies have been conducted. The Ganges and Brahmaputra rivers provide most of the terrigenous sediment to the Nicobar and Bengal Fans (the approximate position of the river system near the Bay of Bengal is denoted as the delta is complex). Palaeosols of the Siwalik group are the most studied terrestrial deposits that provide evidence for the C3–C4 shift, though no shift appears to have occurred at the eastern extent of the group, and it captures conditions at the foot of the Himalaya, not farther into the lowlands where C4 grasses may be expected to first appear (Freeman & Colarusso, Reference Freeman and Colarusso2001).
2. Sediment sources
The Bengal–Nicobar Fan system (Figs. 1, 2), which is uniquely suited to address climate evolution in South Asia because of the largely continuous record of terrigenous sediment flux to the deep sea since 10 Ma and the extremely high sediment accumulation rates (McNeill et al. Reference McNeill, Dugan, Backman, Pickering, Pouderoux, Henstock, Petronotis, Carter, Chemale, Milliken, Kutterolf, Mukoyoshi, Chen, Kachovich, Mitchison, Bourlange, Colson, Frederik, Guèrin, Hamahashi, House, Hüpers, Jeppson, Kenigsberg, Kuranaga, Nair, Owari, Shan, Song, Torres, Vannucchi, Vrolijk, Yang, Zhao and Thomas2017 a, b; Pickering et al. Reference Pickering, Pouderoux, McNeill, Backman, Chemale, Kutterolf, Milliken, Mukoyoshi, Henstock, Stevens, Parnell and Dugan2019, Reference Pickering, Carter, Andò, Garzanti, Limonta, Vezzoli and Milliken2020), also observed in the Bengal Fan (Lee et al. Reference Lee, Galy, Feng, Ponton, Galy, France-Lanord and Feakins2019). Submarine fan deposits at IODP Site U1480 are largely the result of various types of sediment gravity flows (SGFs) of Himalaya-sourced material transported via the Ganges/Brahmaputra river system (Pickering et al. Reference Pickering, Pouderoux, McNeill, Backman, Chemale, Kutterolf, Milliken, Mukoyoshi, Henstock, Stevens, Parnell and Dugan2019, Reference Pickering, Carter, Andò, Garzanti, Limonta, Vezzoli and Milliken2020; Chen et al. Reference Chen, Yan, Clift, Carter, Huang, Pickering, Chemale, Shan and Zhang2020) and therefore incorporate terrigenous organic matter from the combined catchment area. Petrographic data, including geochemical analyses, all support a single and sustained major sediment provenance to the north from the Himalaya and surrounding areas for the entire time interval cored in the Nicobar Fan (McNeill, Dugan, Petronotis, and the Expedition 362 Scientists, Reference McNeill, Dugan and Petronotis2017b; McNeill et al. Reference McNeill, Dugan, Backman, Pickering, Pouderoux, Henstock, Petronotis, Carter, Chemale, Milliken, Kutterolf, Mukoyoshi, Chen, Kachovich, Mitchison, Bourlange, Colson, Frederik, Guèrin, Hamahashi, House, Hüpers, Jeppson, Kenigsberg, Kuranaga, Nair, Owari, Shan, Song, Torres, Vannucchi, Vrolijk, Yang, Zhao and Thomas2017a; also see section on provenance in Pickering et al. Reference Pickering, Pouderoux, McNeill, Backman, Chemale, Kutterolf, Milliken, Mukoyoshi, Henstock, Stevens, Parnell and Dugan2019). Arc-derived ash content in sediments at IODP Sites U1480-U1481 suggests that the Sunda forearc contributed only a very minor component. Geochemical and Sr-Nd isotope analyses on the bulk silicate fraction of the Nicobar Fan muds/mudstones indicate an eastern Himalayan source dominated by the Greater Himalaya, with a significant Gangdese arc contribution (a major geological structure in the southern Tibetan Lhasa terrane to the north of the Himalayas), all primarily carried by the palaeo-Brahmaputra river. Thus, we are confident that the mudstones sampled for this study are part of this terrigenous sediment flux from the Himalaya, and not from a separate source area to the east, such as the Irrawaddy drainage system.

Figure 2. Palaeogeographic reconstructions of the Bengal–Nicobar Fan System for the time interval 0–10 Ma, modified from Pickering et al. (Reference Pickering, Pouderoux, McNeill, Backman, Chemale, Kutterolf, Milliken, Mukoyoshi, Henstock, Stevens, Parnell and Dugan2019). Tectonic reconstruction used is from Hall (Reference Hall2012). Bengal Fan morphology from Curray (Reference Curray2014). Location of core data from DSDP/ODP/IODP sites (white dots; red dots = IODP Expedition 362 sites). Sediment mass accumulation rates (MARs) were calculated for IODP sites U1451 (green dot), U1453 (purple dot) and U1480-U1481 (red dots): the white dots are other drill DSDP/ODP/IODP sites. The postulated earliest submarine-fan deposits are shown as routing along the eastern side of the Indian Ocean, as axial sediment gravity flows along the Sunda subduction zone trench until it was overfilled to construct the Bengal Fan. The latest Eocene and early Oligocene Andaman Flysch, now as accreted and uplifted sedimentary rocks forming part of the Andaman Islands, is the oldest interpreted trench deposits (∼30 Ma). Also, note the much increased coarser-grained terrigenous sediment supply to the Bengal Fan between 13.5 Ma and 8.5 Ma (but beginning at ∼27 Ma), switching to the Nicobar Fan after ∼9.5–9.0 Ma and then back to the Bengal Fan after ∼2 Ma.
The Bengal–Nicobar Fan system contains large amounts of woody material. Rapid export and burial of woody material is a highly efficient pathway of atmospheric CO2 sequestration (Lee et al. Reference Lee, Galy, Feng, Ponton, Galy, France-Lanord and Feakins2019). Large-magnitude, low-frequency rapid wood transport avoids degradation that can occur in soils, where extensive OC degradation limits the efficiency of OC burial at very high erosion rates (ibid.).
Palaeogeographic reconstructions of the Bengal–Nicobar Fan System, using the plate-tectonic reconstructions of Hall (Reference Hall2012), with the Bengal Fan morphology from Curray (Reference Curray2014), combined with core data from DSDP/ODP/IODP sites in the Indian Ocean (Fig. 2 modified from Pickering et al. Reference Pickering, Pouderoux, McNeill, Backman, Chemale, Kutterolf, Milliken, Mukoyoshi, Henstock, Stevens, Parnell and Dugan2019), suggest that the earliest submarine-fan deposits likely were routed along the eastern side of the Indian Ocean, as axial SGFs along the Sunda subduction zone trench that would have been a linear topographic low until it was overfilled to construct the Bengal–Nicobar Fan System. For a comprehensive explanation of SGFs, see Pickering and Hiscott (Reference Pickering and Hiscott2016). The latest Eocene and early Oligocene Andaman Flysch, now as accreted and uplifted sedimentary rocks forming part of the Andaman Islands, represents the oldest trench deposits (Pickering et al. Reference Pickering, Pouderoux, McNeill, Backman, Chemale, Kutterolf, Milliken, Mukoyoshi, Henstock, Stevens, Parnell and Dugan2019, Figure 14). There was a substantially increased delivery of coarser-grained terrigenous sediment to the Bengal–Nicobar Fan System between 13.5 and 8.5 Ma (but beginning at ∼27 Ma), switching to the Nicobar Fan after ∼9.5–9.0 Ma, and then back to the Bengal Fan after ∼2 Ma (Pickering et al. Reference Pickering, Carter, Andò, Garzanti, Limonta, Vezzoli and Milliken2020, Figure 14). High elevation in the evolving Tibetan Plateau (>4 km), starting at ∼55–45 Ma, appears to have been established by ∼20 Ma (Ding et al. Reference Ding, Kapp, Cai, Garzione, Xiong, Wang and Wang2022) and, therefore, this was likely an important sediment source to the Nicobar Fan before the time interval considered in this paper.
Although IODP Site U1480 is ∼2,000 km from the sediment source in the Bay of Bengal, sediment accumulation rates were commonly higher than at IODP sites on the distal Bengal Fan (Fig. 1). Additionally, the IODP Site U1480 record more fully captures the depositional history since ∼10 Ma with fewer hiatuses, intervals of bit advancement without coring and better age constraints than many of the Bengal and Indus Fan sites (IODP sites U1450, U1451, U1455 and U1457; Expedition 354 Scientists, 2016 a, b, c; Khim et al. Reference Khim, Lee, Ha, Park, Pandey, Clift, Kulhanek, Steinke, Griffith, Suzuki and Xu2020). Site U1480, therefore, represents a unique opportunity to capture a largely continuous record of ecologic and palaeoclimate conditions during the past ∼10 Ma on the Indian subcontinent.
Our datasets give a unique view of the timing and pace of the C3–C4 transition. While previous studies relied primarily on compound-specific isotope analyses of terrestrial plant biomarkers (e.g. Freeman & Colarusso, Reference Freeman and Colarusso2001), we instead used simple analytical techniques to generate a much larger dataset capable of revealing more subtle temporal trends and reduce the reliance on single measurements. Because the incorporation of organic matter from the marine ecosystem can mimic a shift towards terrestrial C4 plant cover (e.g. Galy et al. Reference Galy, François, France-Lanord, Faure, Kudrass, Palhol and Singh2008), we employed a multi-proxy approach that used mixing models based on δ13C, TOC/TN and Br/TOC ratios to correct for contributions from marine organic matter. Uncertainty in end-member composition can dramatically limit the utility of mixing models, so we used Monte Carlo simulations using randomly perturbed end-member compositions to place reasonable quantitative bounds on the contributions of C4 plants to the terrigenous organic matter through time.
3. Methods
3.a. Analytical procedures
The sample set consists of the residues from shipboard carbonate/TOC analyses and additional dedicated samples that were vacuum sealed and kept frozen. These samples came from the muds/mudstones in the Nicobar Fan sediments (Units I–IIIA in IODP Site U1480 (0–1,310.02 mbsf) and are representative of the siliciclastic sediments in the Nicobar Fan). An analysis of siliciclastic sediments from the Indus Fan (Arabian Sea) has already established that hemipelagic mudstones (rather than sands deposited from various SGFs, such as turbidity currents) provide the most suitable material for evaluating any changes in C4 grasses (Feakins et al. Reference Feakins, Liddy, Tauxe, Galy, Feng, Tierney, Miao and Warny2020). The carbonate residues were freeze-dried for 12 hours, while additional dedicated samples were dried at 50oC until consecutive weighing indicated no further mass loss. All samples were ground in an agate mortar and pestle. Approximately 10 mg of sediment was weighed into Ag capsules and decarbonated for TOC and δ13C analyses using aqueous SO2 (∼6–8% by mass). Following dropwise addition of SO2 solution, the samples were heated to 60oC until dry, at which point additional SO2 solution was added. We continued this procedure until a total of ∼1.5 mL had been added, representing at least a 100-fold stoichiometric excess of SO2/CaCO3. Pre-combusted glass pipettes and polypropylene 96-well plates were used to minimize any possibility of contamination with organic matter during decarbonation. The Ag capsules containing the decarbonated sediment samples were sealed in Sn capsules to aid in final conversion of organic C to CO2 in the elemental analyser combustion column. Separate sample aliquots of ∼40 mg were not subjected to decarbonation and were sealed in Sn capsules for TN analyses.
Prior results (Kennedy et al. Reference Kennedy, Kennedy and Papadimitriou2005) suggested that aqueous SO2 incompletely decarbonates samples for TOC analysis, but the amount of SO2 solution added provided a less than stoichiometric ratio of SO2/CaCO3, so decarbonation should not proceed to completion. Because our samples were likely to contain trace detrital dolomite ((Ca,Mg)CO3), which is resistant to decarbonation, and would artificially raise δ13CTOC measurements, we tested the decarbonation procedure on a powdered dolomite sample from the Scripps Institution of Oceanography collections. The C content of the untreated dolomite implies an Mg concentration of ∼33%, and decarbonation of ∼1 mg, far in excess of the amount in our samples, resulted in C concentrations below the analytical detection limit of <10 ug C. We are therefore confident that the decarbonation procedure we used quantitatively removes even unrealistically large amounts of (Ca,Mg)CO3 and is suitable for analysing TOC and δ13CTOC. Decarbonation with aqueous SO2 has the added benefit of producing Ca/Mg salts that are not hygroscopic, obviating the need for the rigorous drying procedures required after decarbonation by HCl fumigation.
Analyses of TOC, δ13C of TOC (δ13CTOC) and TN were conducted at the University of California Santa Cruz Stable Isotope Laboratory. Carbon and nitrogen isotopic and elemental composition were determined by Dumas combustion using a Carlo Erba 1108 elemental analyser coupled to a ThermoFinnigan Delta Plus XP isotope ratio mass spectrometer. Analytical precision of internationally calibrated in-house standards is better than 0.2 ‰ for δ13C, which means the δ13C error bars in Figs. 3–5 would be smaller than the data points. Sample isotopic values are corrected for size, drift and source stretching effects. Carbon and nitrogen elemental composition is calculated based on standards of known elemental composition. Precision of these known compounds is determined to be better than 1%, again indicating error bars smaller than data points in Fig. 3. All δ13C values are reported relative to the Vienna Pee Dee Belemnite (VPDB) C isotope standard.
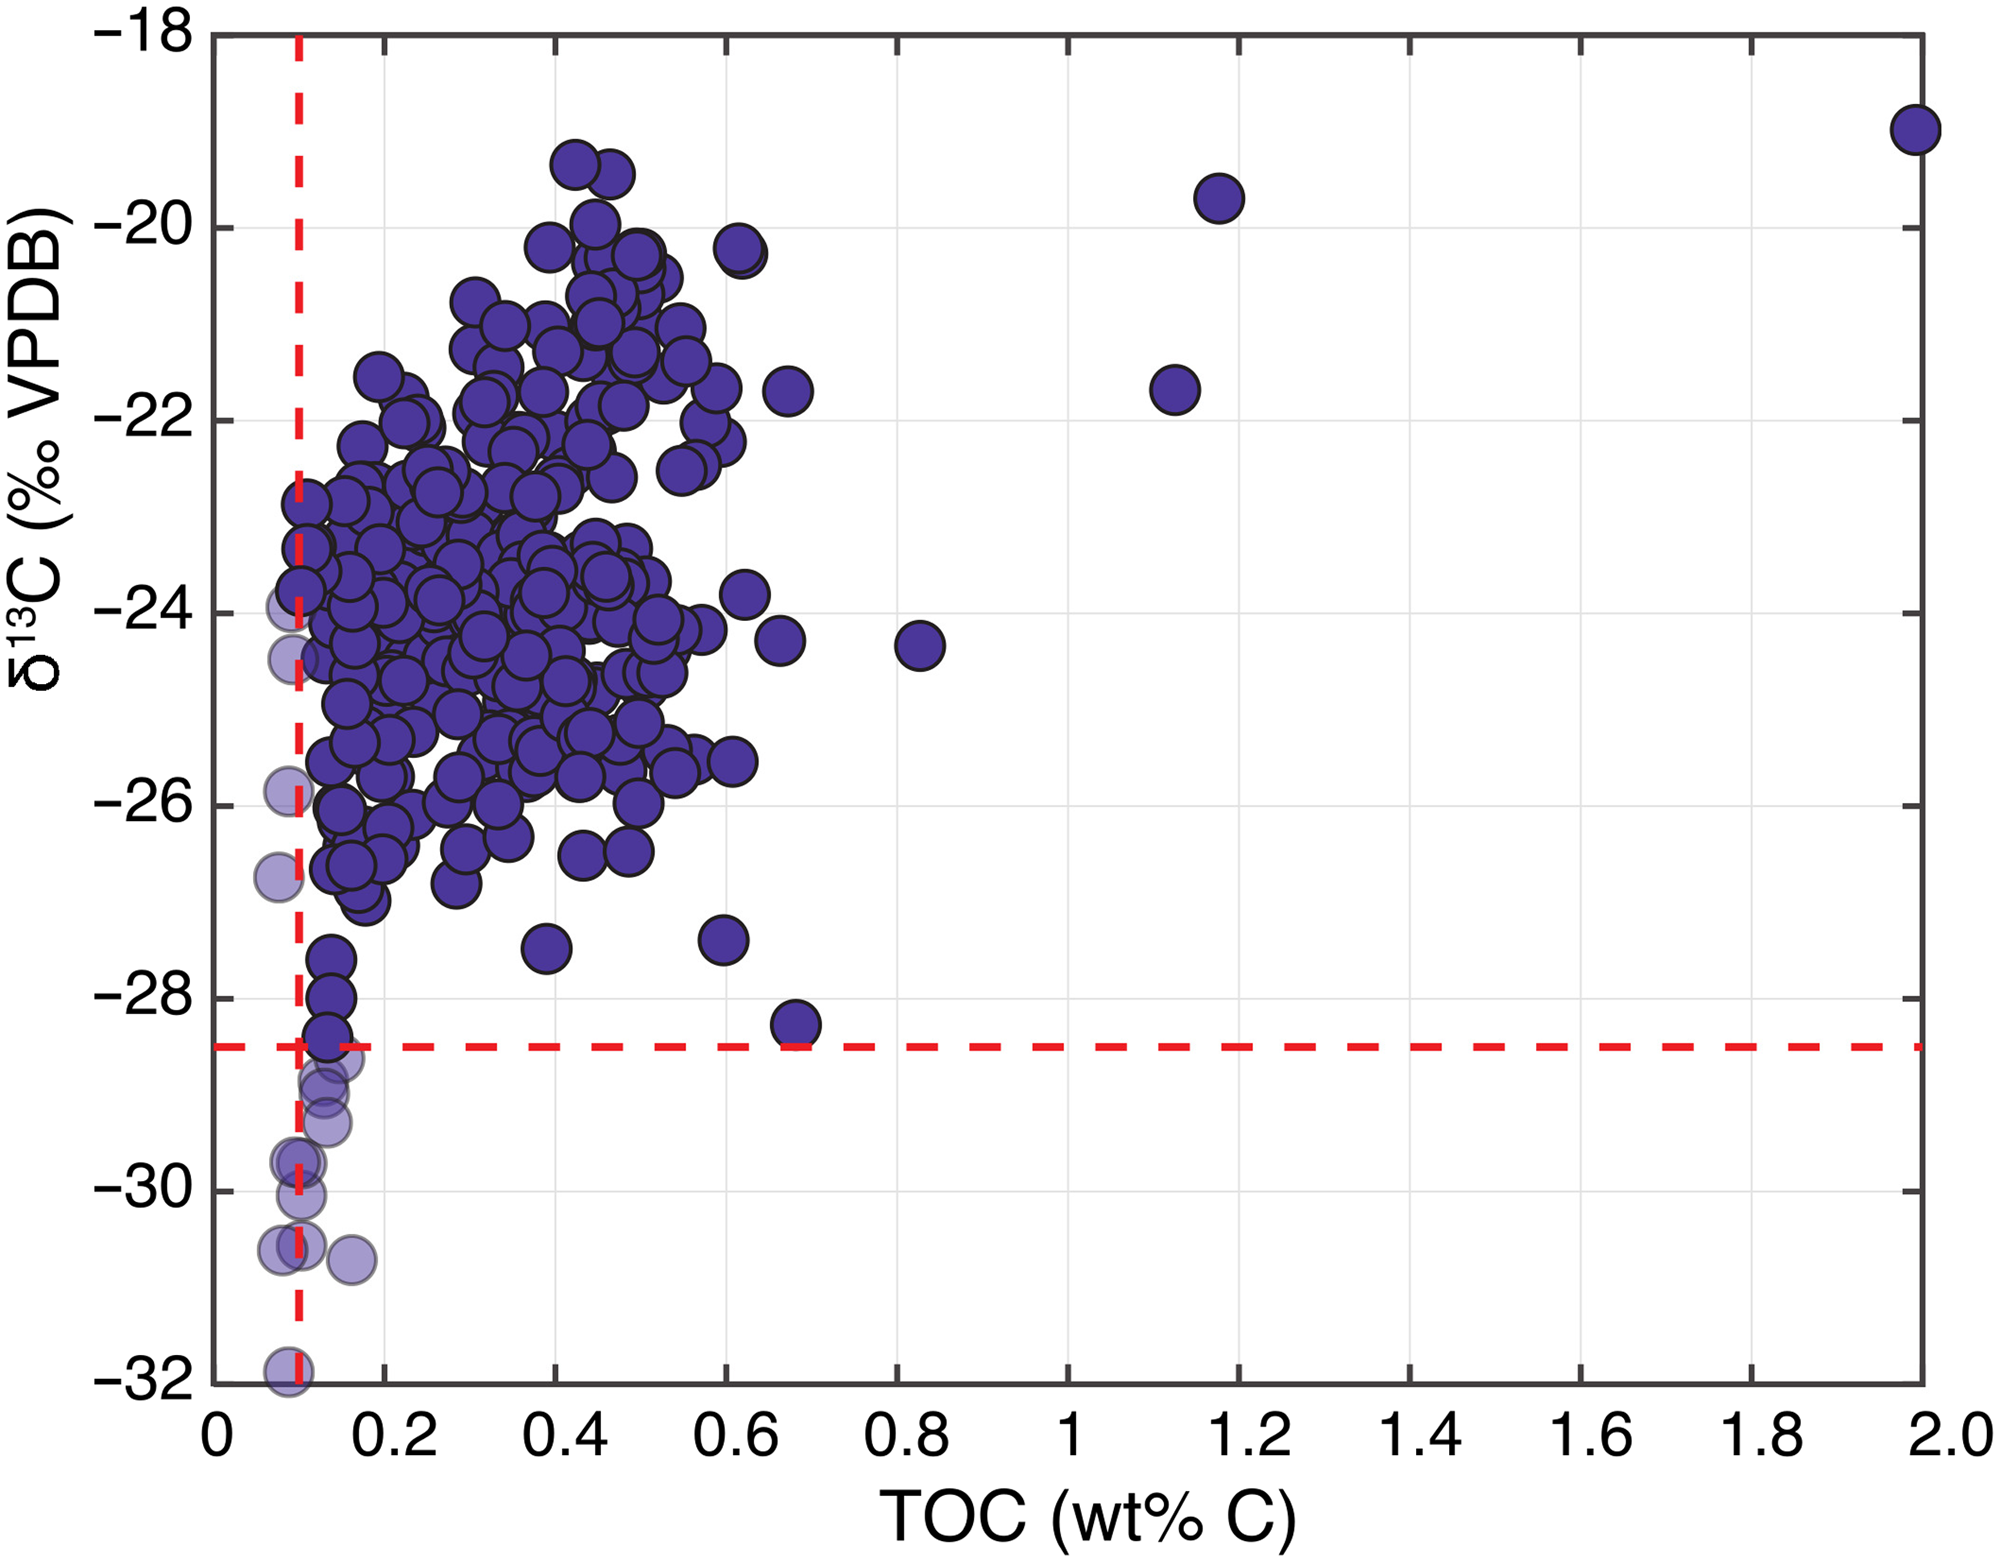
Figure 3. Measured δ13CTOC as a function of TOC in IODP Site U1480 sediments shows a substantial decrease in δ13CTOC in samples with low TOC. The positions of the red lines indicate the cut-offs used to filter data (Section 4.1); points to the left and below these lines were not used for further analyses.
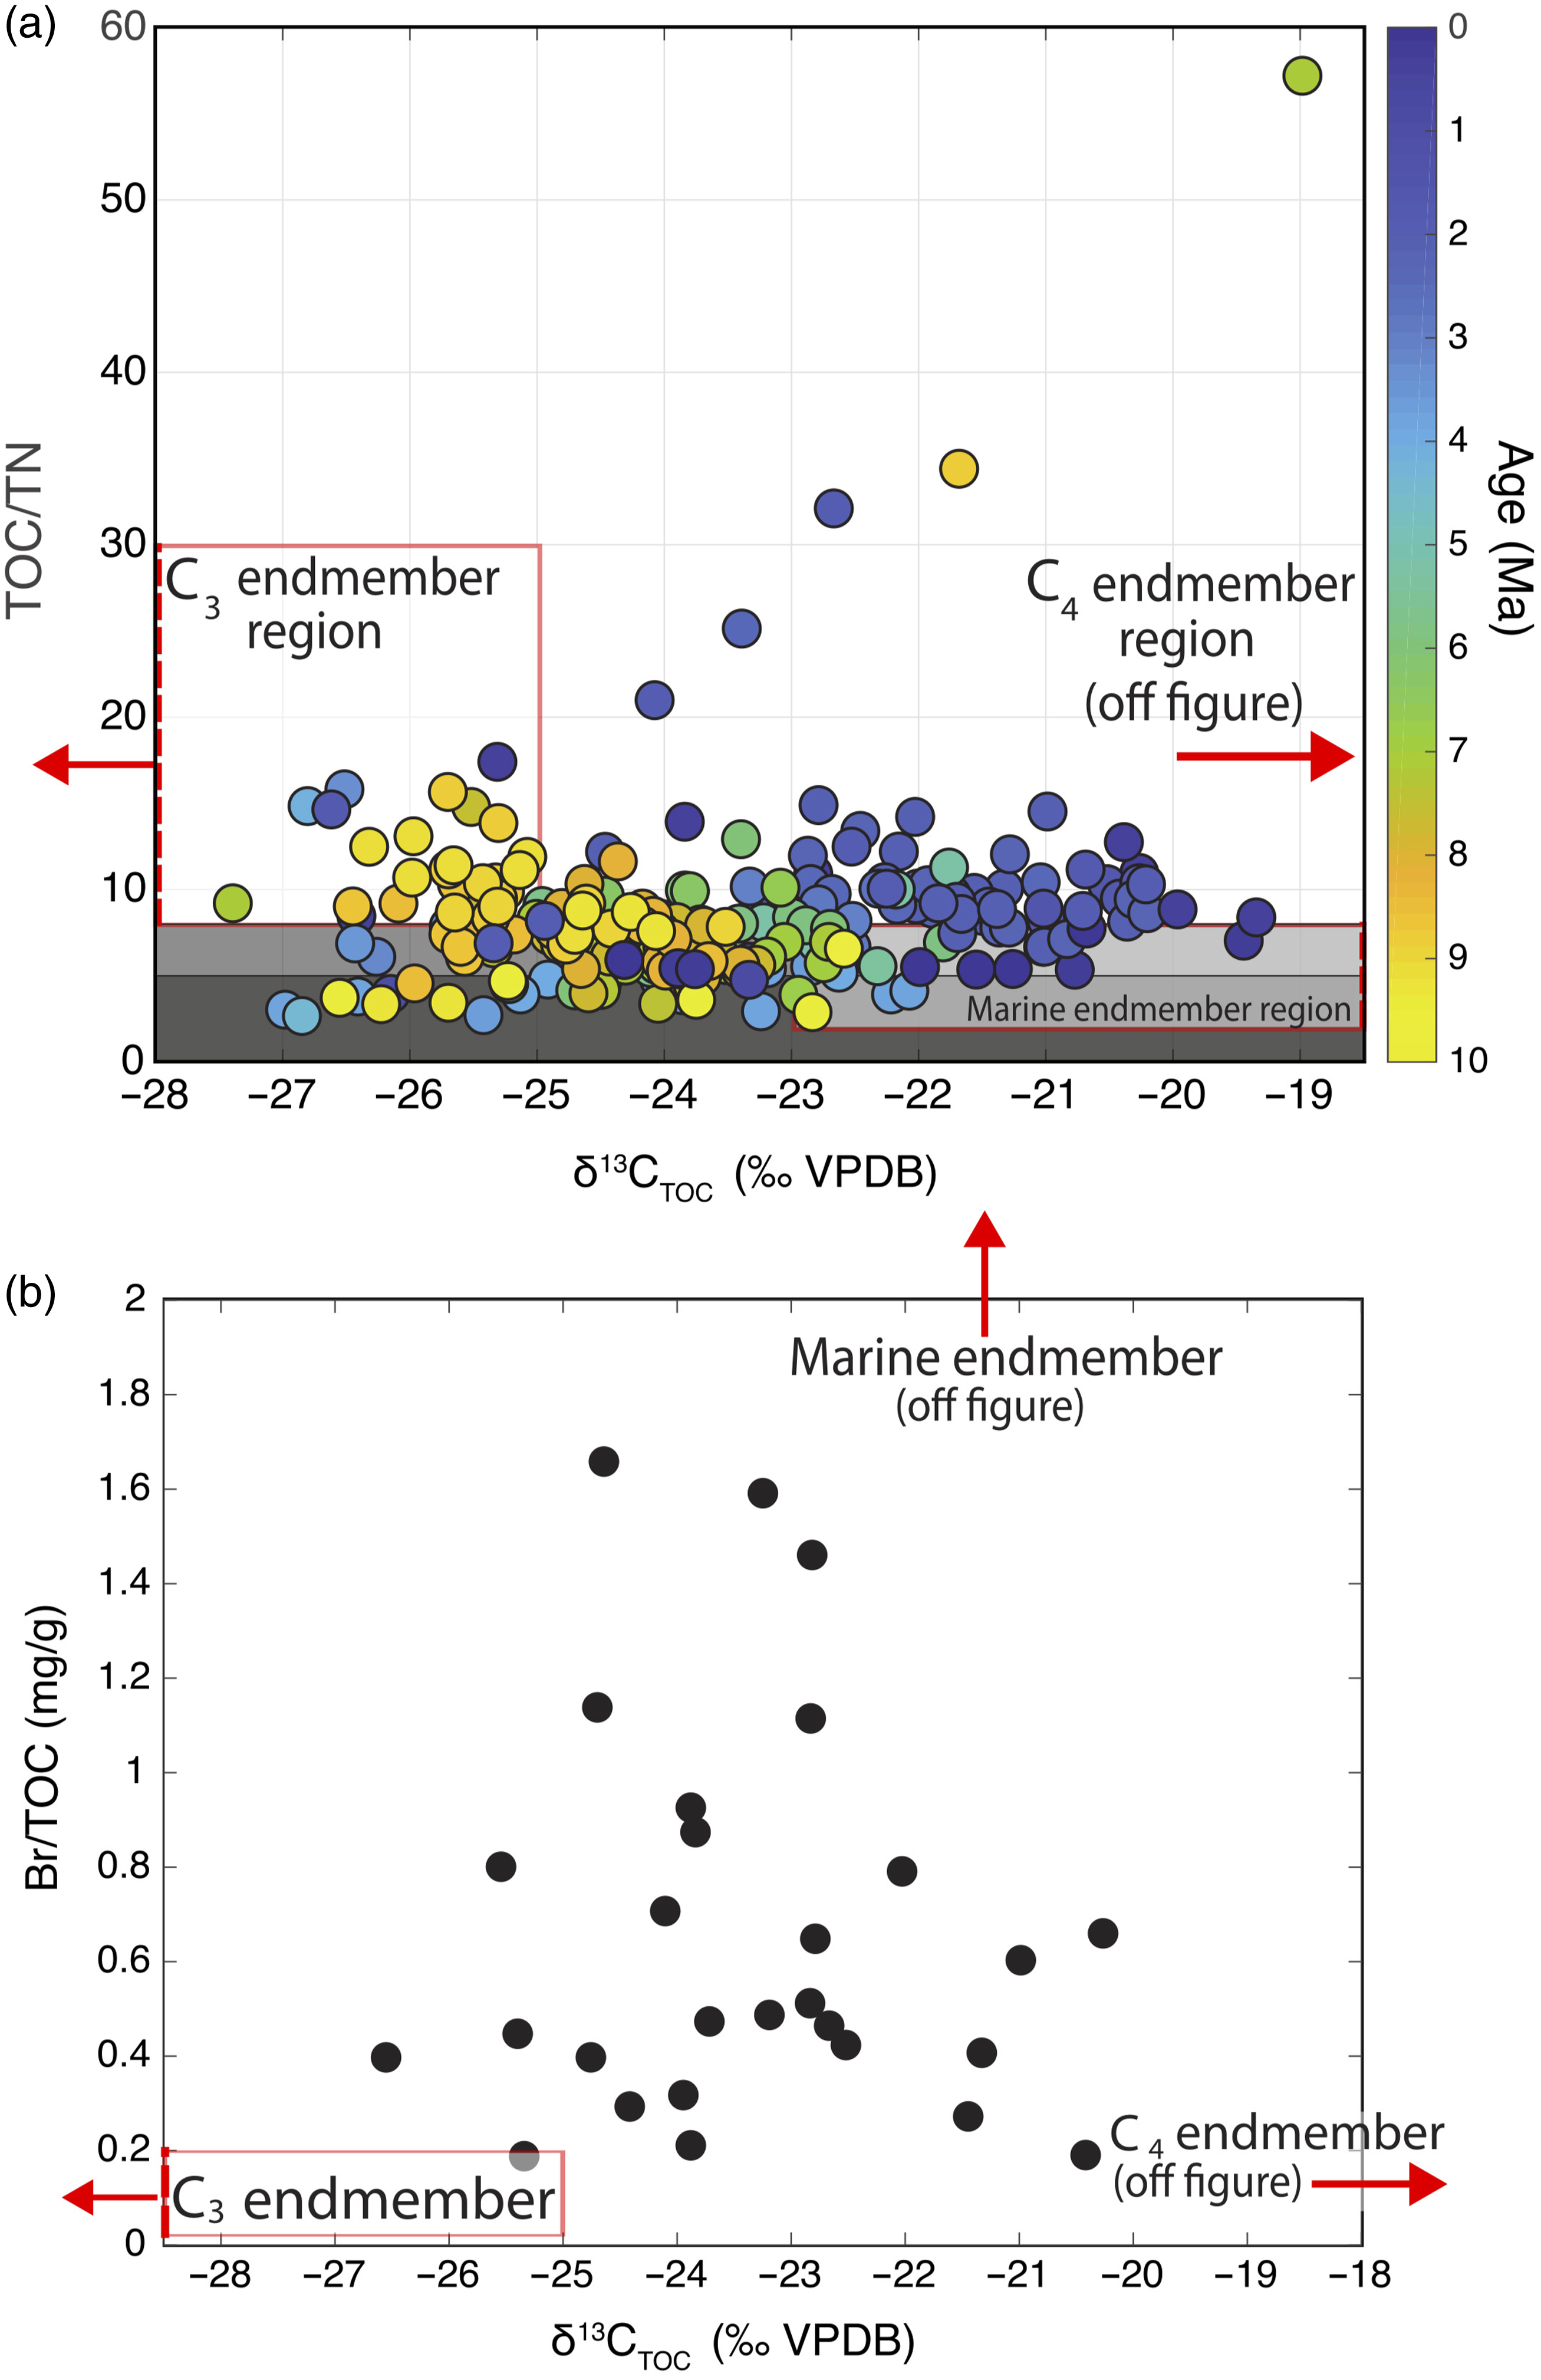
Figure 4. δ13CTOC and TOC/TN data (a) can be largely explained by a mixing model between organic matter from vascular C3 plants with high TOC/TN and low δ13C, C4 plants with high TOC/TN and high δ13C, and marine organic matter with low TOC/TN and intermediate δ13C. Shaded regions indicate the approximate TOC/TN range of <5–8 for marine organic matter and >8 for both C3 and C4 terrestrial organic matter. The δ13CTOC and Br/TOC data (b) are consistent with the three end-member mixing models introduced by Mayer et al. (Reference Mayer, Schick, Allison, Ruttenberg and Bentley2007) in which terrigenous organic matter is characterized by much lower Br/TOC ratios than marine organic matter. Note that many end-member regions exist or extend off margin of figure as indicated by red arrows. See Table 1 to appreciate the end-member regions.
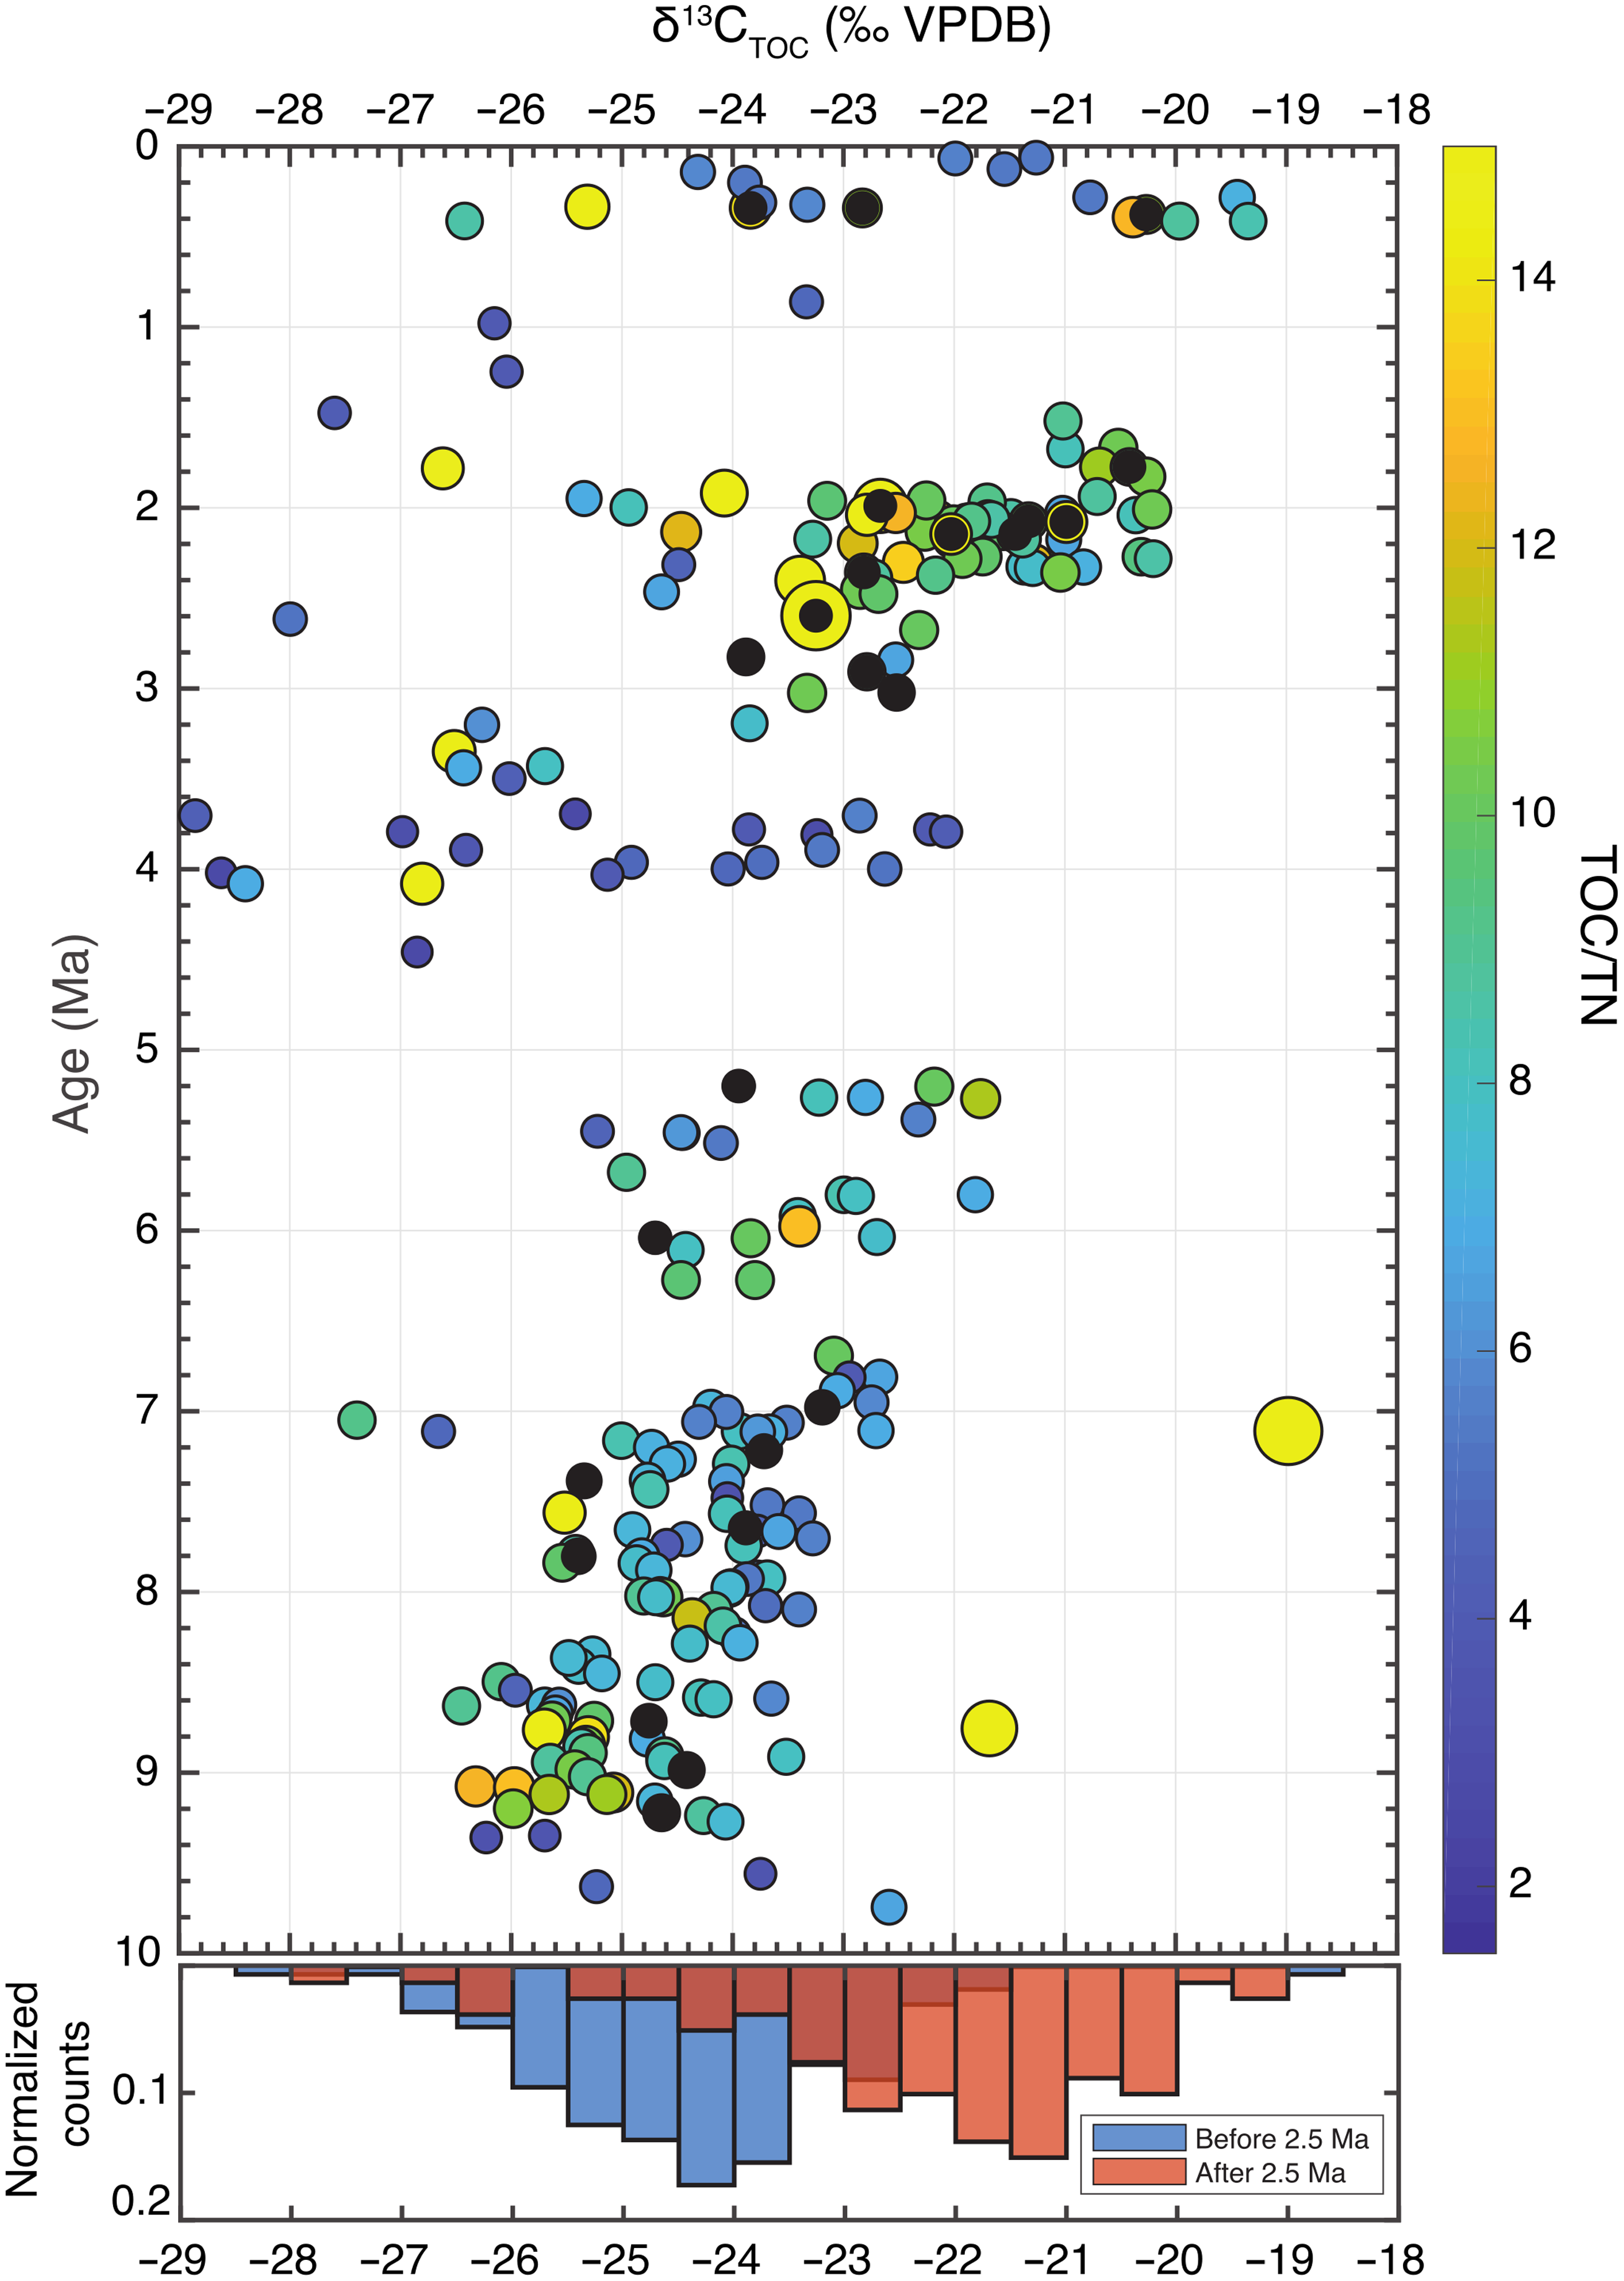
Figure 5. IODP Site U1480 δ13CTOC record for the past 10 Ma data with data points sized and coloured to reflect TOC/TN ratios, and black points indicating the subset of samples chosen for trace element analysis to establish Br/TOC. Higher (less negative) δ13C values (permille, VPDB) imply greater contributions of terrestrial C4 or marine organic matter. The marginal histogram shows the difference in frequency of δ13CTOC before and after ∼2.5 Ma.
Major and trace element analyses were conducted on sample aliquots that were washed three times with DI water and centrifuged between washings to ensure seawater-derived bromide would not interfere with sediment Br measurements. The sample aliquots were analysed by Instrumental Neutron Activation Analysis (INAA) at the Oregon State University Radiation Center. Precision is estimated at ∼0.7 ppm at the 2σ level for Br, and we also used this value as the detection limit.
3.b. Data treatment
Data were first filtered to address the tendency for samples with low TOC to give low δ13C values (Fig. 3). We established a cut-off of 0.125 wt% C and an overall δ13C threshold of −28.5 to discard unreliable data while still retaining as many as possible. For Br analyses, we discarded data points for samples with over 400 ppm Cl, which may indicate incomplete removal of seawater Br based on co-variation between Br and Cl for samples with high Cl content. Furthermore, data for which Br concentrations were less than two standard deviations from the detection limit of 0.7 ppm were also discarded. These procedures led to 302 measurements of TOC, δ13CTOC and TN as well as 28 measurements of Br (and other major/trace elements) that we deemed to be reliable (Tables S1; S2). Only these data were used in further analyses.
We used two separate three end-member mixing models to correct the δ13CTOC values for the influence of marine organic matter and place quantitative bounds on the fraction of organic matter from C4 plants. Both consisted of a system of linear equations of the form $Af = b$
where
$Af = b$
where
 $$A = \left[ {\matrix{ {c_{C4}^1} \hfill & {c_{C3}^1} \hfill & {c_M^1} \hfill \cr {c_{C4}^2} \hfill & {c_{C3}^2} \hfill & {c_M^2} \hfill \cr 1 \hfill & 1 \hfill & 1 \hfill \cr } } \right]$$
with
$$A = \left[ {\matrix{ {c_{C4}^1} \hfill & {c_{C3}^1} \hfill & {c_M^1} \hfill \cr {c_{C4}^2} \hfill & {c_{C3}^2} \hfill & {c_M^2} \hfill \cr 1 \hfill & 1 \hfill & 1 \hfill \cr } } \right]$$
with $c_j^i$
equal to the composition of end-member j with respect to the elemental/isotopic system i,
$c_j^i$
equal to the composition of end-member j with respect to the elemental/isotopic system i, $f = \;\left[ {\matrix{ {{f_{C4}}} \cr {{f_{C3}}} \cr {{f_M}} \cr } } \right]$
with the fractional contribution
$f = \;\left[ {\matrix{ {{f_{C4}}} \cr {{f_{C3}}} \cr {{f_M}} \cr } } \right]$
with the fractional contribution ${f_j}$
from end-member j and
${f_j}$
from end-member j and $b = \left[ {\matrix{ {d_1^1\;d_2^1 \;\ldots } \cr {d_1^2\;d_2^2 \;\ldots } \cr {\hskip 2pt1\hskip 8pt1 \hskip 5pt\ldots } \cr } } \right]$
with data
$b = \left[ {\matrix{ {d_1^1\;d_2^1 \;\ldots } \cr {d_1^2\;d_2^2 \;\ldots } \cr {\hskip 2pt1\hskip 8pt1 \hskip 5pt\ldots } \cr } } \right]$
with data $d_k^i$
for the measured value of data point k with respect to the elemental/isotopic system i. A total of 105 Monte Carlo simulations were run in which end-member compositions were allowed to vary randomly within distributions centred on literature values (e.g. Galy et al. Reference Galy, François, France-Lanord, Faure, Kudrass, Palhol and Singh2008) and/or extreme measured values and with standard deviations encompassing a range of reasonable values (Table 1). The distributions of
$d_k^i$
for the measured value of data point k with respect to the elemental/isotopic system i. A total of 105 Monte Carlo simulations were run in which end-member compositions were allowed to vary randomly within distributions centred on literature values (e.g. Galy et al. Reference Galy, François, France-Lanord, Faure, Kudrass, Palhol and Singh2008) and/or extreme measured values and with standard deviations encompassing a range of reasonable values (Table 1). The distributions of ${{{f_{C4}}} \over {{f_{C4}} + {f_{C3}}}}$
(the fraction of terrigenous organic matter from C4 plants) are represented in Fig. 6, and we generated smoothed curves fitting the data based on the distributions produced by bootstrap resampling of the data and the smoothed values at ages corresponding to those of the data.
${{{f_{C4}}} \over {{f_{C4}} + {f_{C3}}}}$
(the fraction of terrigenous organic matter from C4 plants) are represented in Fig. 6, and we generated smoothed curves fitting the data based on the distributions produced by bootstrap resampling of the data and the smoothed values at ages corresponding to those of the data.
Table 1. End-member values and ranges used in mixing models

a The precise end-member composition range makes little difference in the final interpretation (see Supplemental Discussion).
b The effects of marine δ13C end-member composition are considered in Section 4.1 and Fig. 6.
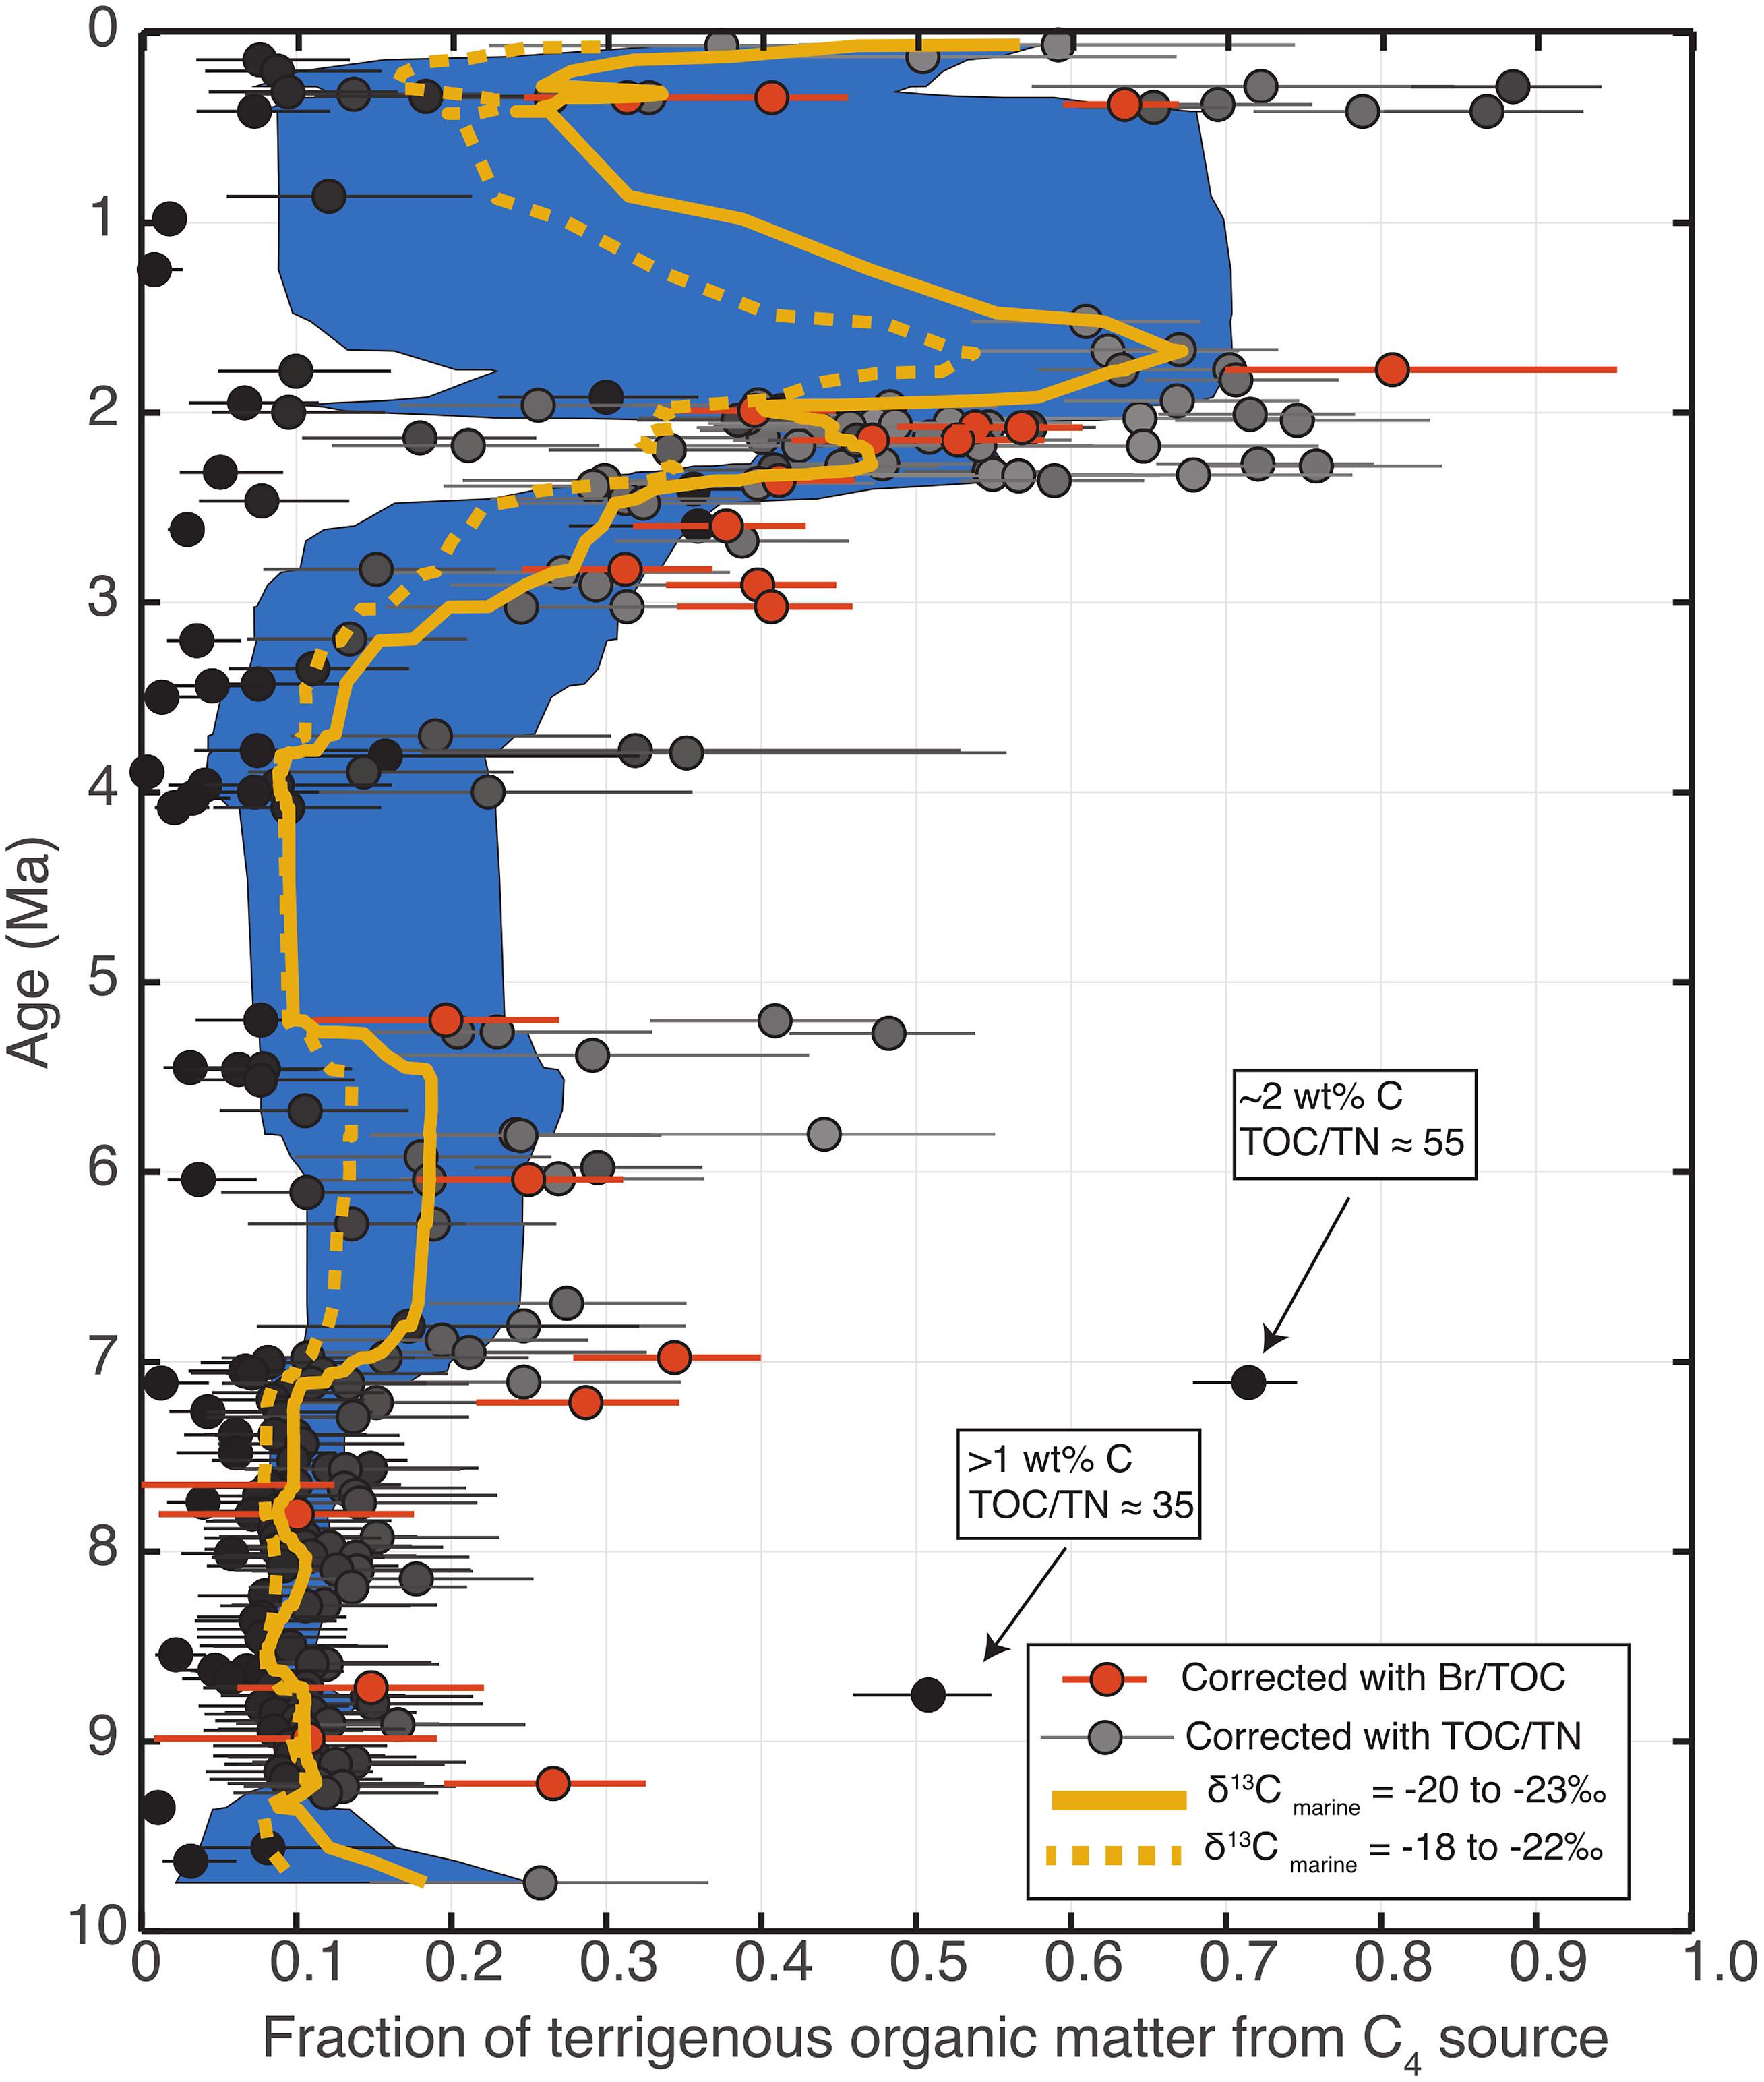
Figure 6. Estimated fraction of terrigenous organic matter from C4 plants through time based on δ13CTOC, TOC/TN and Br/TOC data from IODP Site 1480. Two separate mixing models using TOC/TN and Br/TOC data, respectively, were used to minimize the influence of marine organic matter. Data points in grey show the median output from 105 Monte Carlo simulations using random perturbations of TOC/TN and δ13CTOC end-member compositions, while the uncertainty bars represent the interquartile range of simulation outputs. Points in darker grey were inferred to have smaller contributions from marine organic matter and therefore underwent a smaller correction to minimize the influence of marine organic matter. Points in red show C4 fraction when contributions to the δ13CTOC data from marine sources were corrected for using Br/TOC, and the error bars represent the interquartile of values based on Monte Carlo simulations. The blue region represents the interquartile range of smoothed curves resulting from random resampling (bootstrapping) of C4 coverage estimates, while the yellow curve is the median of the smoothed curves from bootstrap resampling. Two main periods of C4 expansion (∼8.5–7 and ∼2.5 Ma) are apparent, suggesting a multi-phase transition towards greater aridity.
4. Results and discussion
4.a. Correcting for marine organic matter inputs
Bulk TOC δ13C data have been shown to correlate well with C isotope ratios of terrestrial plant biomarkers in Bengal Fan sediments (Freeman & Colarusso, Reference Freeman and Colarusso2001; Galy et al. Reference Galy, François, France-Lanord, Faure, Kudrass, Palhol and Singh2008), suggesting that marine sediment δ13CTOC (Fig. 3) presents a reasonable first-order view of landscape evolution and therefore palaeoclimate conditions. However, because the δ13C values of marine organic matter are typically intermediate between those of vascular C3 and C4 plant material, a shift towards higher δ13C values could reflect greater marine organic matter input rather than a true shift towards greater C4 plant abundance. Attempting to remove the marine organic matter δ13C signal using only δ13CTOC results in a mathematically underdetermined system in which the mixing contributions of three end-members (C3, C4 and marine organic matter) cannot be uniquely defined. Because correcting for inputs from marine organic matter offers the potential to place at least quantitative bounds on the C3/C4 contributions, we applied a multi-proxy approach to reduce the influence of marine organic matter contributions.
The ratio of TOC to total nitrogen (TN) is a widely used metric for the fraction of marine organic matter in marine sediments because while terrestrial organic C preserved in sediment is generally N-poor, largely proteinaceous marine organic matter tends to have much greater TN, leading to high TOC/TN ratios for terrigenous and low TOC/TN ratios for marine organic matter (Fig. 5). However, TOC/TN as an organic matter provenance proxy suffers from several problems, most notably the potential for inorganic N (primarily as NH4 +) to adsorb to clay minerals, producing artificially low TOC/TN values (Müller, Reference Müller1977), and a wide range in particularly the vascular C3 and C4 end-member compositions. We relied on three approaches to lessen these effects: (1) a large dataset of δ13C and TOC/TN (Fig. 5), which reduces the importance of individual data that might be influenced by NH4 + adsorption, (2) the additional less explored provenance proxy of Br/TOC, and (3) Monte Carlo simulations to reflect the influence of uncertainty in end-member compositions. We chose to use δ13CTOC as the main proxy for C3–C4 transition because the ease of the analytical procedure facilitates the gathering of a large dataset, and indeed, the δ13CTOC shows substantial scatter for nearly all time intervals, which suggest that restricted datasets using a more analytically challenging technique such as compound-specific isotope measurements may not fully reflect the range of isotopic variability during a given time interval.
While we used TOC/TN, measured on all samples, as the main proxy for organic matter provenance, we also analysed the trace element composition of a subset of samples (Figs. 4, 6; Table S2) to use Br/TOC as an additional proxy. The Br/TOC ratio in sediments with predominantly marine organic matter has been shown to far exceed that of sediments rich in terrigenous organic matter (Mayer et al. Reference Mayer, Schick, Allison, Ruttenberg and Bentley2007), presumably due to the incorporation of Br-rich secondary metabolites produced by marine organisms (e.g. Gribble, Reference Gribble1998). Therefore, as Mayer et al. (Reference Mayer, Schick, Allison, Ruttenberg and Bentley2007) found, we expect a graph of δ13CTOC and Br/TOC to be consistent with mixing between three extreme end-member compositions, and Fig. 5 confirms this, though samples from IODP Site U1480 are not as Br-rich as those Mayer et al. (Reference Mayer, Schick, Allison, Ruttenberg and Bentley2007) analysed from continental shelf cores. To evaluate the potential of Br/TOC ratios as an indicator of organic matter provenance in open ocean settings like Site U1480, we estimated the fraction of C4 plant coverage using δ13C and Br/TOC data to compare with results using the δ13C and TOC/TN system (Fig. 6). The degree of agreement between these two methods depends heavily on the choice of marine end-member Br/TOC, but using the ∼6–10 range suggested in Mayer et al. (Reference Mayer, Schick, Allison, Ruttenberg and Bentley2007) produces results that are remarkably similar to those generated using TOC/TN ratios. While the two methods of correcting for marine organic matter contributions are not entirely independent (both rely on δ13CTOC data), the agreement between the results they produce is encouraging.
We also used Monte Carlo simulations to help account for the uncertainty in C4 abundance arising from the possible range of end-member composition. Figure 6 shows the results using 105 end-member compositions for δ13CTOC, TOC/TN and Br/TOC taken randomly from distributions centred at our estimated end-member compositions and with generous standard deviations (Table 1). Because of the scatter in the resulting data, we used a bootstrapping technique to produce a range and best estimate (the resulting distribution median) of a smoothed curve of inferred C4 landcover (Fig. 6). In general, the raw δ13CTOC record and the inferred C4 coverage after correction for marine organic inputs show similar behaviour, suggesting that the overall influence of marine organic matter on reconstructions of landscape evolution is small, which accords with the correlation between vascular plant biomarker δ13C and δ13CTOC that has been established previously (Freeman & Colarusso, Reference Freeman and Colarusso2001; Galy et al. Reference Galy, François, France-Lanord, Faure, Kudrass, Palhol and Singh2008). However, while the δ13CTOC suggests that C4 expansion (associated with increasing δ13CTOC) may have started ∼9 Ma, inferred C4 coverage begins increasing just prior to 7 Ma. The fraction of organic matter from marine sources appears to have increased between 9 and 7 Ma, which causes the magnitude of the marine organic matter correction to increase during this interval and the inferred C4 coverage to remain nearly constant.
4.a.1. Difficulty in estimating end-member compositions
Determining a reasonable range for the δ13C composition of the marine organic end-member is particularly challenging because the data do not appear to uniformly support a δ13C of ∼−18 to −22 ‰ that the sea surface temperatures at this site would imply for phytoplankton (Descolas-Gros & Fontugne, Reference Descolas-Gros and Fontugne1990). Samples from IODP Site U1480E cores 1–2 largely post-date Nicobar Fan deposition and would therefore be expected to record the δ13C of marine organic matter. Indeed, these samples average −21.8 ‰ (ignoring the −26.2 ‰ value for U1480E-2H-6 139–140 cm as unrealistic for pure marine organic matter). However, sediments that pre-date the Nicobar Fan, below about 1,250 m, and which should also record a relatively pristine marine δ13C signal, have an average δ13C of −25.3 ‰ with only two samples exceeding −23 ‰. This raises the possibility that the δ13C of modern marine organic matter may not be valid as an end-member composition for samples from deeper in the core that underwent early diagenesis. The mechanism by which organic matter may become depleted in 13C is not immediately clear, since processes such as methanogenesis would be expected to leave an organic residue highly enriched in 13C. However, as Macko et al. (Reference Macko, Engels and Qian1994) discuss, degradation of organic matter, particularly protein-rich marine material, could lead to 13C depletion of the residue due to a diverse set of reactions and associated fractionations available to more functionalized organic compounds. Because of this apparent discrepancy between C isotope compositions of marine organic matter, we tested the effects of using two different δ13C ranges on the model outputs (Fig. 6). In one run, there are two models for C3 and C4 plant coverage: one using a marine organic matter δ13C of −20 to −23 ‰, representing the highest values in sediments that underlie Nicobar Fan material, and a second using a δ13C of −18 to −21% to reflect modern value phytoplankton δ13C in appropriately warm regions (Descolas-Gros & Fontugne, Reference Descolas-Gros and Fontugne1990). The model results using the modern phytoplankton δ13C suggest a lower fraction of C4 coverage at all times during the past and a smaller initial episode of C4 expansion commencing ∼7 Ma. We are hesitant to ascribe inordinate physical meaning to the apparent decrease in C4 coverage at ∼5 Ma due to the data sparsity, primarily resulting from low coring recovery, between ∼4 and 5 Ma. Because the main differences in inferred C4 coverage lie in the earlier part of the record, it is likely that the first model run with δ13C of marine organic matter reflecting the δ13C of hemipelagic/pelagic sediments underlying the Nicobar Fan is more likely to accurately reflect the true C4 plant coverage.
4.b. Strengths of the Nicobar Fan record
Part of the benefit of using terrigenous seafloor sediments such as those of the Nicobar Fan at IODP Site U1480 is that they spatially integrate heterogeneous signals over a wide enough area that localized changes are less likely to alter continental-scale interpretations. However, sediment records from the Bengal Fan may not fully archive terrestrial conditions during this time interval as the Nicobar Fan appears to have received a substantially greater fraction of Himalayan-sourced sediment (Pickering et al. Reference Pickering, Pouderoux, McNeill, Backman, Chemale, Kutterolf, Milliken, Mukoyoshi, Henstock, Stevens, Parnell and Dugan2019, Reference Pickering, Carter, Andò, Garzanti, Limonta, Vezzoli and Milliken2020); therefore, IODP Site U1480 may be better suited for understanding C4 expansion. Additionally, the analytical facility of conducting bulk TOC δ13C analyses compared to compound-specific isotope measurements means that the average temporal resolution of our dataset is over ten times greater than that of biomarker δ13C records from Freeman and Colarusso (Reference Freeman and Colarusso2001) and Karp et al. (Reference Karp, Behrensmeyer and Freeman2018). The δ13CTOC record from IODP Site U1480 may therefore reveal trends and timing that are not apparent in lower-resolution biomarker datasets. Finally, analyses of terrestrial samples from specific formations like the well-studied Siwalik palaeosols (Fig. 1) may fail to capture the true onset of a transition that is spatially heterogenous on a continental scale. Indeed, the range in values of both δ13CTOC and inferred C4 coverage during any given time interval in IODP Site U1480 record supports the hypothesis that the entire C3–C4 transition from ∼7.1–2 Ma was patchy, and that local terrestrial samples or sparsely sampled compound-specific isotope records may not convey the full spatial variability in ecosystem composition (Vögeli et al. Reference Vögeli, Najman, van der Beek, Huyghe, Wynn, Govin, van der Veen and Sachse2017).
Additionally, when compared with many studies using organic matter from sands/sandstones, the C3–C4 data presented in this study (from muds/mudstones) record a higher-resolution signal. Prior data from sandy sediments represent a more time-averaged response as these sediments can be stored in ‘temporary sinks’ in river and coastal systems for ∼100 kyr or longer (Gaudemer & Metivier, Reference Gaudemer and Metivier1999; Blöthe & Korup, Reference Blöthe and Korup2013), complicating the correlation of sedimentary archives to climate forcing. Sandy beds tend to be much thicker than muds/mudstones and represent relatively infrequent events compared with muddy sediment delivery to ocean basins. Sand samples depend on the availability of coarser-grained sediment, especially compared with the abundance of finer-grained sediment. Even though plant material will also be stored with sands, to be incorporated into (relatively infrequent) SGFs, plant material is also supplied continuously to ocean basins via higher-frequency processes such as hyperpycnal flows, nepheloid layers and other plumes of suspended finer-grained sediment from river and coastal environments. Thus, understanding any climate change signals is best achieved by analysing muddy sediments from, for example, the distal parts of the Nicobar Fan. It is, therefore, perhaps unsurprising that many studies of sandy sediments tend to show more gradual (and temporally aliased) signals.
4.c. Climatic implications of inferred C3–C4 transition
Our data suggest that the expansion of C4 plant coverage in the South Asia was punctuated by two distinct periods of C4 expansion rather than a consistent gradual shift or single episode as inferred from many terrestrial and marine records (Quade et al. Reference Quade, Cerling and Bowman1989; Prell & Kutzbach. Reference Prell and Kutzbach1992; Freeman & Colarusso, Reference Freeman and Colarusso2001; Gupta & Thomas, Reference Gupta and Thomas2003). We infer an initial episode of C4 expansion starting at ∼7.1 Ma, which broadly agrees with the timing inferred from earlier studies (e.g. Bengal Fan δ13C in Quade et al. Reference Quade, Cerling and Bowman1989; δ13C in Freeman & Colarusso, Reference Freeman and Colarusso2001) as well as a period of monsoon intensification (Rea et al. Reference Rea, Snoeckx, Joseph and Arbor1998; Wan et al. Reference Wan, Li, Clift and Stuut2007) but slightly post-dates the inferred intensification of summer monsoon wind patterns from the Indian subcontinent (e.g. δ18O from Quade et al. Reference Quade, Cerling and Bowman1989) and Indian Ocean (Kroon et al. Reference Kroon, Steens and Troelstra1991; Prell & Kutzbach. Reference Prell and Kutzbach1992; Gupta & Thomas, Reference Gupta and Thomas2003), in addition to the shift towards C4 plant dominance in North America, South America and East Africa (Cerling et al. Reference Cerling, Harris, McFadden, Leakey, Quade, Eisenmann and Ehleringer1997). The second period of C4 expansion beginning at ∼3.5 Ma and punctuated by a rapid increase at ∼2.5 Ma is inferred to be of greater magnitude and does not appear in records from either terrestrial palaeosols or marine sediments from the Bengal Fan, though the temporal resolution of these records is typically of insufficient resolution during this time interval. Using geochemical and magnetic data obtained from a ferromanganese crust in the western Pacific, together with climate models, Zhong et al. (Reference Zhong, Shi, Yang, Wilson, Hein, Kaboth-Bahr, Lu, Clift, Yan, Lohmann, Liu, González, Jiang and Liu2022) interpret their data to suggest an equatorward shift of the westerly jet and humidification of Central Asia during the gradual transition from a warm Pliocene climate to the cool Pleistocene, between ∼2.5 and 2.7 Ma. This time interval coincides with our inferred increase in C4 coverage (Fig. 7). Lu et al. (Reference Lu, Dewald, Koutsodendris, Kaboth-Bahr, Rösler, Fang, Pross, Appel and Friedrich2020) used a temporally highly resolved (∼500 years) sedimentological record from the Qaidam Basin, NE Tibetan Plateau, to show pronounced glacial–interglacial climate variability during the interval from 2.7 to 2.1 Ma.
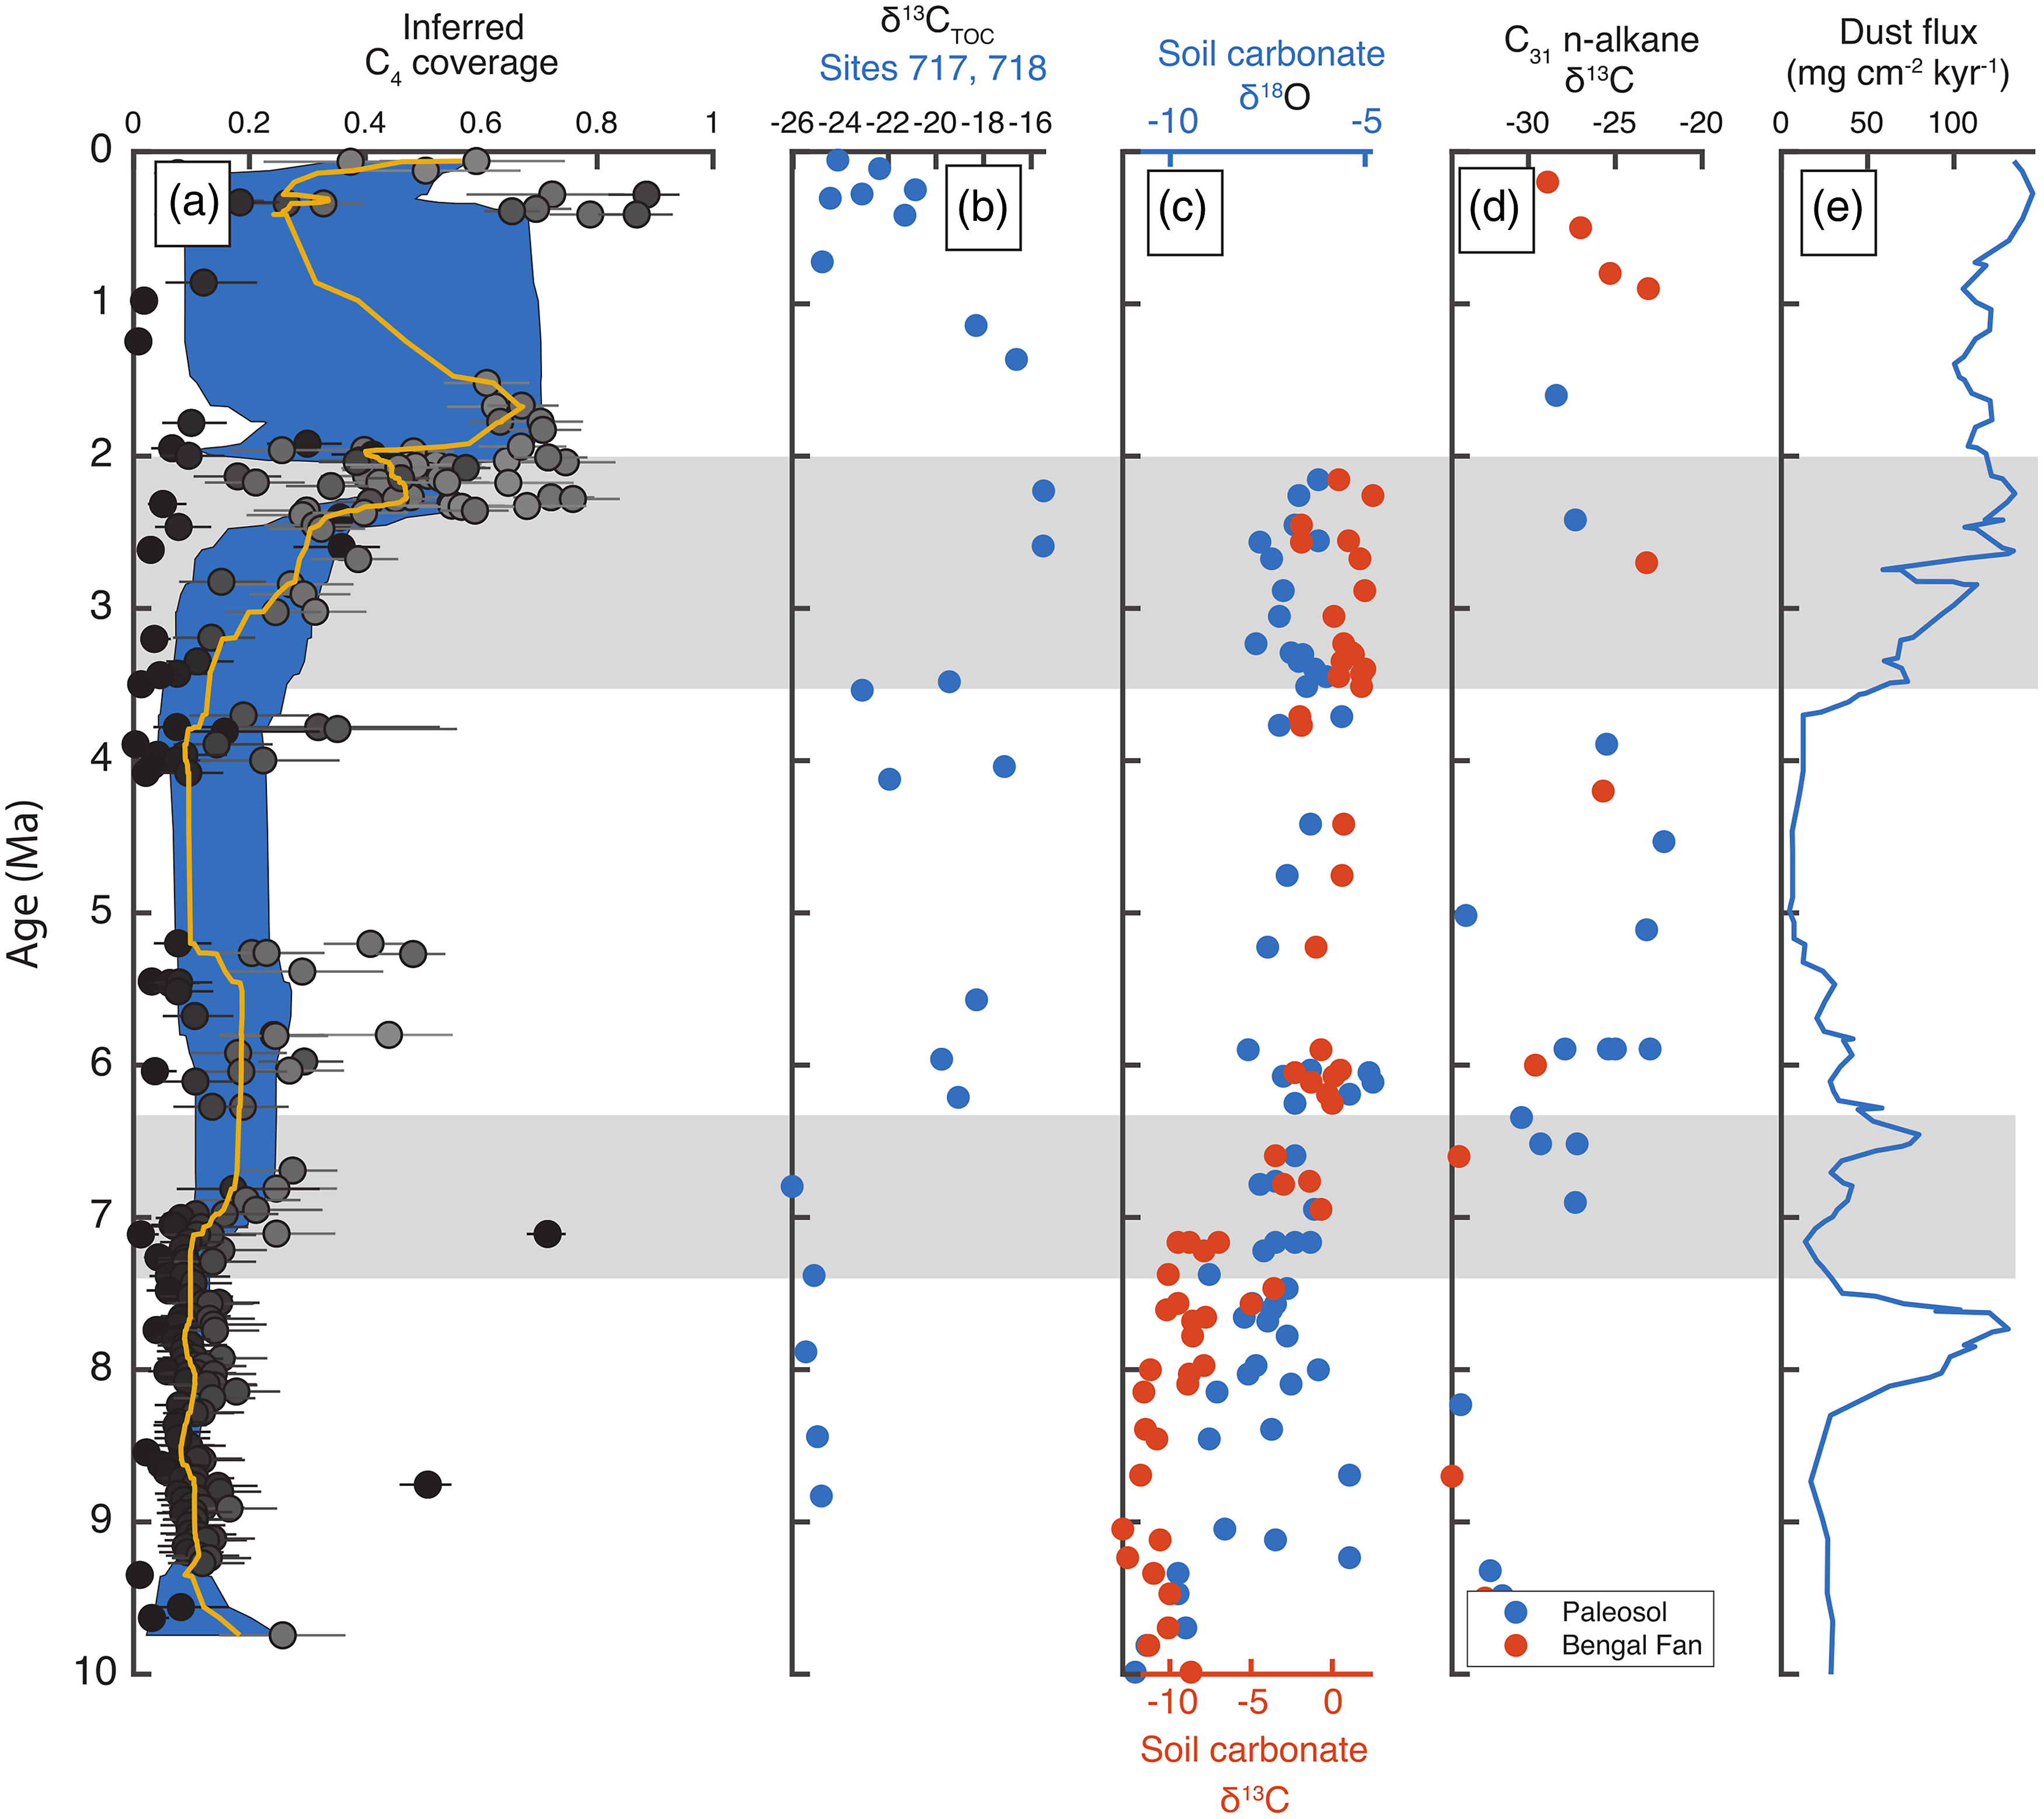
Figure 7. Comparison of multiple marine and terrestrial proxies for the C3–C4 changes and aridity including: (a) inferred C4 coverage from IODP Site U1480 data (this study), (b) δ13CTOC from ODP sites 717 and 718 on the Bengal Fan (France-Lanord & Derry, Reference France-Lanord and Derry1994), (c) isotopic composition of carbonate nodules from the western Siwalik (Quade et al. Reference Quade, Cerling and Bowman1989) with δ13C and δ18O relative to PDB, (d) δ13C of C31 n-alkanes extracted from Siwalik palaeosols and Bengal Fan sediments (Freeman & Colarusso, Reference Freeman and Colarusso2001; Karp et al. Reference Karp, Behrensmeyer and Freeman2018), and (e) dust flux at ODP sites 885 and 886 (Rea et al. Reference Rea, Snoeckx, Joseph and Arbor1998) in the North Pacific. The two periods of major C4 expansion beginning at ∼7 and 3.5 Ma in the IODP Site U1480 records are highlighted in grey.
4.c.1. First episode of C4 expansion ∼7.1 Ma
The first episode of C4 expansion ∼7.1 Ma appears to coincide with the timing of a period of monsoon intensification recorded in aeolian dust flux in the North Pacific (Rea et al. Reference Rea, Snoeckx, Joseph and Arbor1998) and South China Sea (Wan et al. Reference Wan, Li, Clift and Stuut2007) and also agrees well with the timing of δ13C increase in carbonate nodules from the Siwalik palaeosols. The decrease in median inferred C4 coverage from ∼5.5–5 Ma also mirrors the decrease in dust flux, though the gap in the IODP Site U1480 record from ∼4.1–5.1 Ma makes us cautious in this interpretation. This episode of C4 expansion in IODP Site U1480 record appears to pre-date the increase in δ13C of vascular plant biomarkers that is apparent around 6 Ma (Freeman & Colarusso, Reference Freeman and Colarusso2001; Karp et al. Reference Karp, Behrensmeyer and Freeman2018; Fig. 6), although there are difficulties in dating C4 expansion using the compound-specific datasets that are discussed in Section 3.2. Interestingly, the initial pulse in dust flux to sites 885/886 at ∼7.7 Ma does not coincide with either a change in soil carbonate δ18O, an indication of local monsoon intensity, or the first episode of C4 expansion, although Rea et al. (Reference Rea, Snoeckx, Joseph and Arbor1998) note that attributing a cause to this peak in dust flux is difficult.
Other records of monsoon intensity inferred from the loess plateaus suggest that aridification progressed northward through time as the East Asian monsoon intensified, increasing the difference in seasonal precipitation (Shen et al. Reference Shen, Wan, France-Lanord, Clift, Tada, Révillon, Shi, Zhao, Liu, Yin, Song and Li2017, Reference Shen, Wan, Colin, Tada, Shi, Pei, Tan, Jiang and Li2018), which is consistent with our results. We detect the C4 shift beginning ∼7.1 Ma (cf. the 7.4–7.2 Ma expansion of C4 grasslands on the Indian subcontinent as documented from the Indus Fan, Arabian Sea, by Feakins et al. Reference Feakins, Liddy, Tauxe, Galy, Feng, Tierney, Miao and Warny2020), which lags slightly behind the change in Indian Ocean monsoon intensity inferred from carbonate nodule δ18O (Freeman & Colarusso, Reference Freeman and Colarusso2001) but is contemporaneous with the increase in soil carbonate δ13C of Quade et al. (Reference Quade, Cerling and Bowman1989). Additionally, northward C4 grassland expansion is consistent with the shift towards higher δ13C of mammal tooth enamel, which indicates a diet including more C4 grasses, shortly after 10 Ma in northern Pakistan but later in China (Arppe et al. Reference Arppe, Kaakinen, Passey, Zhang and Fortelius2015).
However, we note that two samples (U1480G-42R-1 12–13 cm and U1480F-96X-1 18–19 cm) show a combination of high TOC (above 1 wt% C), high TOC/TN (∼35 and 57, respectively) and δ13C values of −19.0 and −21.7‰ at 8.8 and 7.1 Ma (Fig. 5), which strongly suggests localized areas of anomalously high C4 coverage. This supports the ‘vegetation mosaic’ proposed by Freeman and Colarusso (Reference Freeman and Colarusso2001) in which some environments like river floodplains are likely to be particularly sensitive to monsoon intensity as episodic inundation and desiccation would become more dramatic, favouring C4 grasses that could resist drier winters. Monsoon intensification is likely, they argue, to have a lesser effect on more mountainous areas not susceptible to periodic flooding, and these environments are therefore more likely to retain C3 plants. The modern landscape (Galy et al. Reference Galy, François, France-Lanord, Faure, Kudrass, Palhol and Singh2008) and analyses of Siwalik palaeosol organic matter from the eastern front of the Himalaya (Vögeli et al. Reference Vögeli, Najman, van der Beek, Huyghe, Wynn, Govin, van der Veen and Sachse2017) support spatial heterogeneity in aridity and C3 and C4 plant coverage, as do palynological studies (Morley, Reference Morley2018) and model results based on orographic effects (Boos & Kuang, Reference Boos and Kuang2010). These two samples indicating significantly higher C4 coverage than the bulk of the dataset may then represent localized pockets of C4 abundance prior to the regional expansion. This would be consistent with the globally synchronous expansion of C4 plant coverage beginning ∼9 Ma (Kroon et al. Reference Kroon, Steens and Troelstra1991; Prell & Kutzbach. Reference Prell and Kutzbach1992; Cerling et al. Reference Cerling, Harris, McFadden, Leakey, Quade, Eisenmann and Ehleringer1997) and may argue for a more widespread mechanism than intensification of the South Asian monsoon. However, without additional data to corroborate C4 expansion starting ∼9 Ma, we are cautious not to over-interpret the dataset.
The explanation by Cerling et al. (Reference Cerling, Harris, McFadden, Leakey, Quade, Eisenmann and Ehleringer1997) that decreasing atmospheric pCO2 in the late Miocene was a fundamental driver of global climate change is supported by later studies (e.g. Pagani et al. Reference Pagani, Zachos, Freeman, Tipple and Bohaty2005; Beerling & Royer, Reference Beerling and Royer2011; Rae et al. Reference Rae, Zhang, Liu, Foster, Stoll and Whiteford2021). Pagani et al. (Reference Pagani, Zachos, Freeman, Tipple and Bohaty2005) pointed out that ‘the fall in pCO2 likely allowed for a critical expansion of ice sheets on Antarctica and promoted conditions that forced the onset of terrestrial C4 photosynthesis’.
Finally, expansive wildfires have been proposed as either a cause or result of C4 grassland expansion (Scheiter et al. Reference Scheiter, Higgins, Osborne, Bradshaw, Lunt, Ripley, Taylor and Beerling2012), but while records of fire frequency have limited temporal resolution, they do not appear to show an increase that is consistent with the first episode of C4 expansion starting at ∼7.1 Ma (Karp et al. Reference Karp, Behrensmeyer and Freeman2018). The complexity and multitude of explanations for increasing aridity in South and Central Asia make us hesitant to definitively attribute the first C4 expansion to a single mechanism, but a consensus appears to be building around the primacy of monsoon intensification (e.g. An et al. Reference An, Huang, Liu, Guo, Clemens, Li, Prell, Ning, Cai, Zhou, Lin, Zhang, Cao, Qiang, Chang and Wu2005), which is consistent with our observations.
4.c.2. Second episode of C4 expansion
The second main feature of both the δ13C data and inferred C4 coverage is a gradual increase in inferred C4 coverage beginning at ∼3.5 Ma and punctuated by a sharp increase in δ13CTOC and C4 fraction at ∼2.5 Ma, effectively coeval with the major expansion of Northern Hemisphere glaciation (e.g. Raymo et al. Reference Raymo, Ruddiman, Backman, Clement and Martinson1989). Similar changes have been recorded in the abundance of marine primary producers thought to be particularly responsive to upwelling intensity (Kroon et al. Reference Kroon, Steens and Troelstra1991; Prell & Kutzbach. Reference Prell and Kutzbach1992) as well as magnetic susceptibility and aeolian dust flux from loess and marine sediment deposits (Fig. 6; Rea et al. Reference Rea, Snoeckx, Joseph and Arbor1998). However, other records of C4 expansion on the Indian subcontinent do not record an additional transition at ∼2.5 Ma (Quade et al. Reference Quade, Cerling and Bowman1989; Cerling et al. Reference Cerling, Harris, McFadden, Leakey, Quade, Eisenmann and Ehleringer1997; Freeman & Colarusso, Reference Freeman and Colarusso2001; Karp et al. Reference Karp, Behrensmeyer and Freeman2018), though several of these records lack the data coverage to identify such a transition (Fig. 6). While the stepwise ∼2.5 Ma transition in the IODP Site U1480 record could conceivably arise from a sudden change in sediment provenance rather than true C4 expansion, zircon age spectra from IODP Site U1480 are inconsistent with major sediment provenance shifts (McNeill et al. Reference McNeill, Dugan, Backman, Pickering, Pouderoux, Henstock, Petronotis, Carter, Chemale, Milliken, Kutterolf, Mukoyoshi, Chen, Kachovich, Mitchison, Bourlange, Colson, Frederik, Guèrin, Hamahashi, House, Hüpers, Jeppson, Kenigsberg, Kuranaga, Nair, Owari, Shan, Song, Torres, Vannucchi, Vrolijk, Yang, Zhao and Thomas2017a).
The increase in C4 coverage beginning around 3.5 Ma coincides with a pronounced increase in North Pacific dust flux (Fig. 7), perhaps suggesting that monsoon intensification may have been a primary factor in the second episode of C4 expansion as well. Within the overall trend towards greater C4 coverage is a sharp transition at ∼2.5 Ma that is notable both for its magnitude and abruptness. While we note that quantitative estimates of C4 coverage are more affected by changes in end-member composition than trends, the highest inferred C4 fractions just prior to 2.5 Ma are ∼50% compared with samples implying 80% C4 coverage just after 2.5 Ma. This increase is of similar magnitude to the change throughout the entire rest of the record but occurs over about 0.5 Myr. The sample density is relatively low just prior to this event, but even the smoothed bootstrapping results – which will be much less sensitive to individual data points – imply a sharp transition at ∼2.5 Ma, suggesting it is unlikely to arise as an artefact of sample density. Such a dramatic, essentially stepwise, change demands a similarly abrupt cause and coincides with the major expansion of Northern Hemisphere glaciation (e.g. Zachos et al. Reference Zachos, Pagani, Sloan, Thomas and Billups2001), which made South and East Asian climates more arid (Shen et al. Reference Shen, Wan, France-Lanord, Clift, Tada, Révillon, Shi, Zhao, Liu, Yin, Song and Li2017, Reference Shen, Wan, Colin, Tada, Shi, Pei, Tan, Jiang and Li2018). However, it could be argued that the overall increase in inferred C4 coverage between ∼3.2 and 1.7 Ma (Fig. 7) may have been more related to uplift of the Himalaya and Tibetan Plateau leading to increase aridity in the source area for the sediments. Our estimates of C4 fraction agree remarkably well with those of An et al. (Reference An, Huang, Liu, Guo, Clemens, Li, Prell, Ning, Cai, Zhou, Lin, Zhang, Cao, Qiang, Chang and Wu2005) based on modelling results assuming multiple episodes of Himalayan uplift and records of East Asian summer monsoon intensity, so we cannot discount the possibilities that regional uplift, a global climate shift and/or spatially complex landscape evolution conspired to produce the ecological changes apparent in the IODP Site U1480 record.
5. Conclusions
Altogether, the elemental and isotopic composition of organic matter at IODP Site U1480 provides an unusually complete insight of major climate shifts on the Indian subcontinent since ∼10 Ma and suggests two distinct episodes of C4 expansion in the source area for the sediments. The first, beginning ∼7.1 Ma, coincides with a period of inferred monsoon intensification and agrees well with the timing of a shift in soil carbonate δ13C but pre-dates the ∼6 Ma shift inferred from compound-specific isotope studies of limited temporal resolution. Isolated samples prior to this hint at the possibility of earlier C4 expansion in some areas, which may help reconcile the timing with the slightly earlier C4 expansion, observed on multiple continents (Cerling et al. Reference Cerling, Harris, McFadden, Leakey, Quade, Eisenmann and Ehleringer1997). The second episode of C4 expansion began at ∼3.5 Ma and was punctuated by a rapid shift at ∼2.5 Ma, consistent with a climatic alteration contemporaneous with the expansion of Northern Hemisphere glaciation, a major climatic event whose effects have not been identified in records of C4 plant coverage on the Indian subcontinent. While it seems reasonable to see a significant change in the relative importance of C3 and C4 plants (cf. Sarangi et al. Reference Sarangi, Agrawal and Sanyal2021) in response to global cooling at ∼2.5 Ma, which coincides with the dramatic increased sediment accumulation rates (SARs) in the Nicobar Fan (Site U1480 in Pickering et al. Reference Pickering, Pouderoux, McNeill, Backman, Chemale, Kutterolf, Milliken, Mukoyoshi, Henstock, Stevens, Parnell and Dugan2019, Fig. 9), this shift in SARs appears not to observed in the Bengal Fan, probably because at that time sediment routing was predominantly to the east in the Nicobar Fan. The underlying reasons for both phases of C4 expansion may be complex and different, for example, with the latter involving at least a contributory tectonic component due to the sustained uplift of the Himalaya and Tibetan Plateau. Our data from the deep sea for a multi-phased C4 expansion on the Indian subcontinent are broadly in agreement with terrestrial data from the Indian Siwaliks.
The wide array and complexity of potential forcing mechanisms make drawing definitive conclusions about climate vs tectonic drivers challenging (cf. Lenard et al. Reference Lenard, Lavé, France-Lanord, Aumaître, Bourlès and Keddadouche2020); however, the uniquely detailed record of δ13CTOC from IODP Site U1480 underscores the potential for both local factors (e.g. monsoon intensification) and global (expansion of Northern Hemisphere glaciation) ones in causing spatially heterogenous landscape evolution. Our approach shows the promise of combining voluminous analytically facile data, multiple proxies and uncertainty estimation techniques to more quantitatively describe geochemical processes that can be linked to environmental change.
Supplementary material
The supplementary material for this article can be found at https://doi.org/10.1017/S0016756823000481
Acknowledgements
Participation on IODP Expedition 362 and post-expedition analyses were supported by the United States Science Support Program and the UK Natural Environment Research Council (NERC). Funding support was provided by the United States Science Support Program Post Expedition Award GG009393-01 to BMH. Dyke Andreasen and Colin Carney of the University of Santa Cruz Stable Isotope Laboratory provided insight into sample preparation and conducted analyses of organic matter. Sarah Feakins of the University of Southern California provided helpful discussion regarding sample preparation and data interpretation. We are particularly grateful to Marta Torres for her guidance and advice during IODP Expedition 362 and for enabling the INAA analyses. All members of the IODP Expedition 362 Scientific Party contributed to sample collection and generation of peripheral datasets. We thank Sarah Feakins, Peter Clift and an anonymous reviewer for their insightful comments in the review process that have led to a much improved manuscript.


 Open access