


1. Introduction
Natural faults and fractures form the most common geological structures and control the mechanical strength and fluid flow in the Earth’s crust. These structures exist on all scales, ranging from regional fault systems and individual faults to fracture systems and micro-cracks in fault damage zones. Faults are complex four-dimensional (4D) structures consisting of heterogeneously deformed volumes of country rock, and characterized by a complex spatial and temporal evolution of their structural and fluid flow properties. Fault and fractures show typical self-similar or scale-invariant characteristics and are characterized by highly variable strains and transient nonlinear deformation mechanisms. Structural and petrophysical analyses therefore strongly depend on the observational scale, ranging from regional to micro-scales. The smaller the scale, the smaller the faults that are observable (Wibberley & Shipton, Reference Wibberley and Shipton2010).
Fault zones are composed of rocks in variable degrees of deformation, consisting of a high-strain fault core with one or several slip zones, gouge and breccias embedded in a low-strain fracture-dominated ‘damage zone’ (Billi et al. Reference Billi, Salvini and Storti2003; Kim et al. Reference Kim, Peacock and Sanderson2004; Choi et al. Reference Choi, Edwards, Ko and Kim2016). Strain localization leads to the progressive abandonment of many distributed small faults in the stress shadow of a few larger faults, which then accumulate further displacement. Due to the spatial and temporal heterogeneity of faults and fault zones, the investigation of fault and fracture processes critically depends on the range of spatial and temporal observation scales (Fig. 1).
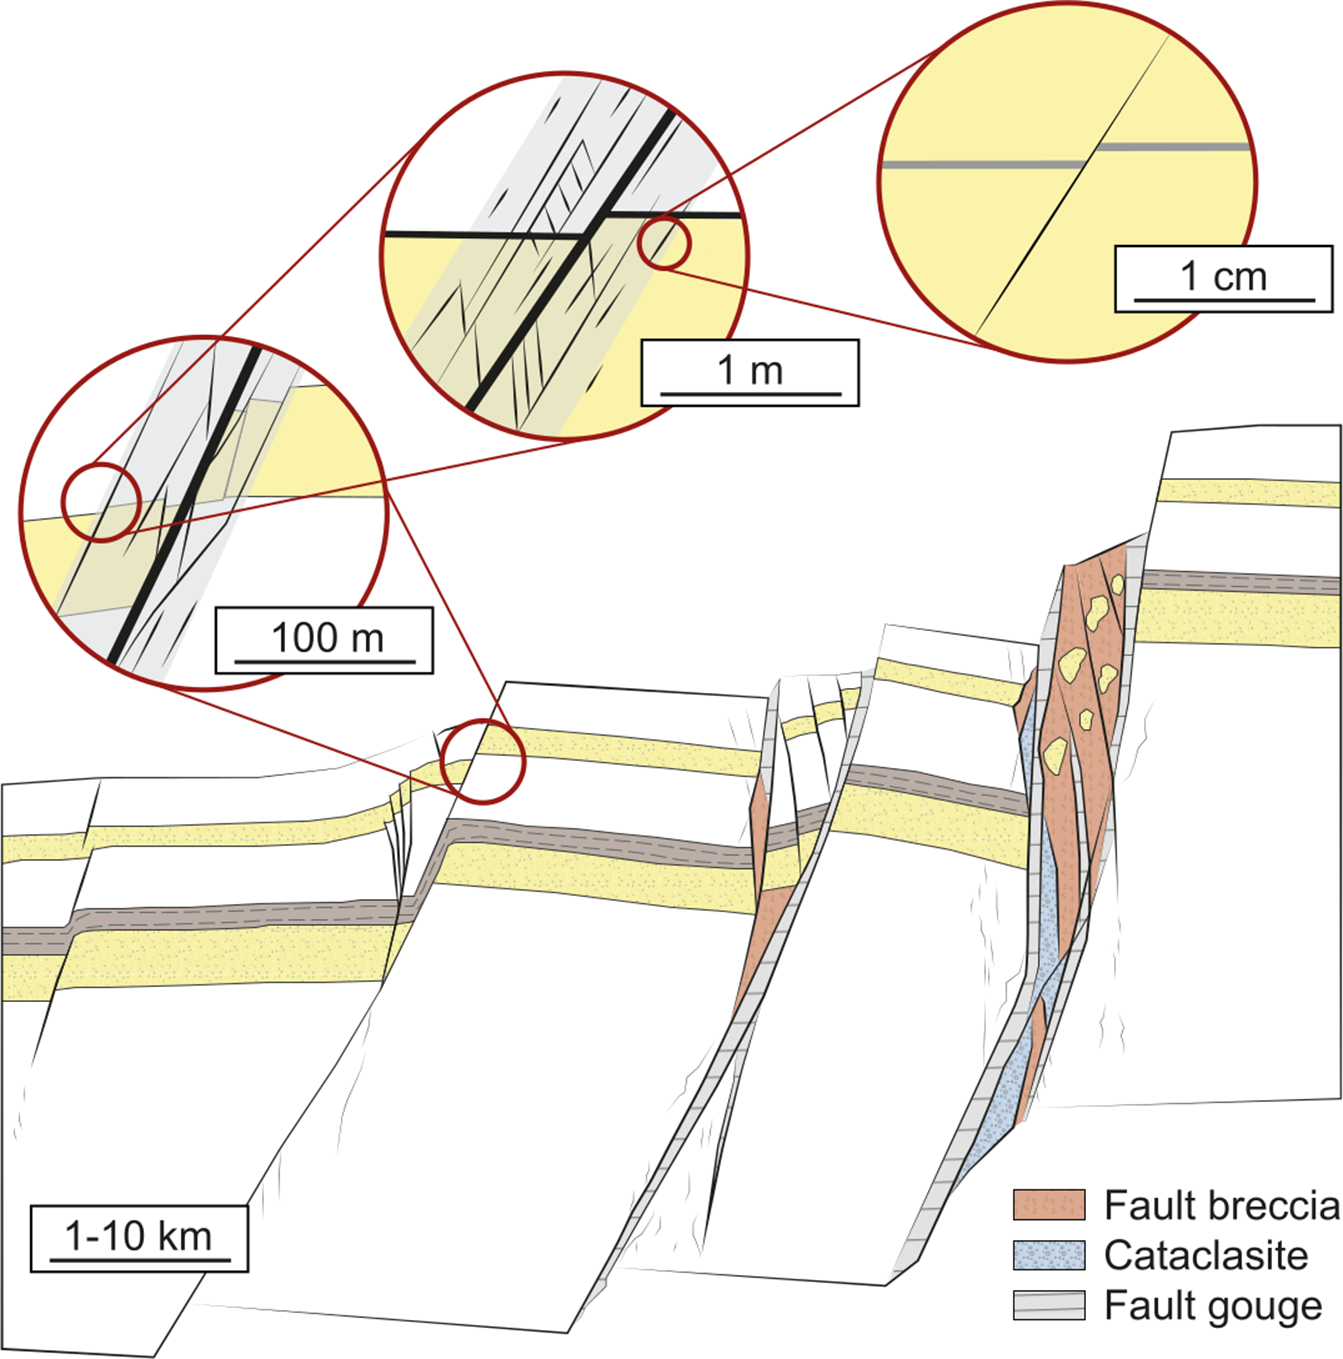
Fig. 1. Complexity of fault systems shown in terms of observation scale and strain evolution (modified after Wibberley & Shipton, Reference Wibberley and Shipton2010; Fossen, Reference Fossen, Scarselli, Adam, Chiarella, Roberts and Bally2020).
The comprehension of a fault system and the related fracture network architectures has a critical societal impact involving many areas of geosciences, including the development of important predictive tools and modelling techniques, from the exploration and management of natural resources to the analysis and mitigation of environmental hazards.
Despite extensive geological field studies and laboratory-based material tests, the analysis of these multi-scale deformation processes in fault zones and the identification of their underlying fundamental processes remain a challenge. Rock mechanic tests of brittle rocks have confirmed the complex rheology and contrasting nonlinear deformation mechanisms that are controlled by variable stress conditions in the Earth’s crust. However, laboratory rock mechanics results cannot be scaled up easily to large fault–fracture systems. Mechanical fault models and numerical continuum finite-element (FE) modelling techniques apply only simplified mathematical models of the relevant physical processes (e.g. Coulomb rheology), and do not achieve the required spatial resolution for simulating complex multi-scale fault–fracture systems (Davis, Reference Davis1984; Mandl, Reference Mandl1988; Twiss & Moores, Reference Twiss and Moores1992).
Analogue modelling techniques provide an important tool for the spatial and temporal investigation of tectonic processes. For the simulation of upper crustal deformation processes, cohesion-less granular materials, such as dry quartz sand, are widely used (Reber et al. Reference Reber, Cooke and Dooley2020). These materials show nonlinear frictional properties similar to natural rocks and are ideal to simulate the 3D architecture of complex regional-scale fault systems. On the other hand, cohesion-less granular materials are not able to form extension fractures and cannot provide suitable dynamic scaling and spatial resolution for the simulation of fault–fracture networks in fault damage zones.
In this study, we present a new granular rock-analogue material (GRAM; introduced by Chemenda et al. Reference Chemenda, Nguyen, Petit and Ambre2011) with scaled physical and mechanical parameters for the realistic simulation of multi-scale fault–fracture processes in scaled physical experiments. GRAM development was based on quartz sand aggregates prepared with the addition of different materials acting as cementing agents, such as gelatine, sugar, vegetable oil and hemihydrate powder. The mechanical properties of the four potential aggregates were qualitative and quantitatively tested by means of ring-shear tests (RSTs) and uniaxial compression tests (UCTs).
Sand–hemihydrate samples appeared to be the most suitable GRAM candidate, capable of deforming by shear and tensile failure under variable loading conditions, while maintaining the nonlinear elastic-frictional-plastic properties of granular solids such as dry sand. The dynamic scaling provided by this model material enabled the simulation at the targeted model resolution, with 1 cm in the model corresponding to the outcrop scale (1–100 m). Furthermore, the mechanical properties of the key material can be adjusted by applying different mixing ratios of sand and hemihydrate, allowing adjustment of the model resolution and geometrical scaling.
As a proof-of-concept, we tested GRAM for the simulation of fault initiation and localization in a low-strain strike-slip damage zone by performing a series of strike-slip experiments, monitored and analysed by digital image correlation (DIC) techniques. The experiment series confirmed the suitability of the sand–hemihydrate GRAM material for the simulation of coupled fault–fracture processes in dynamically scaled analogue experiments. Mechanical analysis of integrated fault–fracture processes observed in GRAM experiments will provide an improved understanding of the formation, growth and co-evolution of fault–fracture systems in the subsurface. The simulation of coupled fault–fracture processes in scaled analogue experiments can help to develop predictive tools for the understanding of such complex structures, analysing the dynamical interaction of faults and fractures during the different stages of deformation.
2. Geological background
2.a. Faults and fractures
Failure occurs in a material when it is unable to support the acting stress state without permanent deformation. Brittle failure is represented by a surface where the material loses cohesion and breaks apart, whereas in ductile failure the permanent deformation occurs without losing cohesion. In the brittle field, two main types of fractures are identified as end-members of the deformation process, namely shear and tensile failure. Their occurrence depends on several conditions, including the acting stress field and differential stresses. The state of stress at a point can be graphically represented by Mohr diagrams (Fig. 2) where the failure envelope, defined by the Mohr circles, represents the critical stresses at failure on a set of planes (Twiss & Moores, Reference Twiss and Moores1992). The normal and shear stresses acting on all existing and potential planes change systematically with the orientation of the plane (Hoek & Brown, Reference Hoek, Brown and Curran1988).

Fig. 2. Graphic representation of the combined criteria defining tensile, hybrid and shear failure.
Depending on the stress conditions in the upper crust, rocks exhibit a wide range of rheologies (Hoek & Martin, Reference Hoek and Martin2014). At the regional scale, faults can be classified with respect to the principal stress tensor orientation (Anderson, Reference Anderson1951), and a simplified Coulomb rheology can be applied for fault mechanics analysis (Davis, Reference Davis1984; Mandl, Reference Mandl1988; Twiss & Moores, Reference Twiss and Moores1992).
At a smaller scale, as demonstrated by rock mechanics laboratory tests, when subjected to large differential stresses, rocks show a nonlinear strain-dependent elastic/frictional behaviour with contrasting deformation mechanisms under variable stress conditions. The contrasting deformation processes include elastic deformation, plastic deformation with strain softening and strain hardening, strain-dependent strength, transient deformation mechanisms, frictional sliding, cataclastic flow and tensile, compressional or shear failure (Byerlee, Reference Byerlee1978; Paterson, Reference Paterson1978; Mandl, Reference Mandl1988; Krantz, Reference Krantz1991; Schellart, Reference Schellart2000; Marcher & Vermeer, Reference Marcher, Vermeer, Vermeer, Herrmann, Luding, Ehlers, Diebels and Ramm2001; Lohrmann et al. Reference Lohrmann, Kukowski, Adam and Oncken2003; Panien et al. Reference Panien, Schreurs and Pfiffner2006). On the other hand, when undergoing small differential stresses rocks deform by tensile failure with the formation of cracks, tension gashes or extension fractures (Hoek & Bieniawski, Reference Hoek and Bieniawski1965; Basu et al. Reference Basu, Mishra and Roychowdhury2013).
Across different scales of observations, the initiation of faults in brittle rocks is controlled by tensile cracks and extension fracturing, growing by coalescence of pre-existing sub-parallel tensile structures, represented by joints, veins or pressure solution seams (Reches & Lockner, Reference Reches and Lockner1994; Moore & Lockner, Reference Moore and Lockner1995; Peacock & Sanderson, Reference Peacock and Sanderson1995; Scholz, Reference Scholz2002; Healy et al. Reference Healy, Jones and Holdsworth2006; Choi et al. Reference Choi, Edwards, Ko and Kim2016). Their geometries and stress interactions during fault growth influence the fault evolution and orientation (Healy et al. Reference Healy, Jones and Holdsworth2006; Scholz, Reference Scholz2002). Mode I tensile fracturing therefore occurs first, then the structures link together in a locally perturbed stress field and, eventually, a through-going slip surface develops, allowing modes II and III shear fracturing to occur as a secondary fracture mechanism (Crider & Peacock, Reference Crider and Peacock2004).
2.b. Fault zones
A fault system is a complex volume of deformed rock, within which differently strained zones, and related structures, are observed (Wibberley et al. Reference Wibberley, Yielding and Di Toro2008; Faulkner et al. Reference Faulkner, Jackson, Lunn, Schlische, Shipton, Wibberley and Withjack2010). These are classified as internal fault zone and enveloping damage zones (Chester & Logan, Reference Chester and Logan1987; Caine et al. Reference Caine, Evans and Forster1996; Childs et al. Reference Childs, Nicol, Walsh and Watterson1996; Vermilye & Scholz, Reference Vermilye and Scholz1998; Wibberley et al. Reference Wibberley, Yielding and Di Toro2008; Faulkner et al. Reference Faulkner, Jackson, Lunn, Schlische, Shipton, Wibberley and Withjack2010). The central fault core accommodates most of the displacement (Micarelli et al. Reference Micarelli, Benedicto and Wibberley2006; Ferrill et al. Reference Ferrill, Morris, McGinnis, Smart and Ward2011), is relatively highly strained and, depending on the type of rocks involved, consists of unconsolidated clay-rich gouge zones, breccia, cataclasite and ultracataclasite. The surrounding damage zone shows, at different scales, lower-strain deformation structures such as microfractures, outcrop-scale fracture networks, veins, cleavage, folds and deformation bands, enhancing the fault zone permeability. Strictly depending on the observation scale, several faults of different orders are contained within this fault volume (Billi et al. Reference Billi, Salvini and Storti2003; Kim et al. Reference Kim, Peacock and Sanderson2004; Faulkner et al. Reference Faulkner, Jackson, Lunn, Schlische, Shipton, Wibberley and Withjack2010; Choi et al. Reference Choi, Edwards, Ko and Kim2016).
The damage zone is, in turn, surrounded by the undeformed host rock, representing a transition between the zones of high-deformation and non-deformation. The fault damage zone is closely associated with the fundamental processes of fault initiation, growth, termination and long-term evolution (Cowie & Shipton, Reference Cowie and Shipton1998; Peacock, Reference Peacock2002; Kim et al. Reference Kim, Peacock and Sanderson2003, Reference Kim, Peacock and Sanderson2004; Shipton & Cowie, Reference Shipton and Cowie2003; Gudmundsson et al. Reference Gudmundsson, Simmenes, Larsen and Philipp2010). Damage zones are seen in many geological disciplines as the key factor controlling overall fault properties, for example, the regional tectonic evolution (Scholz & Cowie, Reference Scholz and Cowie1990; Marrett & Allmendinger, Reference Marrett and Allmendinger1992; Walsh et al. Reference Walsh, Watterson, Bailey and Childs1999), earthquake faulting and seismic hazards (Sibson, Reference Sibson1989; Kim & Sanderson, Reference Kim, Sanderson, Landowne and Hammler2009; Choi et al. Reference Choi, Jin, Enkhbayar, Davvasambuu, Bayasgalan and Kim2012), fluid flow in the Earth crust (Simpson et al. Reference Simpson, Gueguen and Schneider2003; Faulkner et al. Reference Faulkner, Jackson, Lunn, Schlische, Shipton, Wibberley and Withjack2010), groundwater flow (Gudmundsson et al. Reference Gudmundsson, De Guidi and Scudero2013), hydrocarbon and mineral resources (Aydin, Reference Aydin2000) and CO2 storage (Shipton et al. Reference Shipton, Evans, Kirschner, Kolesar, Williams and Heath2004).
2.c. Analogue modelling
Over the last two centuries, analogue models have provided a powerful tool for the investigation of complex deformation processes and their geometric, kinematic and dynamic aspects (McClay & Ellis, Reference McClay and Ellis1987 b; Huiqui et al. Reference Huiqui, McClay, Powell and McClay1992; Lallemand et al. Reference Lallemand, Lewis, Collot, Neil, Gillespie, Moon and Briggs1994; Schreurs, Reference Schreurs1994; Gutscher et al. Reference Gutscher, Kukowski, Malavieille and Lallemand1996; McClay, Reference McClay, Buchanan and Nieuwland1996; Wang & Davis, Reference Wang and Davis1996; Kukowski et al. Reference Kukowski, Lallemand, Malavieille, Gutscher and Reston2002; Adam et al. Reference Adam, Urai, Wieneke, Oncken, Pfeiffer, Kukowski, Lohrmann, Hoth, van der Zee and Schmatz2005). This method allows the systematic analysis of the formation and evolution of geological structures in space and time, whereas the natural outcrop represents just a single ‘frame’ of the entire process. In scaled models, different boundary conditions and parameters can be tested and quantified, enabling the evaluation of their influence on the overall process.
Furthermore, the development of new technologies constantly improves the deformation monitoring of the experiments, by means of high-resolution imaging techniques. These include strain monitoring with particle image velocimetry (Bitri et al. Reference Bitri, Brun, Chantraine, Guennoc, Marquis, Marthelot, Perrin, Pivot and Truffert1997; White et al. Reference White, Take and Bolton2001; Adam et al. Reference Adam, Lohrmann, Hoth, Kukowski and Oncken2002; Wolf et al. Reference Wolf, König and Triantafyllidis2003), digital image correlation (DIC) (Adam et al. Reference Adam, Urai, Wieneke, Oncken, Pfeiffer, Kukowski, Lohrmann, Hoth, van der Zee and Schmatz2005; Hoth et al. Reference Hoth, Adam, Kukowski and Oncken2006, Reference Hoth, Hoffmann-Rothe and Kukowski2007, Reference Hoth, Kukowski and Oncken2008; Cruz et al. Reference Cruz, Teyssier, Perg, Take and Fayon2008, Reference Cruz, Malinski, Wilson, Take and Hilley2010; Pons & Mourgues, Reference Pons and Mourgues2012; Yamada et al. Reference Yamada, Baba, Miyakawa and Matsuoka2014; Dotare et al. Reference Dotare, Yamada, Adam, Hori and Sakaguchi2016) and integrated digital volume correlation (DVC) and X-ray computed tomography (XRCT) techniques (Adam et al. Reference Adam, Schreurs, Klinkmüller and Wieneke2008, Reference Adam, Klinkmüller, Schreurs and Wieneke2013 b; Zwaan et al. Reference Zwaan, Schreurs and Adam2017).
Nevertheless, scaled analogue models present some limitations that need to be considered when comparing the model with the natural system. These limitations are mainly represented by the boundary conditions acting in natural systems, which cannot be represented easily in laboratory-based experiments, such as pore-fluid pressure, compaction of sediments, and thermal, flexural and isostatic effects.
2.c.1. Scaling
To ensure an appropriate comparison between the analogue models and the natural prototype, laboratory experiments require to be properly scaled with respect to the simulated natural rocks. The scaling theory, first developed by (Hubbert, Reference Hubbert1937), represented a turning point for analogue modelling, evolving from a qualitative to a quantitative method.
The scaling procedure is composed of three hierarchical levels of similarity, namely geometric, kinematic and dynamic similarity. Geometric scaling is ensured by proportional corresponding lengths and equal corresponding angles between model and prototype; a similar sequence of deformation proportional in time is additionally required for kinematic scaling; and dynamic scaling also involves the similarity of proportional applied forces and stresses in the model and natural prototype.
In detail, the dynamic scaling is mainly defined by density, frictional parameters and cohesive strength of prototype and model material. The latter therefore plays a critical role in the investigation method. The model material must show a similar angle of internal friction with respect to the upper crustal rocks, 27–45° (Handin, Reference Handin1966; Jaeger & Cook, Reference Jaeger and Cook1969), and the following equation must be satisfied (Hubbert, Reference Hubbert1937; Ramberg, Reference Ramberg1981):
 $${{{C_{\rm{m}}}} \over {{C_{\rm{n}}}}} = {{{\rho _{\rm{m}}}} \over {{\rho _{\rm{n}}}}}{{{g_{\rm{m}}}} \over {{g_{\rm{n}}}}}{{{L_{\rm{m}}}} \over {{L_{\rm{n}}}}}$$
where C is cohesive strength, ρ is density, g is gravity, L is length and m and n refer to the model and natural prototype, respectively. For experiments run in normal gravity conditions, the ratio gm/gn = 1 and Equation (1) can be rewritten as:
 $${{{L_{\rm{m}}}} \over {{L_{\rm{n}}}}} = {{{C_{\rm{m}}}} \over {{C_{\rm{n}}}}}{{{\rho _{\rm{n}}}} \over {{\rho _{\rm{m}}}}}.\;$$
This length equivalence, determined by cohesive strength and the density of the model material and the natural prototype, is referred to as the geometrical scaling factor, and defines the resolution of the model. The choice of the model material therefore controls the dynamic scaling provided and, consequently, the natural processes scale (Fig. 3).

Fig. 3. Natural examples of geological structures observable at different scales; investigation methods (analogue modelling and mechanical tests) of geological processes at different scales; model resolution, in terms of length ratios model/prototype, provided by different model materials applied in tectonics studies (Table 1), calculated for the limestone of the Lueders Formation (15 MPa of cohesive strength and 2.43 g cm−3 of density; online Supplementary Table S1). Geometric scaling factor L* = L n/L m. Photographs from ATML@RHUL, Google Earth and van Gent et al. (Reference van Gent, Holland, Urai and Loosveld2010).
2.c.2. Analogue materials
The physical and mechanical properties of the analogue materials determine the model resolution, and therefore the deformation scales we can simulate and observe in the experiment. The model material must have similar rheology with respect to the examined prototype and mechanical properties, suitable to be scaled into the target observational scale. Handling and preparation of the experiment samples, as well as their homogeneity and reproducibility, also need to be considered as aspects of primary impact on the model results (Lohrmann et al. Reference Lohrmann, Kukowski, Adam and Oncken2003; Schreurs et al. Reference Schreurs, Buiter, Boutelier, Corti, Costa, Cruden, Daniel, Hoth, Koyi, Kukowski, Lohrman, Ravaglia, Schlische, Withjack, Yamada, Cavozzi, Delventisette, Brady, Hoffman-Rothe, Mengus, Montanari, Nilforoushan, Buiter and Schreurs2006, Reference Schreurs, Buiter, Boutelier, Burberry, Callot, Cavozzi, Cerca, Chen, Cristallini, Cruden, Cruz, Daniel, Da Poian, Garcia, Gomes, Grall, Guillot, Guzmán, Hidayah, Hilley, Klinkmüller, Koyi, Lu, Maillot, Meriaux, Nilfouroushan, Pan, Pillot, Portillo, Rosenau, Schellart, Schlische, Take, Vendeville, Vergnaud, Vettori, Wang, Withjack, Yagupsky and Yamada2016). The wide range of model materials applied to simulate different tectonic processes has been summarized and discussed in different review articles (Koyi, Reference Koyi1997; Ranalli, Reference Ranalli2001; Reber et al. Reference Reber, Cooke and Dooley2020), classifying them as materials used to model (1) the upper crust, (2) the middle crust, and (3) the lower crust and the mantle. These include sand (Davis & Dahlen, Reference Davis and Dahlen1983; McClay & Ellis, Reference McClay, Ellis, Coward, Dewey and Hancock1987 a; Krantz, Reference Krantz1991; McClay, Reference McClay, Buchanan and Nieuwland1996; Gutscher et al. Reference Gutscher, Kukowski, Malavieille and Lallemand1998; McClay et al. Reference McClay, Dooley and Lewis1998; Bonini et al. Reference Bonini, Sokoutis, Mulugeta and Katrivanos2000; Schellart, Reference Schellart2000; Cobbold et al. Reference Cobbold, Durand and Mourgues2001; Lohrmann et al. Reference Lohrmann, Kukowski, Adam and Oncken2003; Panien et al. Reference Panien, Schreurs and Pfiffner2006; Dooley & Schreurs, Reference Dooley and Schreurs2012; Gomes, Reference Gomes2013; Wu et al. Reference Wu, McClay and Frankowicz2015; Dotare et al. Reference Dotare, Yamada, Adam, Hori and Sakaguchi2016; Klinkmüller et al. Reference Klinkmüller, Schreurs, Rosenau and Kemnitz2016; Maestrelli et al. Reference Maestrelli, Bonini, Corti, Del Ventisette, Moratti and Montanari2021; Santolaria et al. Reference Santolaria, Ferrer, Rowan, Snidero, Carrera, Granado, Muñoz, Roca, Schneider, Piña and Zamora2021), gelatine (Corbi et al. Reference Corbi, Funiciello, Moroni, Van Dinther, Mai, Dalguer and Faccenna2013; van Dinther et al. Reference van Dinther, Gerya, Dalguer, Corbi, Funiciello and Mai2013; Brizzi et al. Reference Brizzi, Funiciello, Corbi, Di Giuseppe and Mojoli2016), foam rubber (Rosenau & Oncken, Reference Rosenau and Oncken2009; Rosenau et al. Reference Rosenau, Lohrmann and Oncken2009, Reference Rosenau, Corbi and Dominguez2017), clays (Krantz, Reference Krantz1991; Henza et al. Reference Henza, Withjack and Schlische2010; Gomes, Reference Gomes2013; Bonini et al. Reference Bonini, Basili, Toscani, Burrato, Seno and Valensise2016; Bonanno et al. Reference Bonanno, Bonini, Basili, Toscani and Seno2017; Hatem et al. Reference Hatem, Cooke and Toeneboehn2017), silica powder (Galland et al. Reference Galland, Cobbold, Hallot, de Bremond d’Ars and Delavaud2006; Abdelmalak et al. Reference Abdelmalak, Bulois, Mourgues, Galland, Legland and Gruber2016), hemihydrate powder (Holland et al. Reference Holland, Urai and Martel2006; Panien et al. Reference Panien, Schreurs and Pfiffner2006; van Gent et al. Reference van Gent, Holland, Urai and Loosveld2010; von Hagke et al. Reference von Hagke, Kettermann, Bitsch, Bücken, Weismüller and Urai2019; Poppe et al. Reference Poppe, Holohan, Rudolf, Rosenau, Galland, Delcamp and Kervyn2021), glass microspheres (Schellart, Reference Schellart2000; Rossi & Storti, Reference Rossi and Storti2003; Abdelmalak et al. Reference Abdelmalak, Bulois, Mourgues, Galland, Legland and Gruber2016), corundum (Panien et al. Reference Panien, Schreurs and Pfiffner2006), sugar (Schellart, Reference Schellart2000; Rosenau et al. Reference Rosenau, Lohrmann and Oncken2009) and dry mortar (Gutscher et al. Reference Gutscher, Kukowski, Malavieille and Lallemand1998).
Most studies investigating brittle deformation in upper crustal settings used granular materials, generally defined as cohesion-less frictional-plastic Coulomb materials (Huiqui et al. Reference Huiqui, McClay, Powell and McClay1992; McClay, Reference McClay, Buchanan and Nieuwland1996; Costa & Vendeville, Reference Costa and Vendeville2002). Among granular materials, quartz sand is the most applied, being relatively easy to use for the construction and sectioning of models and for its dynamic scalability. Mechanical tests showed that granular materials, rather than deforming as a Coulomb material with constant frictional properties, have a more complex strain-dependent behaviour (Krantz, Reference Krantz1991; Schellart, Reference Schellart2000; Marcher & Vermeer, Reference Marcher, Vermeer, Vermeer, Herrmann, Luding, Ehlers, Diebels and Ramm2001; Lohrmann et al. Reference Lohrmann, Kukowski, Adam and Oncken2003; Adam et al. Reference Adam, Urai, Wieneke, Oncken, Pfeiffer, Kukowski, Lohrmann, Hoth, van der Zee and Schmatz2005; Panien et al. Reference Panien, Schreurs and Pfiffner2006), characterized by distributed pre-failure deformation, shear localization and strain accumulation in shear zones with reduced shear strength. The nonlinear behaviour of natural rocks in the brittle crust is therefore well simulated by granular materials (Fig. 4), because granular flow and brittle deformation are governed by similar material mechanics (Mandl, Reference Mandl1988; Marone, Reference Marone1998).

Fig. 4. Schematic shear stress (τ) versus angular shear (γ) curves showing the behaviour of (a) an ideal Coulomb material, and the similar nonlinear behaviour of (b) rocks in the brittle upper crust and (c) granular analogue materials (Lohrmann et al. Reference Lohrmann, Kukowski, Adam and Oncken2003).
The model materials used in some analogue modelling studies, with accessible cohesive strength and density values, are summarized in Table 1. The cohesive strength and density values range from 1 to 700 Pa and from 0.8 to 2.04 g cm−3, respectively. We compared the geometric scaling factors of these model materials in the simulation of brittle deformation processes in upper crustal settings. For the length equivalence calculation, we used a limestone of the Lueders Formation as a natural prototype, with a cohesive strength of 15 MPa and density of 2.43 g cm−3 (see online Supplementary Table S1, available at http://journals.cambridge.org/geo).
Table 1. Overview of the studies and materials referred to for dynamic scaling comparison and related values of cohesive strength and density

The resulting geometric scaling factors are shown in Figure 3. It can be noticed that the presented model materials provide model resolution, in terms of geometric scaling factor, ideal for the simulation of crustal- and field-scale structures, but not suitable for the modelling of processes at the outcrop scale. To fill this gap of resolution relevant for fault zone and damage zone observations, the development of new rock-analogue material is therefore needed.
3. GRAM development
The development of a new GRAM capable of simulating fault–fracture processes at the resolution of the outcrop scale can fill the gap in model materials applied in analogue modelling studies. For this purpose, GRAM must be able to form shear and tensile fractures under variable stress conditions. It must therefore be a cohesive granular aggregate, with specifically scaled shear and tensile strength for the successful simulation of coupled fault–fracture processes in scaled analogue experiments. The developed material must maintain the frictional properties and granular flow characteristics of quartz sand with strain-dependent frictional properties, strain hardening and strain softening, dilatancy and shear strength (Krantz, Reference Krantz1991; Schellart, Reference Schellart2000; Lohrmann et al. Reference Lohrmann, Kukowski, Adam and Oncken2003; Panien et al. Reference Panien, Schreurs and Pfiffner2006). The bulk granular material of the GRAM aggregates is therefore dry quartz sand of fine- to medium-sized grains (BL60, Prince Minerals Inc. Group).
In this study, we have tested two approaches of material design with (1) dry cemented granular solids and (2) wet cohesive granular solids. To form cohesive sand aggregates comparable to an ultra-weak artificial sandstone, the sand particles were bonded either with (1) water-based (dry sand aggregates) or (2) fluid-based (wet sand aggregates) adhesive agents. Dry cemented granular solids were created with weak adhesives based on gelatine, hemihydrate and sugar-based components. Wet granular solids were created by flushing and draining sand aggregates with vegetable oil. The systematic variation of the bonding strength of the cemented sand aggregates, or the capillary forces in ‘wet’ sand aggregates, allows the calibration of the shear, compressional and tensile strength of the GRAM material.
The development of the sand aggregates followed a systematic workflow with a step-by-step assessment of the material characteristics. Only the sand aggregates fulfilling the required physical and mechanical properties of the initial qualitative assessment were taken forwards to the next level of material design and mechanical testing.
Finally, for a large-scale test, the best GRAM candidates were tested in a full-scale analogue experiment series in a simple shear strike-slip deformation rig to simulate the localization and growth of a strike-slip fault zone with a simple experiment set-up (see Section 5).
3.a. Material requirements
The material development was based on the following physical and mechanical requirements. GRAM must be capable of (1) forming cohesive aggregates with compositional and mechanical homogeneity on a sample and experiment scale; (2) deforming by shear and tensile failure under variable stress conditions; (3) preserving the frictional properties and granular flow characteristics of quartz sand with nonlinear elastic-plastic frictional behaviour, strain hardening and strain softening, dilatancy and shear strength (Krantz, Reference Krantz1991; Schellart, Reference Schellart2000; Lohrmann et al. Reference Lohrmann, Kukowski, Adam and Oncken2003; Panien et al. Reference Panien, Schreurs and Pfiffner2006; Chemenda et al. Reference Chemenda, Nguyen, Petit and Ambre2011); and (4) providing the required dynamic scaling for the targeted fault–fracture processes resolution.
The aggregates were qualitatively tested in terms of handling and compositional homogeneity as part of the sample preparation procedure. Compositional irregularities can determine unfavourable physical and mechanical heterogeneities or anisotropies throughout the sample, conditioning the deformation during the experiments.
The candidate materials were also evaluated in terms of ease of preparation, sample reproducibility and application in analogue deformation rigs. Advanced studies (Schellart, Reference Schellart2000; Lohrmann et al. Reference Lohrmann, Kukowski, Adam and Oncken2003; Panien et al. Reference Panien, Schreurs and Pfiffner2006; Klinkmüller et al. Reference Klinkmüller, Schreurs, Rosenau and Kemnitz2016; Schreurs et al. Reference Schreurs, Buiter, Boutelier, Burberry, Callot, Cavozzi, Cerca, Chen, Cristallini, Cruden, Cruz, Daniel, Da Poian, Garcia, Gomes, Grall, Guillot, Guzmán, Hidayah, Hilley, Klinkmüller, Koyi, Lu, Maillot, Meriaux, Nilfouroushan, Pan, Pillot, Portillo, Rosenau, Schellart, Schlische, Take, Vendeville, Vergnaud, Vettori, Wang, Withjack, Yagupsky and Yamada2016) proved that the physical properties of the material, such as density, grain shape, pore space and grain size distribution, have an impact on their compaction behaviour and mechanical properties. Evidently, the sample preparation process represents a crucial step of the experiments since the manual procedure can have a direct impact on the properties of the aggregates, such as density and pore space distribution. Additionally, ambient laboratory conditions can influence the chemical reactions and moisture content of the samples. To maximize the accuracy of the sample reproducibility, a standardized sample preparation workflow is therefore required for each model material.
The material capability to deform by shear and tensile failure was evaluated by qualitatively examining the samples in UCTs. Additionally, RSTs enabled a comparison of the deformation behaviour of GRAM aggregates with dry quartz sand and the calculation of the cohesive strength values needed to obtain the dynamic scaling.
3.b. Dynamic scaling
Following the dynamic scaling procedure, the geometrical scaling factor was derived, allowing us to evaluate the experiment resolution provided by the aggregates. The targeted geometrical scaling factor (L* = 104–102) enables the simulation and observation of coupled fault–fracture processes with a model resolution relevant for fault damage zones observed on structural scales (1 cm in the model corresponding to a range of 1–100 m in nature).
According to Equation (2), the geometrical scaling factor is determined by cohesion and density ratios of analogue material and natural prototype. The density of the tested aggregates was determined by weighing different known volumes of the materials samples. As demonstrated for loose sand (Krantz, Reference Krantz1991), the preparation technique has an impact on certain material properties, including density. With granular aggregates, the material density is strongly influenced by the compaction applied during sample preparation. For all the tested aggregates, the samples were prepared by distributing and compacting the material manually to avoid the occurrence of irregularities and voids within the sample.
The cohesion was derived from ring-shear tests with variable loading conditions. Each test cycle was performed with different values of normal load that, along with the related critical shear stresses, define the failure envelope of the material. The obtained stress–strain curves allowed the derivation of the cohesive strength values.
3.c. Tested aggregates
Quartz sand BL60 (physical and chemical characteristics summarized in Table 2) represented the main component of the four potential GRAM aggregates. This dry granular material was systematically tested with the ring-shear tester, defining its frictional properties and providing a baseline for comparison with the four aggregates in examination. The annular ring-shear cell (Fig. 5) was filled with dry quartz sand and sifted at a constant rate from a fixed height to ensure a homogeneous material distribution.
Table 2. Quartz sand BL60 technical data provided by the Prince Minerals Inc. Group, including the material physical specifics, typical chemical analysis and typical particle size distribution (dry sieving BS410 test sieves)

LOI – loss on ignition.

Fig. 5. Mechanical testers used in this study: (a) ring-shear tester sketch (modified after Schulze, Reference Schulze1994) and (b) uniaxial compression tester.
Four types of sand aggregates were tested with different cementing materials: sand–gelatine, sand–sugar, sand–vegetable oil and sand–hemihydrate. The aggregates specifics, including mixing ratios and drying procedure, are summarized in Table 3.
Table 3. Summary of the aggregates tested in this study

Although gelatine, sugar and vegetable oil have not been used in analogue modelling studies to form aggregates with sands, sand–hemihydrate aggregates were previously used by Haug et al. (Reference Haug, Rosenau, Leever and Oncken2014) to simulate fragmentation in rock avalanches.
3.d. Sample preparation
The aggregates were prepared in samples of the different shapes required for mechanical tests. A standardized preparation workflow was defined for each aggregate to ensure their reproducibility and to reduce the impact of ambient conditions and operator handling.
For sand–gelatine, sand–sugar and sand–hemihydrate aggregates, a certain amount of water was added to dissolve the solute, gelatine and sugar or, in the case of hemihydrate powder, to amalgamate with sand. For sand–vegetable oil aggregates, an addition of flour completed the mixture. The sample preparation and the drying-up phases were performed at controlled ambient laboratory conditions.
The drying-up time can have an impact on the material mechanical properties as a result of the variable moisture content of the samples. Sample moisture content was therefore analysed by time-series data of the sample weight in 24-hour intervals to monitor water loss.
For ring-shear tests, the samples were prepared and dried directly in the ring-shear cells (942.48 cm3 volume, 10 cm inner diameter, 20 cm outer diameter and 4 cm height). The cylindrical test samples for uniaxial compression tests were prepared and dried in steel moulds (100 mm height and 50 mm diameter).
Sand–gelatine aggregates were prepared using food gelatine HI 250 Bloom, dissolved in boiling water at a proportion of 1:20. The solution was poured on the sand samples until saturated. Finally, the samples were dried under laboratory conditions for 18 hours.
Sand–sugar aggregates were prepared by immersing the sand cylindrical samples into a solution of sugar and water for variable times (tested from 5 to 30 minutes) sufficient to ensure saturation throughout the sample. The water–sugar solution was also tested with different concentrations of solute, from 10 to 100 g L−1. The drying procedure was evaluated at different conditions and duration, from 8 to 18 hours in the oven and from 5 to 7 days at laboratory conditions.
Sand–vegetable oil samples were prepared by mixing the two components together with the addition of flour (55% of quartz sand, 33% of flour and 12% of vegetable oil). These aggregates did not require the addition of water, so therefore excluded the drying procedure from the sample preparation workflow.
Sand–hemihydrate aggregates were examined at different mixing ratios, with 1%, 2%, 3% and 4% of hemihydrate calcium sulphate powder (CaSO4·½H2O). The samples were prepared by mixing the dry parts first, accurately separating the particle agglomerates and obtaining a homogeneous mixture. The water was gradually added to the mixture (10% of the total weight) under continuous stirring. The samples were air-dried at laboratory conditions for 4–6 days.
3.e. Material mechanical testers
The mechanical properties of the aggregates, including frictional parameters, cohesion, shear and compressive strength, were determined by means of RSTs and UCTs.
The dynamic ring-shear tester (Schulze, Reference Schulze1994), specially designed for powder testing, enables the analysis of shear properties under low normal loads in the range of the stresses observed in scaled analogue experiments (Lohrmann et al. Reference Lohrmann, Kukowski, Adam and Oncken2003). The stress–strain curves of the examined aggregates were analysed under variable normal loads to determine their dynamic frictional parameters, cohesion, shear strength and dilatancy. The shear tester is composed of a stainless-steel ring-shaped cell where the tested material is placed, a lid, two tie rods and a crossbeam (Fig. 5a). Through the lid, fitting on top of the filled cell and counterbalanced by a weight, a normal load is applied to the sample. A horizontal shear force is applied by the cell rotation, occurring at a constant angular velocity, during which the lid is fixed with tie rods and a crossbeam to the strain gouges. The lid is anchored into the sample by means of several steel protrusions, ensuring shear inside the sample itself and avoiding slipping between material and lid. Measurements were performed with different normal loads ranging from 1 to 20 kPa. For each measurement, the stress–strain curve was measured for the undeformed and then deformed material in two successive shear cycles (Lohrmann et al. Reference Lohrmann, Kukowski, Adam and Oncken2003).
A tensional–compressional uniaxial tester (Zwicky 5N, Zwick Roell) was used to analyse the elastic properties and compressive strength of aggregates under uniaxial loading. The tester is composed of a plate where the sample is placed and uniaxially compressed by a vertical load applied by a servo-controlled piston (Fig. 5b). During the test, the cylindrical samples, with a length:diameter ratio of 2, undergo deformation until breaking, allowing the analysis of the failure modes of the materials. The test can be performed either in load-controlled or strain-controlled conditions and the applied force (N) and occurring deformation (%) are measured.
4. GRAM test results
Following the material requirements of GRAM (Section 3.a above), the tested aggregates were examined in a step-by-step workflow, where only the suitable aggregates were further tested at the next stage (Table 4).
Table 4. Requirements checklist of the tested materials

4.a. Sample preparation
During sample preparation, the suitability of sand mixtures was assessed to form cohesive aggregates with compositional homogeneity.
Gelatine-based aggregates were characterized by moisture-dependent properties, considerably increasing in strength over time. The samples showed diffuse deformation under wet conditions, whereas the samples were too strong to be tested by UCT (maximum uniaxial load of the tester: 5000 N) when completely dry (after about 18 hours of drying-up), showing a highly time-dependent cohesion. Due to this complexity in material handling, sand–gelatine aggregates were excluded.
Sand–sugar aggregates were unsuitable to produce homogeneous samples in all the different mixing ratios and drying-up procedures tested. The aggregates developed sugar crusts on the outer part of the sample and maintained loose sand volumes inside. For this reason, sand–sugar aggregates were excluded from the successive tests.
Sand–vegetable oil and sand–hemihydrate aggregates formed cohesive and homogeneous samples, showing no handling issues, and were therefore taken to the next stage of tests. For these two aggregates, the sample preparation workflows were defined including mixing procedures, ratios and drying time.
4.b. Uniaxial compression tests
The capability of the aggregates to simultaneously deform by shear and tensile failure was qualitatively analysed by means of a tensional–compressional uniaxial tester. From the quantitative point of view, the UCT series allowed the elastic properties and compressive strength parameters of the materials to be determined.
At this stage, only sand–vegetable oil and sand–hemihydrate aggregates were tested. The compressive strength, calculated for each specimen as the normal load (N) per unit area at failure, showed higher values for sand–hemihydrate aggregates than for sand–vegetable oil samples (Fig. 6a). The latter exhibited a more diffused deformation with higher deformation rates, as shown by the UCT normal load/strain curves (Fig. 6b).

Fig. 6. Uniaxial compression test results for sand–hemihydrate and sand–vegetable oil samples: (a) compressive strength derived from the tests and (b, c) normal load (N) versus strain (%) curves.
At failure, sand–vegetable oil aggregates mainly deformed by distributed shear fractures (Fig. 7), usually developing a single shear fracture. On the other hand, sand–hemihydrate aggregates localized the deformation by shear and tensile failure (Fig. 7), developing patterns of early micro-cracks linking together in macro-fractures by coalescence with increasing loading stresses. The specimens usually showed multiple fracture planes, with the main fractures spanning through the whole sample. As a result of this qualitative test, sand–vegetable oil aggregate was considered unsuitable for this study purposes. This material was tested in RST series for comparison purposes only.
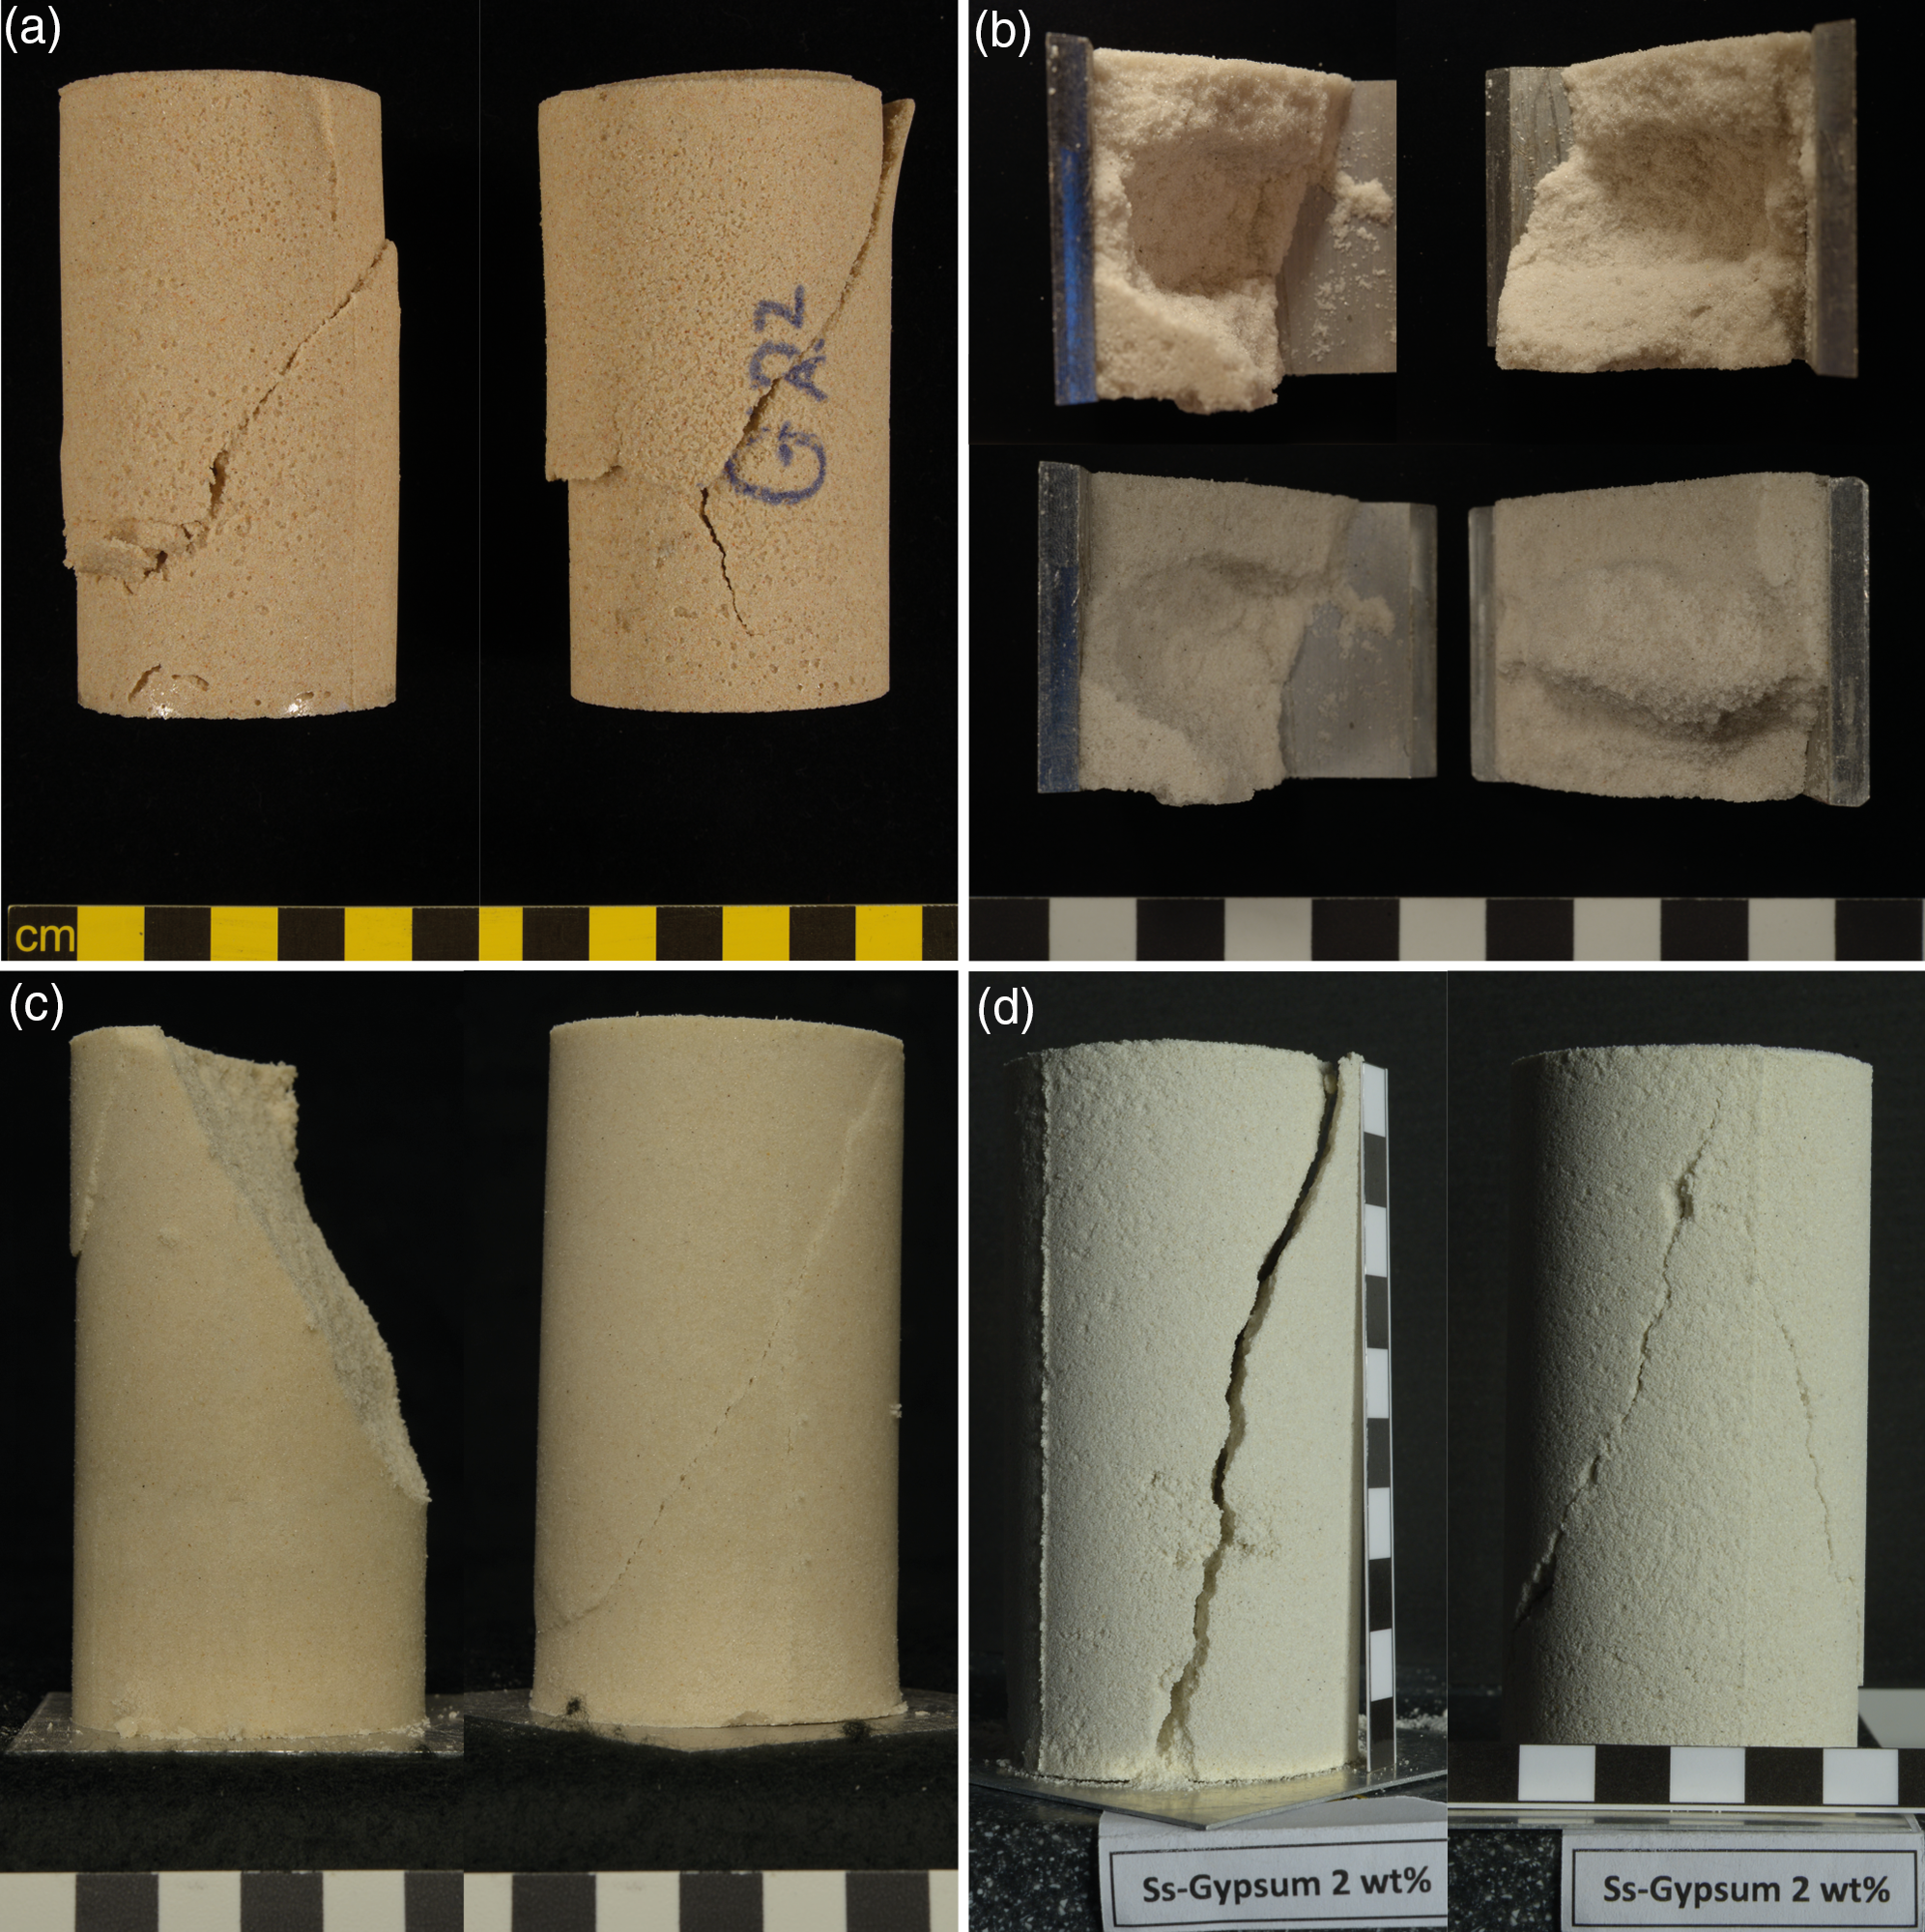
Fig. 7. Samples after uniaxial compression tests: (a) sand–gelatine; (b) sand–sugar; (c) sand–vegetable oil; and (d) sand–hemihydrate.
4.c. Ring-shear tests
In order to evaluate the strain-dependent deformation behaviour and frictional parameters of the GRAM aggregates, the samples were tested with the ring-shear tester and compared with the baseline stress–strain curves of BL60 dry quartz sand.
Ring-shear tests were performed for sand–hemihydrate and sand–vegetable oil aggregates. In the comparison of the stress–strain curves (Fig. 8), the nonlinear elastic–plastic frictional behaviour, with strain hardening and strain softening, was observed in both tested aggregates, preserving this granular materials characteristic. Quantitatively, sand–hemihydrate aggregates showed higher shear strength (peak, static and dynamic) and strain softening than sand–vegetable oil and loose sand samples. Sand and sand–vegetable oil samples showed very similar peak strength values. In detail, the shear stresses required for shear failure in sand–hemihydrate aggregates at a normal stress of 10 kPa was about 14% and 18% higher than loose sand and sand–vegetable oil aggregates, respectively.

Fig. 8. Ring-shear test diagrams (shear stress versus time) for sand–hemihydrate, sand–vegetable oil samples and quartz sand BL60.
Cohesion values for each tested material were extrapolated by plotting the critical shear and normal stresses in a Mohr diagram (Fig. 9). The best-fit linear failure envelopes were calculated. The obtained parameters, including cohesion, coefficient and angle of internal friction, are summarized in Table 5.

Fig. 9. Mohr diagram showing the shear stress as a function of the normal stress for quartz sand BL60, sand–vegetable oil aggregates and sand–hemihydrate aggregates.
Table 5. Summary table of cohesion (Pa), angle of internal friction ϕ (°) and coefficient of internal friction μ (dimensionless) obtained after ring-shear tests for loose sand ‘BL60’, sand-vegetable oil aggregates and sand-hemihydrate aggregates. The error is the standard deviation of the mean values after multiple measurements (4 cycles of 5 tests each)

4.d. Dynamic scaling
As mentioned above (Section 2.c.1), for a dynamically scaled model the analogue material must have rheology and angle of internal friction similar to the natural prototype. Following RSTs, sand–vegetable oil and sand–hemihydrate samples yielded values for the angle of internal friction of 33 and 37°, respectively (Table 5). Additionally, to calculate the geometric scaling factor that the material can provide in scaled experiments, density and cohesion parameters of model material and natural rocks are needed. The dynamic scaling parameters are summarized in Table 6.
Table 6. Dynamic scaling parameters calculated for sand BL60, sand–vegetable oil and sand–hemihydrate aggregates. Model resolution (L n) corresponding to 0.01 m in the model (L m)

Sand–vegetable oil aggregates showed cohesion values of 291 Pa, whereas sand–hemihydrate aggregates had cohesion values one order of magnitude higher, namely 7883 Pa.
The density of sand–vegetable oil aggregates was calculated by weighing the RST samples with known cell volume and weight, providing values of 1.52 g cm−3. In the case of sand–hemihydrate samples, the drying stage and the related samples moisture content made the density values more uncertain. To obtain a better estimation of the sand–hemihydrate density, it was calculated by weighing different sample volumes including the samples prepared for the strike-slip experiments and for the mechanical tests, namely the cylindrical specimens for uniaxial compression tests and the two cells used for ring-shear tests. The slope of the linear regression line provided the best estimate of density of 1.36 g cm−3 (Fig. 10).

Fig. 10. Plots of mass versus volume for sand–hemihydrate model material.
From the obtained cohesion and density values, the geometric scaling factor has been calculated by using Equation (2) and reference natural rocks with known cohesion and density values (Lueders Formation limestone used for comparison; Fig. 3; 15 MPa and 2.43 g cm−3). The length equivalence for sand–vegetable oil and sand–hemihydrate was 1 cm in the model corresponding to 322.43 and 10.65 m in nature, respectively. Only the dynamic scaling provided by sand–hemihydrate aggregates therefore fitted the outcrop scale, enabling an ideal model resolution to simulate fault and fracture processes at the structural scale. By comparison with the model materials used in analogue modelling studies (Fig. 3), the developed sand–hemihydrate material filled the gap of resolution corresponding to the outcrop scale.
5. GRAM strike-slip experiment
In Sections 3 and 4 we developed a GRAM prototype with required mechanical and physical properties for the simulation of coupled fault–fracture processes in scaled experiments, and have tested its sample-scale preparation and mechanical properties. The next step is to demonstrate the application of GRAM in scaled experiments simulating the localization and growth of coupled fault–fracture processes. For this purpose, the material was prepared in large volumes and applied in strike-slip experiments.
The strike-slip setting was chosen for its simple set-up and ideal orientation for strain analysis, with the shear zone evolution being observable in map view on the sample surface by stereo DIC techniques. This type of experiment, usually referred to as the Riedel experiment, simulates the deformation in an overburden lying on a straight and vertical basement fault (Cloos, Reference Cloos1928; Riedel, Reference Riedel1929) and has been performed with a large variety of model materials (Dooley & Schreurs, Reference Dooley and Schreurs2012).
The experiments were monitored by 3D stereo DIC techniques, which enabled the high-resolution monitoring of the 3D surface displacement and deformation of the experiment surface for the fully quantitative analysis of dynamic fracture localization and crack propagation in the experiment.
The experiment series confirmed that GRAM aggregates can be prepared and handled in large experiment volumes. Furthermore, the structural-scale fracture processes and fault localization observed in the experiments presented the characteristic elements of large-scale fault localization and early fault zones evolution. Finally, DIC analysis provided insights into the dynamic evolution of a fault damage zone at the relevant structural scale.
5.a. Experiment set-up
The experiments were performed with a 100-cm-long, 60-cm-wide and 12-cm-high strike-slip rig (Fig. 11). The apparatus simulated the shear deformation in a horizontal material layer overlying a straight strike-slip fault. The base of the rig consisted of two mobile metal baseplates with a linear central interface representing a single planar and vertical basement fault. The baseplates were able to translate independently parallel to the strike direction of the central velocity discontinuity, that is, the fault interface. The 12-cm-high rig walls were in place during the sample preparation and confined the model during deformation. The displacement was manually applied to the baseplates by a hydraulic winch attached to the rig because the application of standard electric stepper motors used in dry sand shear experiments was prevented by the high strength of the GRAM. The deformation was applied by moving one of the two baseplates with a shear sense arbitrarily chosen to be dextral. The basal interface consisted of two separate 1-mm-thick metal baseplates, each of which was covered with a glued-on rubber sheet, forming a high-friction basal interface with the sample aimed at minimizing slippage on the rig base.
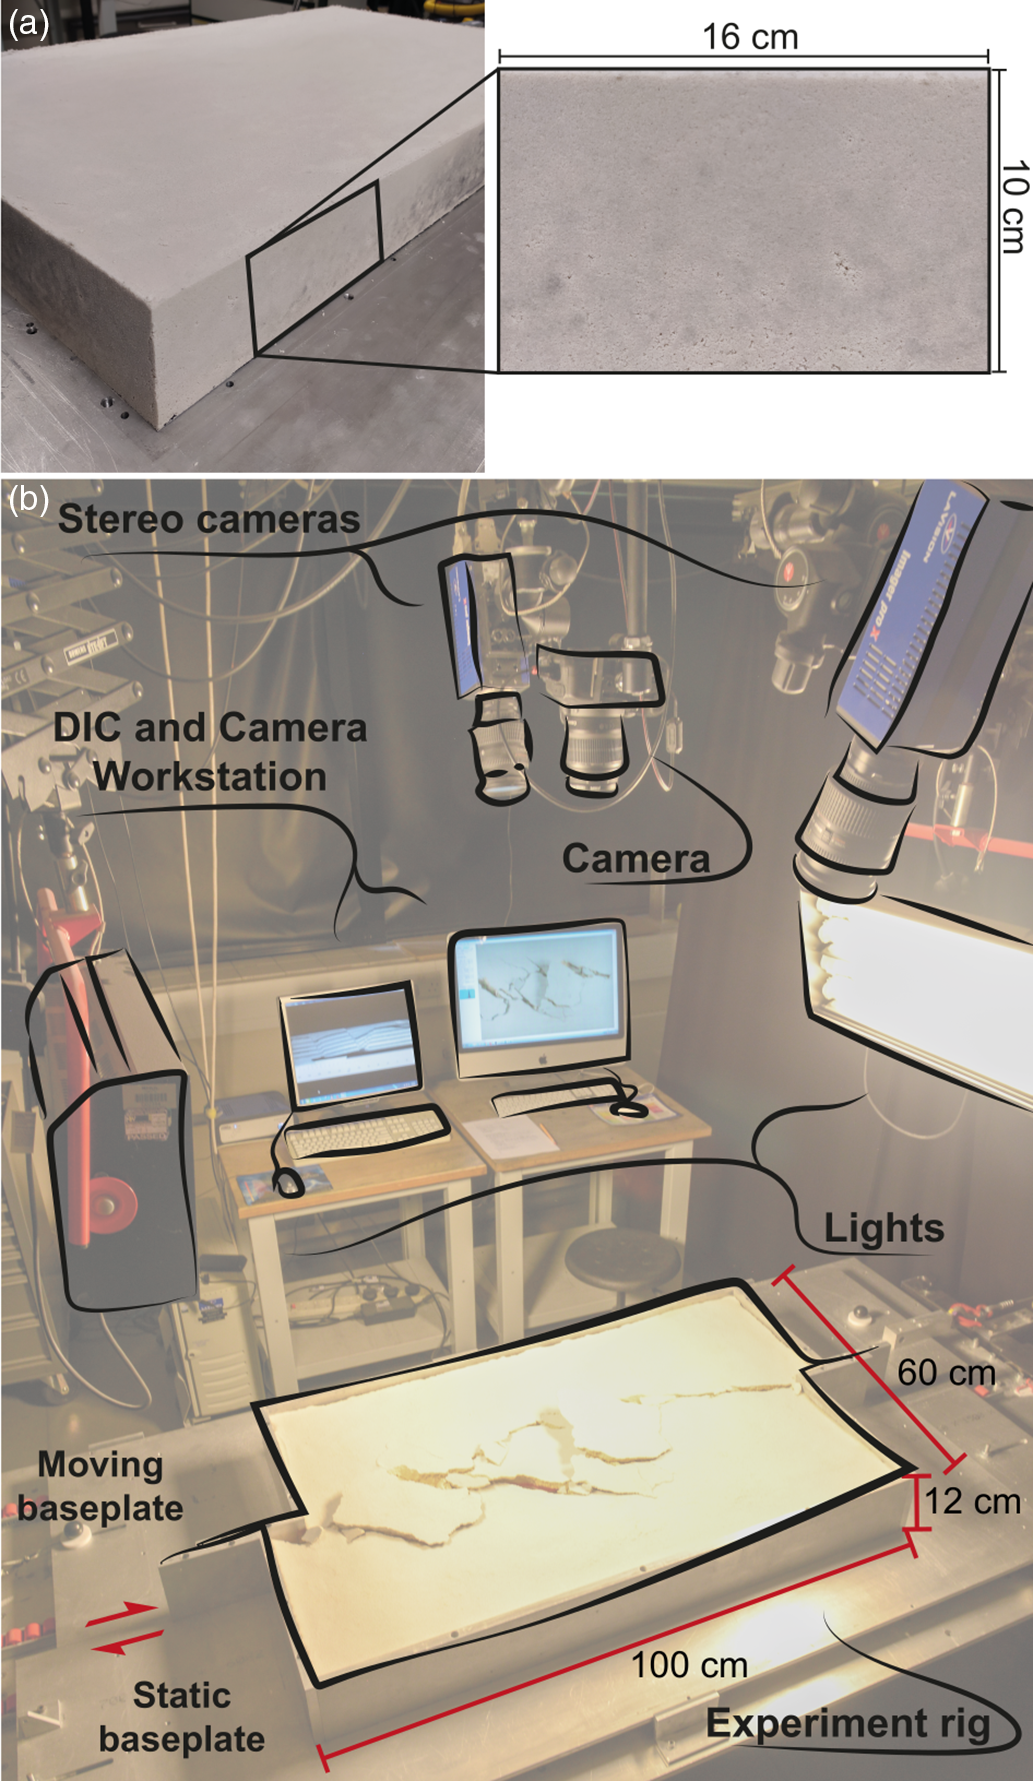
Fig. 11. Experimental set-up with 3D optical strain monitoring. (a) 100 × 60 × 10 cm sample with the rig walls removed to enhance the drying procedure. The sample shows a suitable level of homogeneity. (b) Laboratory set-up with stereoscopic CCD cameras and DIC set-up, with schematic representation of the strike-slip rig.
A total of nine strike-slip experiments were performed with the sand–hemihydrate GRAM (see online Supplementary Table S2, available at http://journals.cambridge.org/geo). The new GRAM was prepared for an initial set of experiments in smaller volumes (40 × 30 × 10 cm) and adjusted for the later set of experiments in significantly larger volumes (100 × 60 × 10 cm) to minimize the impact of edge effects of the experiment set-up on the fault damage zone evolution. GRAM at 3% wt of hemihydrate was applied in the first three experiments, whereas GRAM at 2% wt was applied in the successive six experiments (see online Supplementary Table S2). The first pilot experiments allowed the evaluation of various sample preparation issues, such as the drying-up of large material volumes, their handling and the experiment set-up specifics.
In the smaller experiments (1–4), the influence of significant boundary conditions as a result of the relatively small sample dimensions was highlighted. Fractures initiated at the velocity discontinuity of the sample–rig walls and propagated to the central sample area, therefore influencing the damage zone localization and evolution (Fig. 12a). This edge effect was limited by increasing the sample dimensions to 100 × 60 × 10 cm, enabling the shear zone to localize and develop in the model without being impacted by the ‘boundary effect’ fractures (Fig. 12b).

Fig. 12. Boundary effect of the rig walls on the samples with dimensions of (a) 40 × 30 × 10 cm and (b) 100 × 60 × 10 cm. BF – boundary effect fracture.
The material volumes were prepared following the sample preparation workflow defined for the mechanical tests (Section 3.d above). For the 40 × 30 × 10 cm samples c. 18 kg of dry materials were used, whereas the 100 × 60 × 10 cm samples required c. 80 kg. The smaller experiment volumes were prepared and dried in a wooden box with detachable walls and subsequently transferred to the rig for the experiment. The larger experiment volumes were prepared and dried directly on the rig, reducing the risks of damaging the large sample during its relocation after the preparation and drying procedures. For the larger material volumes, the three components (sand, hemihydrate and water) were mixed in a concrete mixer. The mixture was transferred to the rig, accurately distributing the material by hands. Once all the material was in place within the rig walls, a wooden plate was positioned on top of the sample with weights (c. 100 kg) for c. 1 hour, ensuring material compaction. The sample height was 2 cm less than the rig walls to accommodate the compaction plate during the sample preparation. With this procedure, no voids or irregularities were observed throughout the samples, enabling a suitable level of material homogeneity (Fig. 11a).
The experiment series was performed with the described strike-slip rig set-up. As a representative experiment, GRAM test-7 was analysed and discussed in the following. The total shear displacement applied was 7 cm with an experiment duration of 17 minutes, resulting in an average slip rate of 4.12 mm min−1.
The scaling factors of the experiment GRAM test-7 are summarized in Table 7, referring to the same prototype used for comparison (Fig. 3), namely the Lueders Limestone Formation (see online Supplementary Table S1). The length equivalence was 1 cm in the model corresponding to 10.65 m in the natural prototype.
Table 7. Dynamic scaling properties of the GRAM strike-slip experiments. Natural prototypes displacement rates from Mouslopoulou et al. (Reference Mouslopoulou, Walsh and Nicol2009)

5.b. Experiment monitoring
Digital Image Correlation (DIC) analysis techniques were applied for high-resolution strain monitoring in the GRAM strike-slip experiments (Adam et al. Reference Adam, Lohrmann, Hoth, Kukowski and Oncken2002, Reference Adam, Urai, Wieneke, Oncken, Pfeiffer, Kukowski, Lohrmann, Hoth, van der Zee and Schmatz2005, Reference Adam, Klinkmüller, Schreurrs and Wieneke2013 a; Krézsek et al. Reference Krézsek, Adam, Grujic, Jolley, Barr, Walsh and Knipe2007; Dotare et al. Reference Dotare, Yamada, Adam, Hori and Sakaguchi2016). DIC analysis enables the full-field measurements of heterogeneous displacement, strain and porosity changes, as well as the monitoring of localized and diffuse deformation processes in the model from the large experiment scale to the particle scale with sub-millimetre accuracy (White et al. Reference White, Take and Bolton2003; Adam et al. Reference Adam, Urai, Wieneke, Oncken, Pfeiffer, Kukowski, Lohrmann, Hoth, van der Zee and Schmatz2005; Viggiani & Hall, Reference Viggiani, Hall, Burns, Mayne and Santamarina2008). For the acquisition and analysis of sequential stereo images, we used the digital image correlation and deformation analysis software (Strain Master, LaVision) adapted for scaled analogue experiments. The monitoring equipment consisted of two high-resolution charge-coupled device (CCD) cameras in stereoscopic set-up above the experiment (Fig. 11b). From the ortho-corrected stereo images, the 3D experiment surface was calculated by means of a mathematical mapping function derived from 3D volume correlation and correction. For this purpose, a calibration plate with equidistant cross marks was placed on the entire sample surface; stereo images recorded the different positions of the calibration plate and allowed the derivation of the mapping function from the ortho-corrected calibration plate images. The volume correlation enabled the accurate 3D mapping of the experiment surface during deformation, and the subsequent calculation of the 3D incremental displacement vector field from successive time-series images, by digital image correlation. Finally, from the 3D displacement field, additional surface deformation displacement and strain components were calculated.
5.c. Experiment results
Here we show the results of GRAM test-7 experiment (parameters summarized in Table 8). The displacement and strain components, computed from the incremental DIC displacement field data of the experiment surface, enabled the kinematic and dynamic analysis of the shear zone evolution. These include the displacement field (mm), the shear strain ϵ xy (%) and the vertical displacement (mm) derived from the incremental 3D displacement vector data (see online Supplementary Videos V1–V4, available at http://journals.cambridge.org/geo). These attributes were calculated incrementally for each time step (Δt = 1 s). Incremental displacement, shear strain and the z-displacement representing active deformation between subsequent time-series stereo images and derived displacement, shear strain and z-displacement rates are shown at six experimental stages, along with ortho-corrected surface images and the structural maps of the interpreted structures (Fig. 13). In the colour maps of incremental vector length (Fig. 13c–e), linear and sharp colour contrasts represent fracture localization and localized displacement of shear fractures. In the incremental DIC displacement field data (Fig. 13c–e), the fault localization is usually revealed before it can be observed in the raw images (Fig. 13a).
Table 8. Specifics of GRAM test-7 strike-slip experiment


Fig. 13. DIC time-series images of sand–hemihydrate 2% sample surface during GRAM test-7 experiment: (a) image source data; (b) structural map; (c) displacement field (mm) with vector displacement; (d) shear strain ϵ xy (%) with vectors displacement; and (e) z-displacement (mm) with vector displacement. R – Riedel shear; Rʼ – Rʼ shear; Y – Y shear; T – thrust fault.
With this experiment set-up, only one of the two baseplates was translated with the static block of the sample (top part of map view in Fig. 13) mostly showing lower displacement and strain rate values.
The experiment showed the formation of a strike-slip shear zone from early localization of the first synthetic Riedel shears (R shears), striking c. 22° clockwise with respect to the trace of the basement fault, to their complete linkage into a continuous and anastomosing primary deformation zone (PDZ). The final damage zone developed asymmetrical to the basement fault as a result of the set-up consisting of a static and a moving baseplate. The total displacement applied to the rig was c. 7 cm, corresponding to c. 74.55 m in nature.
Mainly R and Y shears developed during the experiment, with only three Rʼ shears clearly observed and characterized by limited activity; no P shears were identified. The Y shears in the lower part of the model (corresponding to the moving baseplate) localized as individual shears first and then linked to the earlier R shears. In the upper part of the model (corresponding to the static baseplate), the Y shears formed as part of the early R shears, and propagated towards the outer zones of the PDZ at lower angles. Tens of tensile fractures formed, mainly in the overlap areas between the main R shears or due to block uplift, rotation and failure. The open fractures and areas of local extension mainly corresponded to the right-lateral bends and step-overs of the fault traces.
In the final stages of deformation (30–40 mm displacement), active displacement was mainly accommodated by a single through-going strike-slip fault. At the same time, the intense early segmentation in the damage zone created small, 2–5-cm-long, discrete blocks or shear lenses, which underwent rotation and uplift obliterating the surrounding fault traces. Consequently, from this stage onwards no further new structures developed in the PDZ and, for this reason, we analyse the model evolution up to the 40-mm-displacement stage (Fig. 13).
In the six deformation stages shown in Figure 13c, the maximum displacement rate of observed shear fractures ranged from 0.11 to 1.4 mm s−1. The highest rate was reached once the PDZ was completely interconnected, and all the displacement was accommodated by a through-going strike-slip fault.
The shear strain maps (Fig. 13d) show the shear sense of the different faults and fractures. The incremental shear strain (%) increases from the initial to the final stages, spanning ±0.85%, with the positive strain values (warm colours) indicating dextral shear sense and the negative values (cold colours) indicating sinistral shear sense (Fig. 13d). In general, the shear strain observed during the experiment is mostly dextral as the imposed rig sense of shear. Only a limited antithetic shear deformation was observed, with low or negligible negative values developed, and only three Rʼ shears were observed.
The maps of incremental z-displacement visualize the vertical movements of fault blocks, including local pop-up structures, subsidence areas and thrust faults (Fig. 13e). The z-displacement rates (mm s−1) of individual fault blocks is variable and ranges from −0.15 to 0.28 mm s−1, with the positive values (warm colours) indicating uplift and the negative values (cold colours) indicating subsidence. In the first three experiment stages, the z-displacement rate is more distributed and mainly accumulated along fault traces, especially in the central area between early Riedel shears. In later stages, vertical displacement describes smaller discrete blocks undergoing uplift, rotation and, in only a few areas, local subsidence due to block fragmentation. The z-displacement also highlighted the occurrence of compressive areas, usually related to the left-lateral bends of the fault traces, additionally characterized by a strike-slip component.
In general, dextral strike-slip component was predominant over the reverse dip–slip movement. The maximum damage zone width for each displacement step shown in Figure 13 was, progressively, 0.93, 1.34, 1.35, 1.58, 1.62 and 1.68 cm, with a final damage zone width spanning, along strike, 0.75–1.68 cm, corresponding a fault damage zone width ranging over 8–17.89 m in nature.
6. Discussion
The sand–hemihydrate GRAM aggregate enables the simulation of multi-scale fault–fracture processes in scaled physical experiments. The material is suitable for forming cohesive aggregates capable of deforming by shear and tensile failure while preserving the nonlinear behaviour of granular materials. The dynamic scaling provided by GRAM material enables the simulation of fault damage zones at the structural scale, with 1 cm in the model corresponding to 10.65 m in nature.
The material was applied in a strike-slip experiment series to evaluate its applicability in scaled analogue experiments. The experiment GRAM test-7 described in Section 5.c above demonstrated the characteristic geometries, kinematics and dynamics of fracture nucleation and damage zone evolution leading to an interconnected shear zone, that is, a primary deformation zone (PDZ).
The observed geometries are representative of a strike-slip shear zone and can be directly compared with natural systems. The models developed with GRAM represent relatively low-strain fault systems, similar to the fault systems developed by earthquake surface ruptures. In Figure 14, we compare the GRAM test-7 model with an example of low-strain shear zone (c. 3.5 m displacement), dextral strike-slip earthquake event, the Greendale Fault, New Zealand (Quigley et al. Reference Quigley, Dissen, Villamor, Litchfield, Barrell, Furlong, Stahl, Duffy, Bilderback, Noble, Townsend, Begg, Jongens, Ries, Claridge, Klahn, Mackenzie, Smith, Hornblow, Nicol, Cox, Langridge and Pedley2010). In this case, we used this natural example to validate the models but did not specifically scale the experiment dynamically to the surficial alluvial sediments affected by the earthquake event shown in Figure 14. The structural features of the two shear zones show high similarity to the main structures represented by Riedel shears and the smaller conjugate shear fractures (Rʼ) as minor structures. In the model, the R shears developed at c. 22° clockwise with respect to the trace of the basement fault and formed an angle of c. 75° with the Rʼ shears (Fig. 14b). In the natural system, the R shears formed at c. 26° from the plane of the imposed shear and are at c. 56° to the conjugate Rʼ shears (Fig. 14d). The level of deformation is higher in the model with respect to the prototype, where the R shears are not directly linked and the Y shears are only incipient. As a result, in contrast to the model (Fig. 14a, b), the shear zone is not yet completely interconnected (Fig. 14c, d). P shears are not observed in the model and in the prototype, confirming, in both cases, the relatively low-strain level of the shear zones.
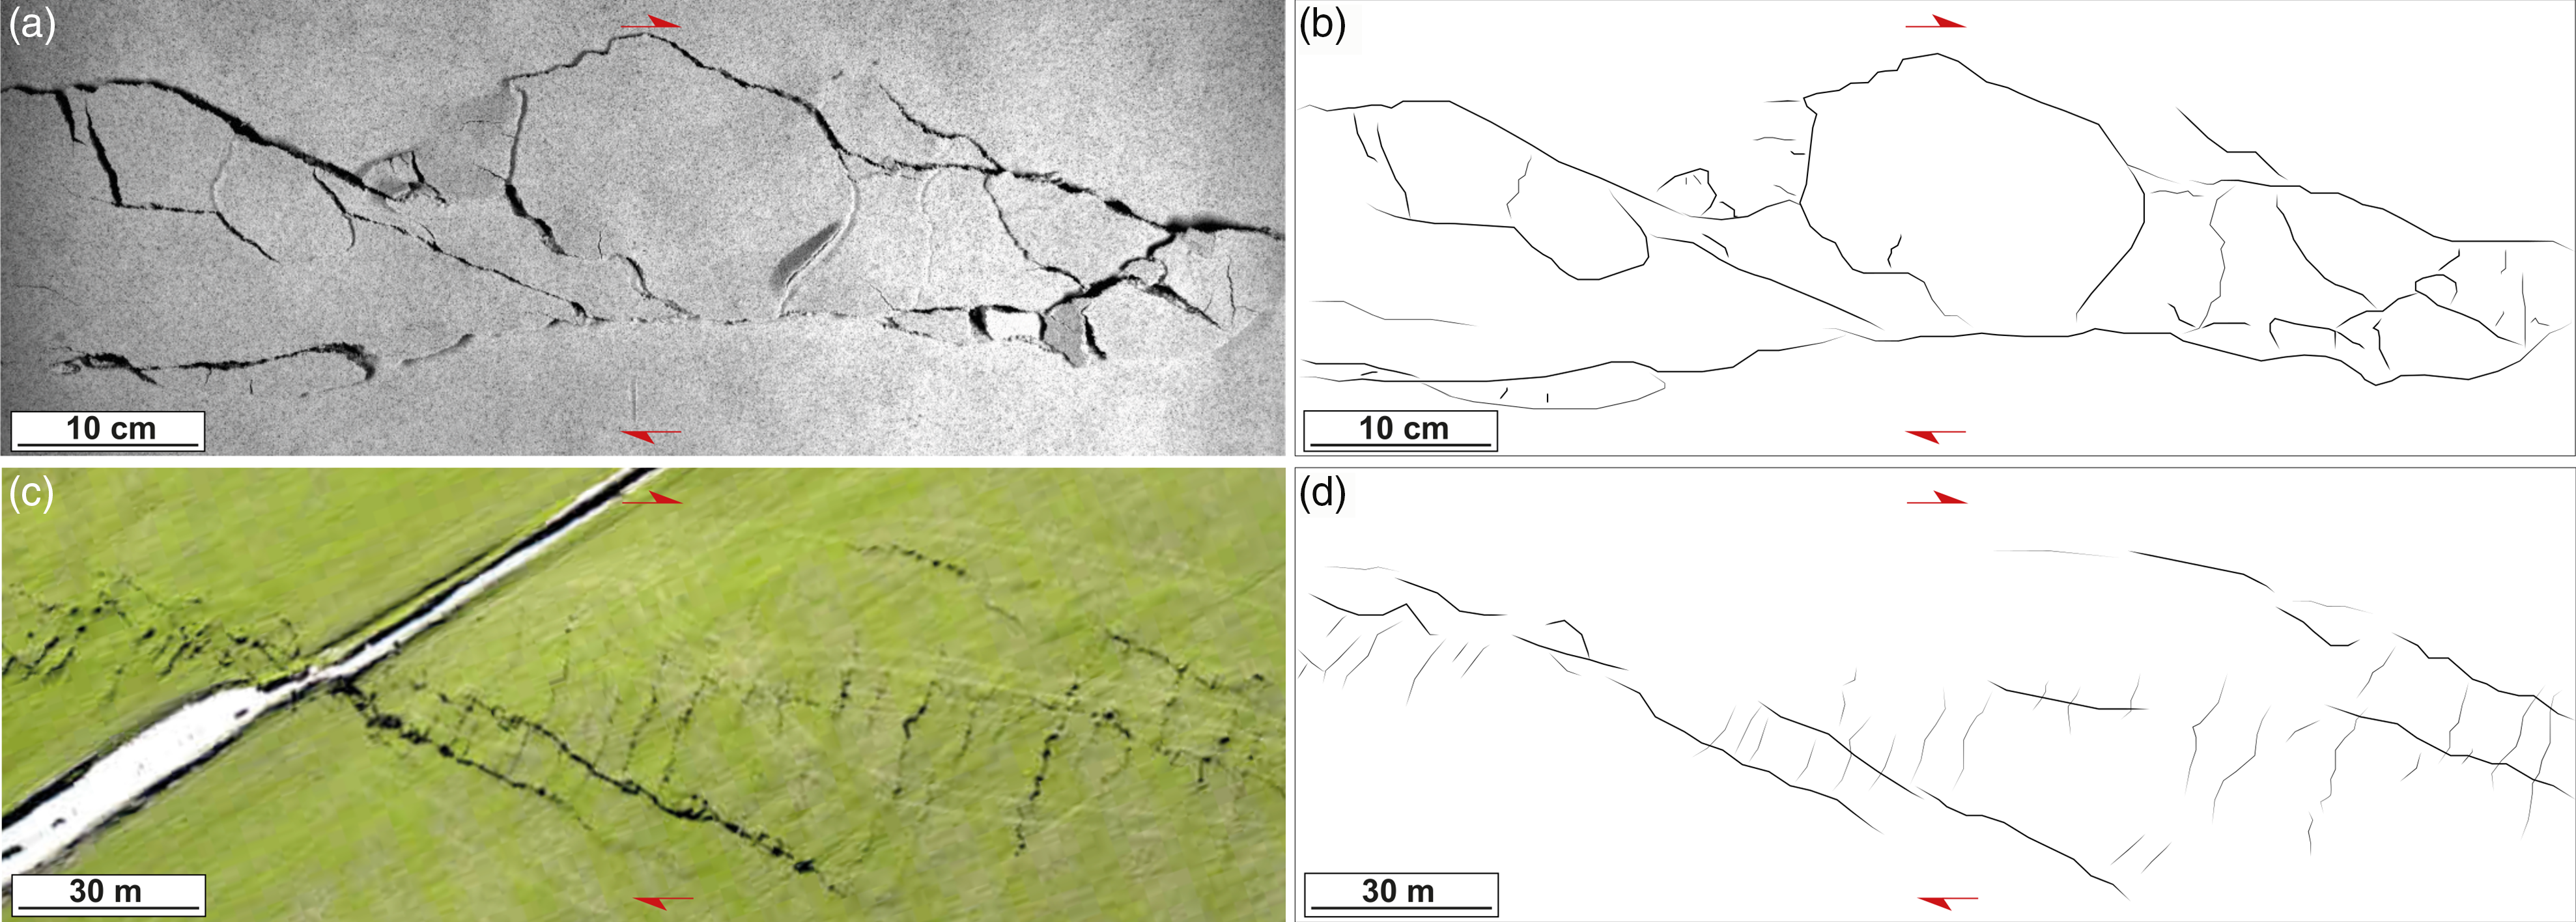
Fig. 14. Model comparison with natural strike-slip shear zone (Greendale Fault surface rupture, New Zealand; Quigley et al. Reference Quigley, Dissen, Villamor, Litchfield, Barrell, Furlong, Stahl, Duffy, Bilderback, Noble, Townsend, Begg, Jongens, Ries, Claridge, Klahn, Mackenzie, Smith, Hornblow, Nicol, Cox, Langridge and Pedley2010). (a) GRAM test-7 experiment surface with (b) structural map of the developed structures and (c) aerial photograph of the Greendale Fault surface rupture, New Zealand (aerial photograph from Quigley et al. Reference Quigley, Dissen, Villamor, Litchfield, Barrell, Furlong, Stahl, Duffy, Bilderback, Noble, Townsend, Begg, Jongens, Ries, Claridge, Klahn, Mackenzie, Smith, Hornblow, Nicol, Cox, Langridge and Pedley2010), with (d) structural map of the developed structures.
Overall, the experimental results demonstrated that the sand–hemihydrate GRAM can be applied in scaled experiments for the simulation of fault–fracture processes in fault damage zones observable at outcrop-scale resolution. Consequently, our GRAM experiments can be directly compared with natural fault systems.
6.a. Sand–hemihydrate challenges and limitations
As derived from systematic material testing, sand-hemihydrate aggregates fulfilled all the GRAM requirements for fault–fracture simulation (Section 4). The sand–hemihydrate aggregates were further examined in terms of physical and mechanical properties, with the sample preparation procedure including sample homogeneity and properties of diverse mixing ratios. We also evaluated the experiment set-up, deformation rig features, and experiment volume preparation and dimensions to outline potential improvements and limitations.
6.a.1. Physical and mechanical properties
As part of the sample preparation with consistent mechanical parameters, the impact of the residual water content on the material properties was analysed in detail. Uniaxial compression test results highlighted the clear influence of the drying duration on the mechanical properties of the material. The compressive strength showed a linear relationship with drying time (Fig. 15a).

Fig. 15. (a) Compressive strength variation trend with different drying time; (b) percentage of water evaporation with respect to the initial amount in weight, monitored through time during the drying stage and (c) compressive strength values for different concentrations of hemihydrate in sand–hemihydrate aggregates, after uniaxial compression tests.
Consequently, samples with different physical and mechanical characteristics are obtained with a longer/shorter drying time or with different ambient conditions. This aspect critically influences the reproducibility of GRAM properties in different experiments. To tackle this problem, during the drying stage the moisture content of the samples was analysed by time-series data of the sample weight at 24-hour intervals to monitor the water loss through time. The rate of water loss of the samples (at controlled laboratory ambient temperature conditions of 23 ± 4°C and 33 ± 6% humidity) stabilized within 5 days, with a decrease of the initial amount of water in weight by 80–90% (Fig. 15b).
The percentage of water loss seemed to be a more accurate parameter to determine the completion of the drying process, rather than defining a fixed time, since the process is strongly influenced by the environmental humidity and temperature conditions in the laboratory. The oven-drying procedure was precluded because the volume dimension (100 × 60 × 10 cm) hinders the transport of the sample from the oven and to the rig without risk of damage. Oven-drying was therefore not applied to smaller samples (i.e. for UCT and RST) since the condition was not replicable for the experiments samples. Consequently, we established that the sand–hemihydrate samples were defined ready, either for mechanical tests or analogue experiments, once the water loss reached 80–90%.
The material compaction applied during the sample preparation is important for the homogeneity of samples (Fig. 11a). Nevertheless, its impact on the density of GRAM experiment volumes should be further evaluated in future. The linear interpolation of mass/volume ratios (Fig. 10) suggests a slight increase in density by reducing the volume of the samples. This bias is the result of the difficulty of directly weighing the 100 × 60 × 10 cm samples, for which the mass (g) was estimated from the sample preparation materials before mixing them, slightly underestimating it. Although the resulting overestimation of density was relatively minor (1.38 g cm−3 instead of 1.36 g cm−3), the density used to calculate the dynamic scaling was obtained considering only the mechanical test samples (UCT, RST Cell 2 and RST Cell 1 + 2).
Furthermore, the effect of the ratio of the sand–hemihydrate mixture on mechanical properties was analysed by testing samples with a range of mixing ratios. Sand–hemihydrate aggregates with 1% to 4% of hemihydrate (on the total dry parts weight) were tested.
Uniaxial compression test results (Table 9) showed no significant variation of Young’s modulus between the different mixing ratios, with average values ranging from 2.09 to 2.99 MPa. A linear trend was observed for the values of maximum normal load applied during the test (F max) and the normal load registered at the first break of the sample (F break). The compressive strength showed a linear relationship with the hemihydrate concentration (Fig. 15c).
Table 9. Uniaxial compression test results for sand–hemihydrate samples at different mixing ratios: 1%, 2%, 3% and 4%. The error is the standard deviation of the mean values after multiple measurements (a total of 53 samples were tested).

It is reasonable to assume that such a relationship is similarly observed for the material cohesive strength (Haug et al. Reference Haug, Rosenau, Leever and Oncken2014). This aspect should be further investigated in future studies. The observed linear relationships between the mixing ratio and GRAM strength enables the adjustment of GRAM mechanical properties and GRAM scaling for specific experiment applications and resolutions.
6.a.1.1. Dynamic scaling
The dynamic scaling of GRAM (Section 4.d) provides a geometric scaling factor L* of 9.39 × 10⁻⁴ (1 cm in the model corresponding to 10.65 m in nature). The geometric scaling factor was calculated considering an arbitrary natural prototype with a cohesive strength of 15 MPa and 2.43 g cm−3 of density, corresponding to the limestone of the Lueders Fomation (see online Supplementary Table S1). To analyse the role of different lithologies on the model resolution, we calculated the dynamic scaling of GRAM with respect to a sandstone (Tennessee Formation), a marble and a granite (see online Supplementary Table S1). The resulting geometrical scaling factors (Table 10) showed that with the sandstone, the marble and the granite as a prototype rock the deduced model resolution would be appropriate for simulating fault damage zone processes observed at the outcrop scale (1 cm in the model corresponding to 36.40, 69.26 and 20.18 m, respectively; Fig. 16).
Table 10. Dynamic scaling provided by GRAM with different natural prototypes (from online Supplementary Table S1, available at http://journals.cambridge.org/geo)


Fig. 16. Comparison chart of the model resolution, in terms of geometric scaling factor, provided by quartz sand BL60, sand–vegetable oil aggregates and the developed sand–hemihydrate GRAM. The dynamic scaling was calculated considering different prototypes, namely, sandstone, marble and granite (see online Supplementary Table S2).
6.a.2. Experiment set-up
Beyond homogeneous material volumes, scaled analogue experiments can simulate geological heterogeneities in their set-up. In GRAM experiments, a mechanical layering representing a layered sequence can be introduced as part of the preparation of GRAM aggregates. The mechanical layer thickness has a critical impact on the fracture propagation and the spatial distribution of fracture spacing and aperture in strata-bound fracture sets. To ensure the sample homogeneity, either for RST, UCT or experiment samples, the samples were compacted only when all the material was added to the cell, cylinder or rig (Section 5.a). However, in the sample preparation tests, we prepared sand–hemihydrate UCT samples by varying the sample preparation procedure. Namely, we observed that by filling and compacting the samples in different steps we obtained mechanical inhomogeneities representing the bed surfaces. During the UCTs these layers acted as a mechanical layer with respect to fracture propagation (Fig. 17). Potentially, the experiment samples could be prepared following this workflow and characterizing the model with beds, therefore enabling the investigation of the interaction between mechanical layer thickness and fracture propagation processes in scaled experiments.

Fig. 17. UCT samples prepared by generating different mechanical layers, and schematic representations of the fracture–mechanical layer interaction.
As discussed in Section 5.a, a strike-slip setting was chosen for the prototype experiments because the experiment surface deformation represents tectonic material transport in the σ1–σ3 principal plane of stress. However, the experiment series showed that some improvements can be applied in terms of rig set-up. First, the deformation was manually driven by a hydraulic winch pulling one of the two baseplates. This was reflected by the formation of asymmetric shear zones characterized by a moving and a static block during the simulation. Also, the deformation rate was not constant, but was affected by the perception of the operator. For the GRAM test experiments, stepper motors used for generic sandbox experiments could not be utilized due to the high strength of the model material. The electronic motors available in the analogue tectonic modelling laboratories of the Department of Earth Sciences at Royal Holloway, University of London (ATML@RHUL) are designed for experiments consisting of nearly cohesionless and low-strength materials, not applicable to the GRAM prototypes. The application of more powerful electric motors or attenuators to deform the cohesive sand–hemihydrate aggregates in the future will enable a constant and controlled deformation rate during the experiment.
The presented strike-slip experiment series demonstrated the suitability of GRAM to simulate the kinematic and dynamic processes of shear zone evolution, although, with the experiment set-up described, only a relatively low level of strain was achieved before the superimposition of several pop-up structures limited the observation of primary shear zone features. With increasing displacement, these uplifted domains obstructed the surrounding structures in the PDZ. As seen in the analysed experiment (Fig. 13), in the high-strain stages the DIC maps show local data gaps corresponding to the pop-up structures. As a result, the total finite displacement of the experiment set-up was limited to low-strain shear and damage zones.
The block uplift is caused by complex fault geometries characteristic of strike-slip tectonics. Different set-ups simulating dip–slip faults may enable an ideal damage zone simulation with continuous high-resolution DIC monitoring since the experiment hanging-wall would provide the confining pressure.
In analogue modelling studies involving granular model materials, after completion of the experiments the models are commonly saturated with a gelatine–water solution and, once dried, cross-sectional sequential slices are provided. This procedure allows the analysis of the final structures in 3D volumes. Early slicing tests were conducted on GRAM experiments by filling the open fractures generated during the experiment with dry granular sands then saturating the model with a diluted gelatine solution. However, this procedure will need major tests and further refinement to determine whether the different materials and the moisture conditions of the samples and the gelatine solution can be used to optimize slicing procedures.
7. Conclusions and outlook
We have developed a new granular rock-analogue material (GRAM), aimed at enabling the simulation of coupled fault–fracture processes at structural scales. Four aggregates were evaluated as potential GRAM candidates, based on quartz sand in a mixture with a cementing agent, and were tested for their physical and mechanical suitability. The GRAM needed to form cohesive and mechanically homogeneous aggregates, deforming by shear and tensile failure, while preserving the nonlinear behaviour of dry granular sands and providing a specific dynamic scaling. The latter was established so that the geometric scaling factor ensured a model resolution within the outcrop scale, that is, 1 cm in the model corresponding to 1–100 m in the prototype.
The material development tests demonstrated that sand–hemihydrate aggregates satisfied all the GRAM material requirements. The material showed a density of 1.36 g cm−3 and cohesion of 7.88 kPa, providing a geometric scaling factor (calculated for a prototype rock with 15 MPa cohesive strength and 2.43 g cm−3 density) suitable for the required model resolution, with 1 cm in the model corresponding to 10.65 m in nature. The mechanical properties of the GRAM material could be adjusted by changing the mixing ratios, with an observed linear relationship between the cementing agent percentage (hemihydrate) and the material strength.
As a larger-scale test, the material was prepared in larger volumes for strike-slip scaled analogue experiments. The experiment series, analysed by means of digital image correlation (DIC) techniques, showed the kinematic and dynamic evolution of a strike-slip shear zone from the early stages of fracture nucleation to the interconnected architecture of the final primary deformation zone and related fault damage zone. The final model was directly compared with a natural earthquake rupture, highlighting the similar architecture of the two shear zones and validating the model itself.
The developed GRAM material will enable the simulation of fault and fracture processes at a high resolution and representative structural scale, allowing the investigation of fault damage zone evolution. The mechanical properties of GRAM can also be modified by varying the mixing ratios, enabling the adjustment of the model dynamic scaling for the simulation of different tectonic processes with specific experimental resolution.
Supplementary material
For supplementary material accompanying this paper visit https://doi.org/10.1017/S0016756821001321
Acknowledgements
The research described in this paper includes work conducted during a PhD study undertaken as part of the Natural Environment Research Council (NERC) Centre for Doctoral Training (CDT) in Oil & Gas (grant no. NE/M00578X/1) sponsored by the Royal Holloway University of London, whose support is gratefully acknowledged. We extend our thanks to Kevin D’Souza for the photographs and the technical help and to Jerry Morris for the engineering support at RHUL Analogue Tectonic Modelling Laboratories. We acknowledge the guest editor Fabrizio Balsamo, Yago Nestola and an anonymous reviewer for their helpful remarks and suggestions for revision.
Declaration of interest
The authors declare that the research was conducted in the absence of any commercial or financial relationships that could imply a potential conflict of interest.


 Open access