


1. Introduction
The sedimentary record in retroarc foreland regions provides information about convergence margins and associated characteristics, such as the advance and/or retreat of the accretionary prisms and the formation of magmatic arcs. The documentation of the interaction between subducting lithospheric plates and the formation and evolution of sedimentary basins on the overriding plates was a major advance in understanding plate tectonics (Dickinson, Reference Dickinson, Busby and Ingersoll1995; Busby et al. Reference Busby, Smith, Morris and Fackler-Adams1998). Retroarc foreland basins record information about the relative movements between the trench, the subducting and the overriding plate and their study led to the development of evolutionary models (e.g. Horton, Reference Horton2022).
By any means, unravelling the type and origin of sedimentary basins is not straightforward and requires the integration of various lines of evidence. The implementation of data from sedimentary petrography and geochemistry are routinely employed in basin analysis studies (Armstrong-Altrin, Reference Armstrong-Altrin2009; Maravelis et al. Reference Maravelis, Pantopoulos, Tserolas and Zelilidis2015; Adekola, et al. Reference Adekola, Akinlua, Ajayi, Adesiyan and Ige2018; Khazaei et al. Reference Khazaei, Mahmoudy-Gharaie, Mahboubi, Moussavi Harami and Taheri2018). Processes such as sorting, weathering and diagenesis affect the geochemical signatures of clastic sedimentary rocks (Weltje, Reference Weltje2006). Thus, immobile elements (e.g. REE, Zr, Y, Th and Ti), which are least affected by weathering are considered as the most credible provenance indicators (McLennan, Reference McLennan, Lipin and McKay1989; Hessler & Lowe, Reference Hessler and Lowe2006). In addition to geochemistry, conglomerates contain large clasts of the source rocks and have been proven very useful in provenance analysis (Bradshaw et al. Reference Bradshaw, Vaughan, Millar, Flowerdew, Trouw, Fanning and Whitehouse2012). Even though provenance data are very important in sedimentary basin analysis, robust geotectonic interpretation requires integration of additional field evidence including sedimentological, sequence stratigraphic and palaeocurrent data (Maravelis et al. Reference Maravelis, Boutelier, Catuneanu, Seymour and Zelilidis2016). Investigations have also questioned the ability of geochemical discrimination diagrams to provide unequivocal interpretations about the tectonic setting of a study region (Ryan & Williams, Reference Ryan and Williams2007; Armstrong-Altrin, Reference Armstrong-Altrin2009; Zaid & Gahtani, Reference Zaid and Gahtani2015). These discussions strengthen the notion that the geochemical interpretations must be compatible with the actual sedimentary record (Maravelis et al. Reference Maravelis, Pantopoulos, Tserolas and Zelilidis2015, Reference Maravelis, Boutelier, Catuneanu, Seymour and Zelilidis2016).
The Sydney Basin (SB) is a suitable case study to evaluate the impact of subduction-associated processes in the evolution of sedimentary basins. The SB is the southern margin of the larger Bowen-Gunnedah-Sydney Basin (Glen, Reference Glen2005) and is positioned between the New England Orogen (NEO) to the northeast and the Lachlan Orogen to the southwest (Fig. 1, Roberts & Engel, Reference Roberts and Engel1987). This study is conducted in the northern part of the SB on the Upper Permian sedimentary rocks that belong to the Newcastle Coal Measures (NCM, Fig. 2). The NCM are divided into three sub-groups (Boolaroo, Adamstown and Lambton Sub-groups), but recent sedimentological, sequence stratigraphic and geochronological studies indicate stratigraphic repetition (Breckenridge et al. Reference Breckenridge, Maravelis, Catuneanu, Ruming, Holmes and Collins2019; Maravelis et al. Reference Maravelis, Breckenridge, Ruming, Holmes, Amelin and Collins2020; Melehan et al. Reference Melehan, Botziolis, Maravelis, Catuneanu, Ruming, Holmes and Collins2021). It has been proposed that the three sub-groups that make up the NCM could be merged into the Lambton Sub-group that is representative of the NCM (Maravelis et al. Reference Maravelis, Breckenridge, Ruming, Holmes, Amelin and Collins2020, Fig. 2). The contribution of NEO and Lachlan Orogens to the sedimentation of the NCM has not been geochemically determined because studies to establish the provenance are lacking.
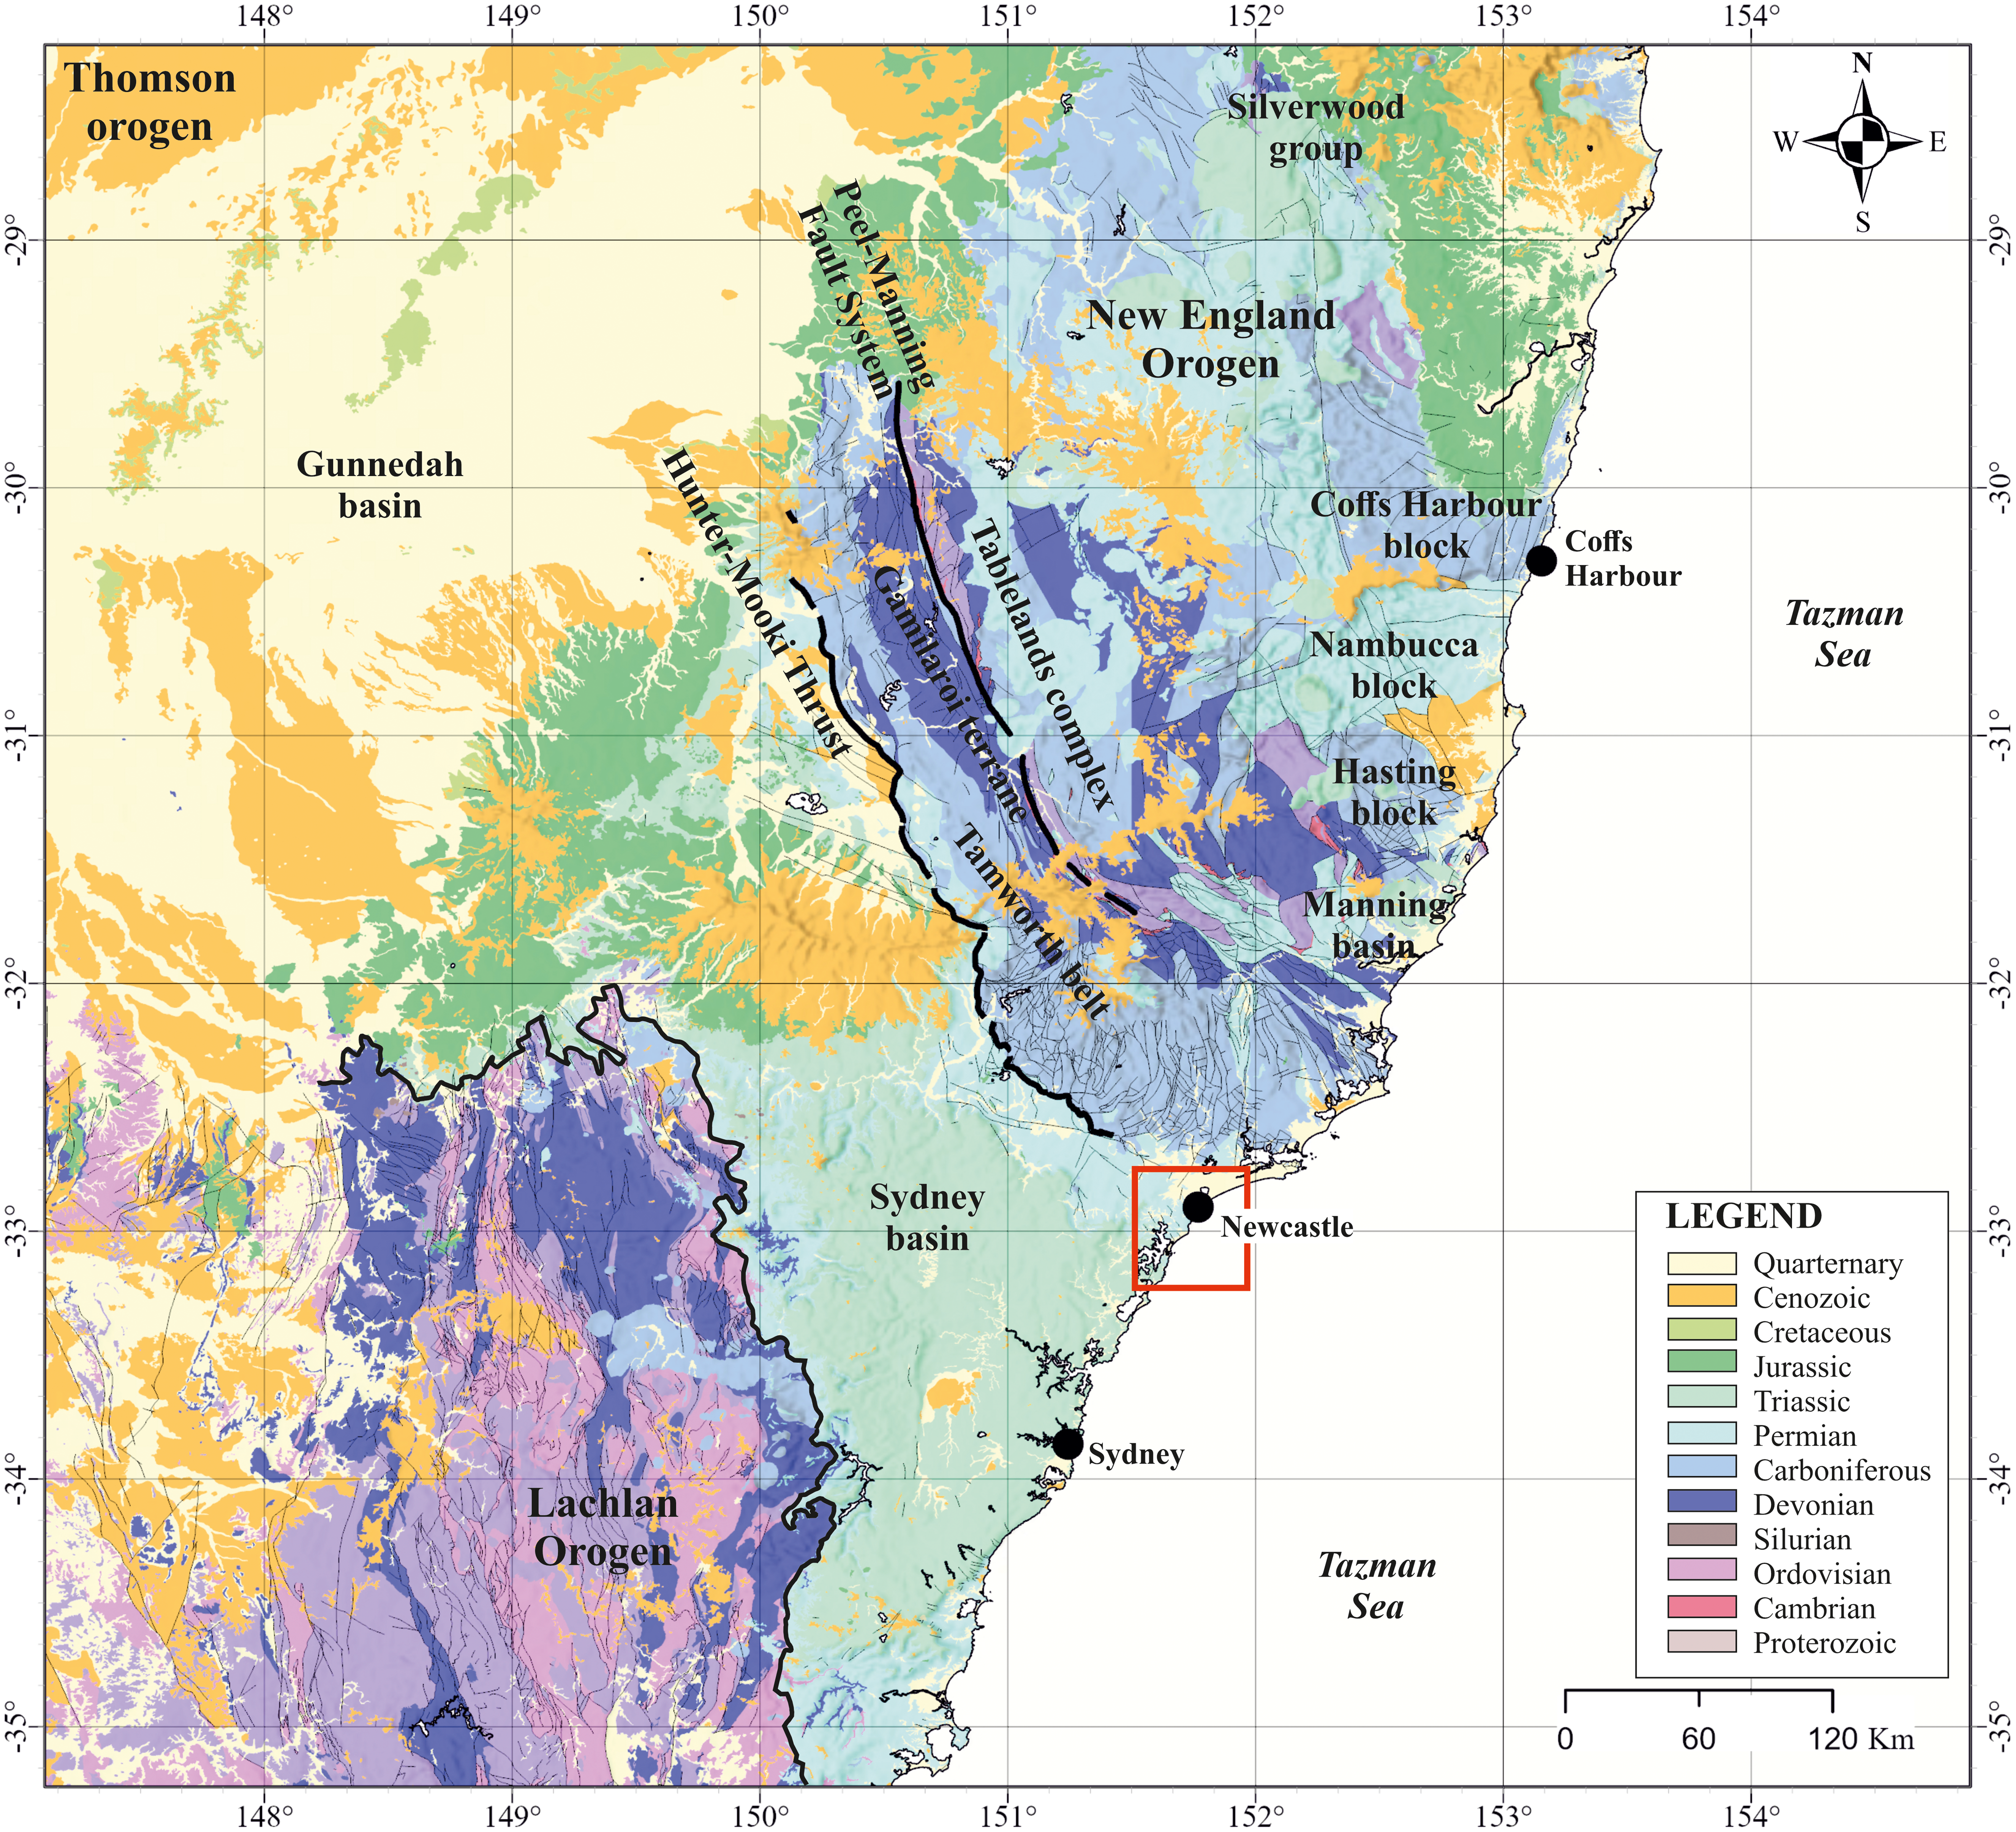
Figure 1. Geological map of NEO and surrounding regions depicting the distribution of the Tablelands Complex and the Tamworth Belt (accretionary prism and forearc basin respectively, Leitch, Reference Leitch1974; Korsch, Reference Korsch1977).

Figure 2. Comparable diagrams illustrating the differences between the current and revised stratigraphic framework in the NSB (from Maravelis et al. Reference Maravelis, Breckenridge, Ruming, Holmes, Amelin and Collins2020). The revised stratigraphic model condenses the NCM stratigraphy, suggesting the existence of the Lambton Sub-group that is represented by the deltaic setting and the Moon Island Beach Sub-group that includes (at least at its basal part) the fluvial portion of the succession.
In the light of the absence of such data, this research provides petrographic and geochemical data, along with data from conglomerate clast composition analysis to define the provenance and tectonic setting of the Upper Permian succession in the NCM. The results reveal that particular units within the NEO contributed to the composition of the succession, indicating a felsic to intermediate source rock that provided detritus in a retroarc foreland basin. The outcomes are then integrated with published palaeocurrent and sequence stratigraphic data to offer a framework for understanding the geodynamic processes that controlled the evolution of eastern Gondwana during the Late Permian.
2. Geological setting
During the Permian to early Triassic time, Australia was part of eastern Gondwana, the southern hemisphere component of supercontinent Pangea, located in high southern palaeolatitudes (Veevers, Reference Veevers2013). The SB is ∼1600 km long (Glen, Reference Glen2005), and stratigraphic equivalents can be traced through Antarctica, South Africa and South America as the foreland basin to the Gondwanide Orogen (Veevers, Reference Veevers2013). The SB is underlain by two different basement types and displays an asymmetric geometry with the thickest succession occurring in the northeast. In the southwest, the SB overlies the Early-Middle Palaeozoic Lachlan Orogen, and to the northeast, the Late Palaeozoic NEO underlies the SB (Jessop et al. Reference Jessop, Daczko and Piazolo2019).
The SB initiated as a continental backarc in the Late Carboniferous-Early Permian (Shaanan & Rosenbaum, Reference Shaanan and Rosenbaum2018), confirmed by the trace element chemistry of gabbroic and basaltic rocks (Jenkins et al. Reference Jenkins, Landenberger and Collins2002; McKibbon et al. 2016). During the later stages of the Early Permian, a mixture of post-rift subsidence and the cessation of loading caused a westward marine transgression over the Lachlan Orogen to the southwest during subduction of an east-facing convergent margin in the southern NEO to the northeast (Fielding et al. Reference Fielding, Sliwa, Holcombe and Jones2001). Subsequently, the NCM experienced subsequent conversion to a foreland basin by progressive west-directed thrusting and folding (Li et al. Reference Li, Rosenbaum and Donchak2012; Li & Rosenbaum, Reference Li and Rosenbaum2014; Philips et al. Reference Phillips, Offler, Rubatto and Phillips2015), as evidenced by the geometry and kinematics of the Late Permian folds and faults in the southern NEO and SB (Collins, Reference Collins1991; Landenberger et al. Reference Landenberger, Farrell, Offler, Collins and Whitford1995; Jenkins & Offler, Reference Jenkins and Offler1996). The Late Permian deformational pattern in the southern NEO is interpreted as the result of a single but complex compressive tectonic event, the Hunter-Bowen Orogeny, 265–250 Ma ago (Jenkins et al. Reference Jenkins, Landenberger and Collins2002; Hoy & Rosenbaum, Reference Hoy and Rosenbaum2017).
The uplifted and over-thrusted NEO became a major sediment contributor to the SB during the deposition of sediments in the NCM, and its evolution was responsible for the evolution of the NCM as a foreland basin (Korsch & Totterdell, Reference Korsch and Totterdell2009). During the evolution of the SB into a foreland basin, sediments display rapid lateral and vertical facies changes, which result from eustatically and tectonically controlled regressions and transgressions (Herbert & Helby, Reference Herbert and Helby1980). During the Middle to Late Triassic, fold and thrust belts dissected the SB, in response to westward migrating thrust fronts with associated crustal shortening (Babaahmadi et al. Reference Babaahmadi, Sliwa, Esterle and Rosenbaum2017). This deformation terminated the deposition in the SB during the Middle-Triassic time (Herbert & Helby, Reference Herbert and Helby1980). In this setting, the evolution of the SB is remarkably similar to the evolution of other contemporary sedimentary basins in southern Gondwana, including the Karoo Basin in southern Africa (Catuneanu, Reference Catuneanu2004) and the foreland systems of South America (Menegazzo et al. Reference Menegazzo, Catuneanu and Chang2016). Similar net progradation of the shoreline has also been documented in the Karoo Basin, although with less evidence for tidal activity (Rubidge et al. Reference Rubidge, Hancox and Catuneanu2000).
3. Materials and methods
In terms of the involved depositional environments and sub-environments, the NCM consist of delta-front deposits that evolve upwards into delta-plain facies and finally into fluvial deposits, documenting a regional shallowing-upward trend (Fig. 3). This study deals with the delta-plain and fluvial portions of the sedimentary succession. Petrographic analyses were performed on ten (10) fine- to medium-grained sandstone samples that were collected from outcrops (sample NCM1 to NCM 10), whereas conglomerate clast composition analysis was performed at seven (7) outcrops (Figs. 3 and 4). Further, sixteen (16) samples were collected for geochemical analysis (Figs. 3 and 4).

Figure 3. Stratigraphic column that portrays the temporal development of the studied sedimentary succession. Note the decrease in water depth as documented by the shift from delta-front to delta-plain sediments and finally to fluvial deposits (from Breckenridge et al. Reference Breckenridge, Maravelis, Catuneanu, Ruming, Holmes and Collins2019).
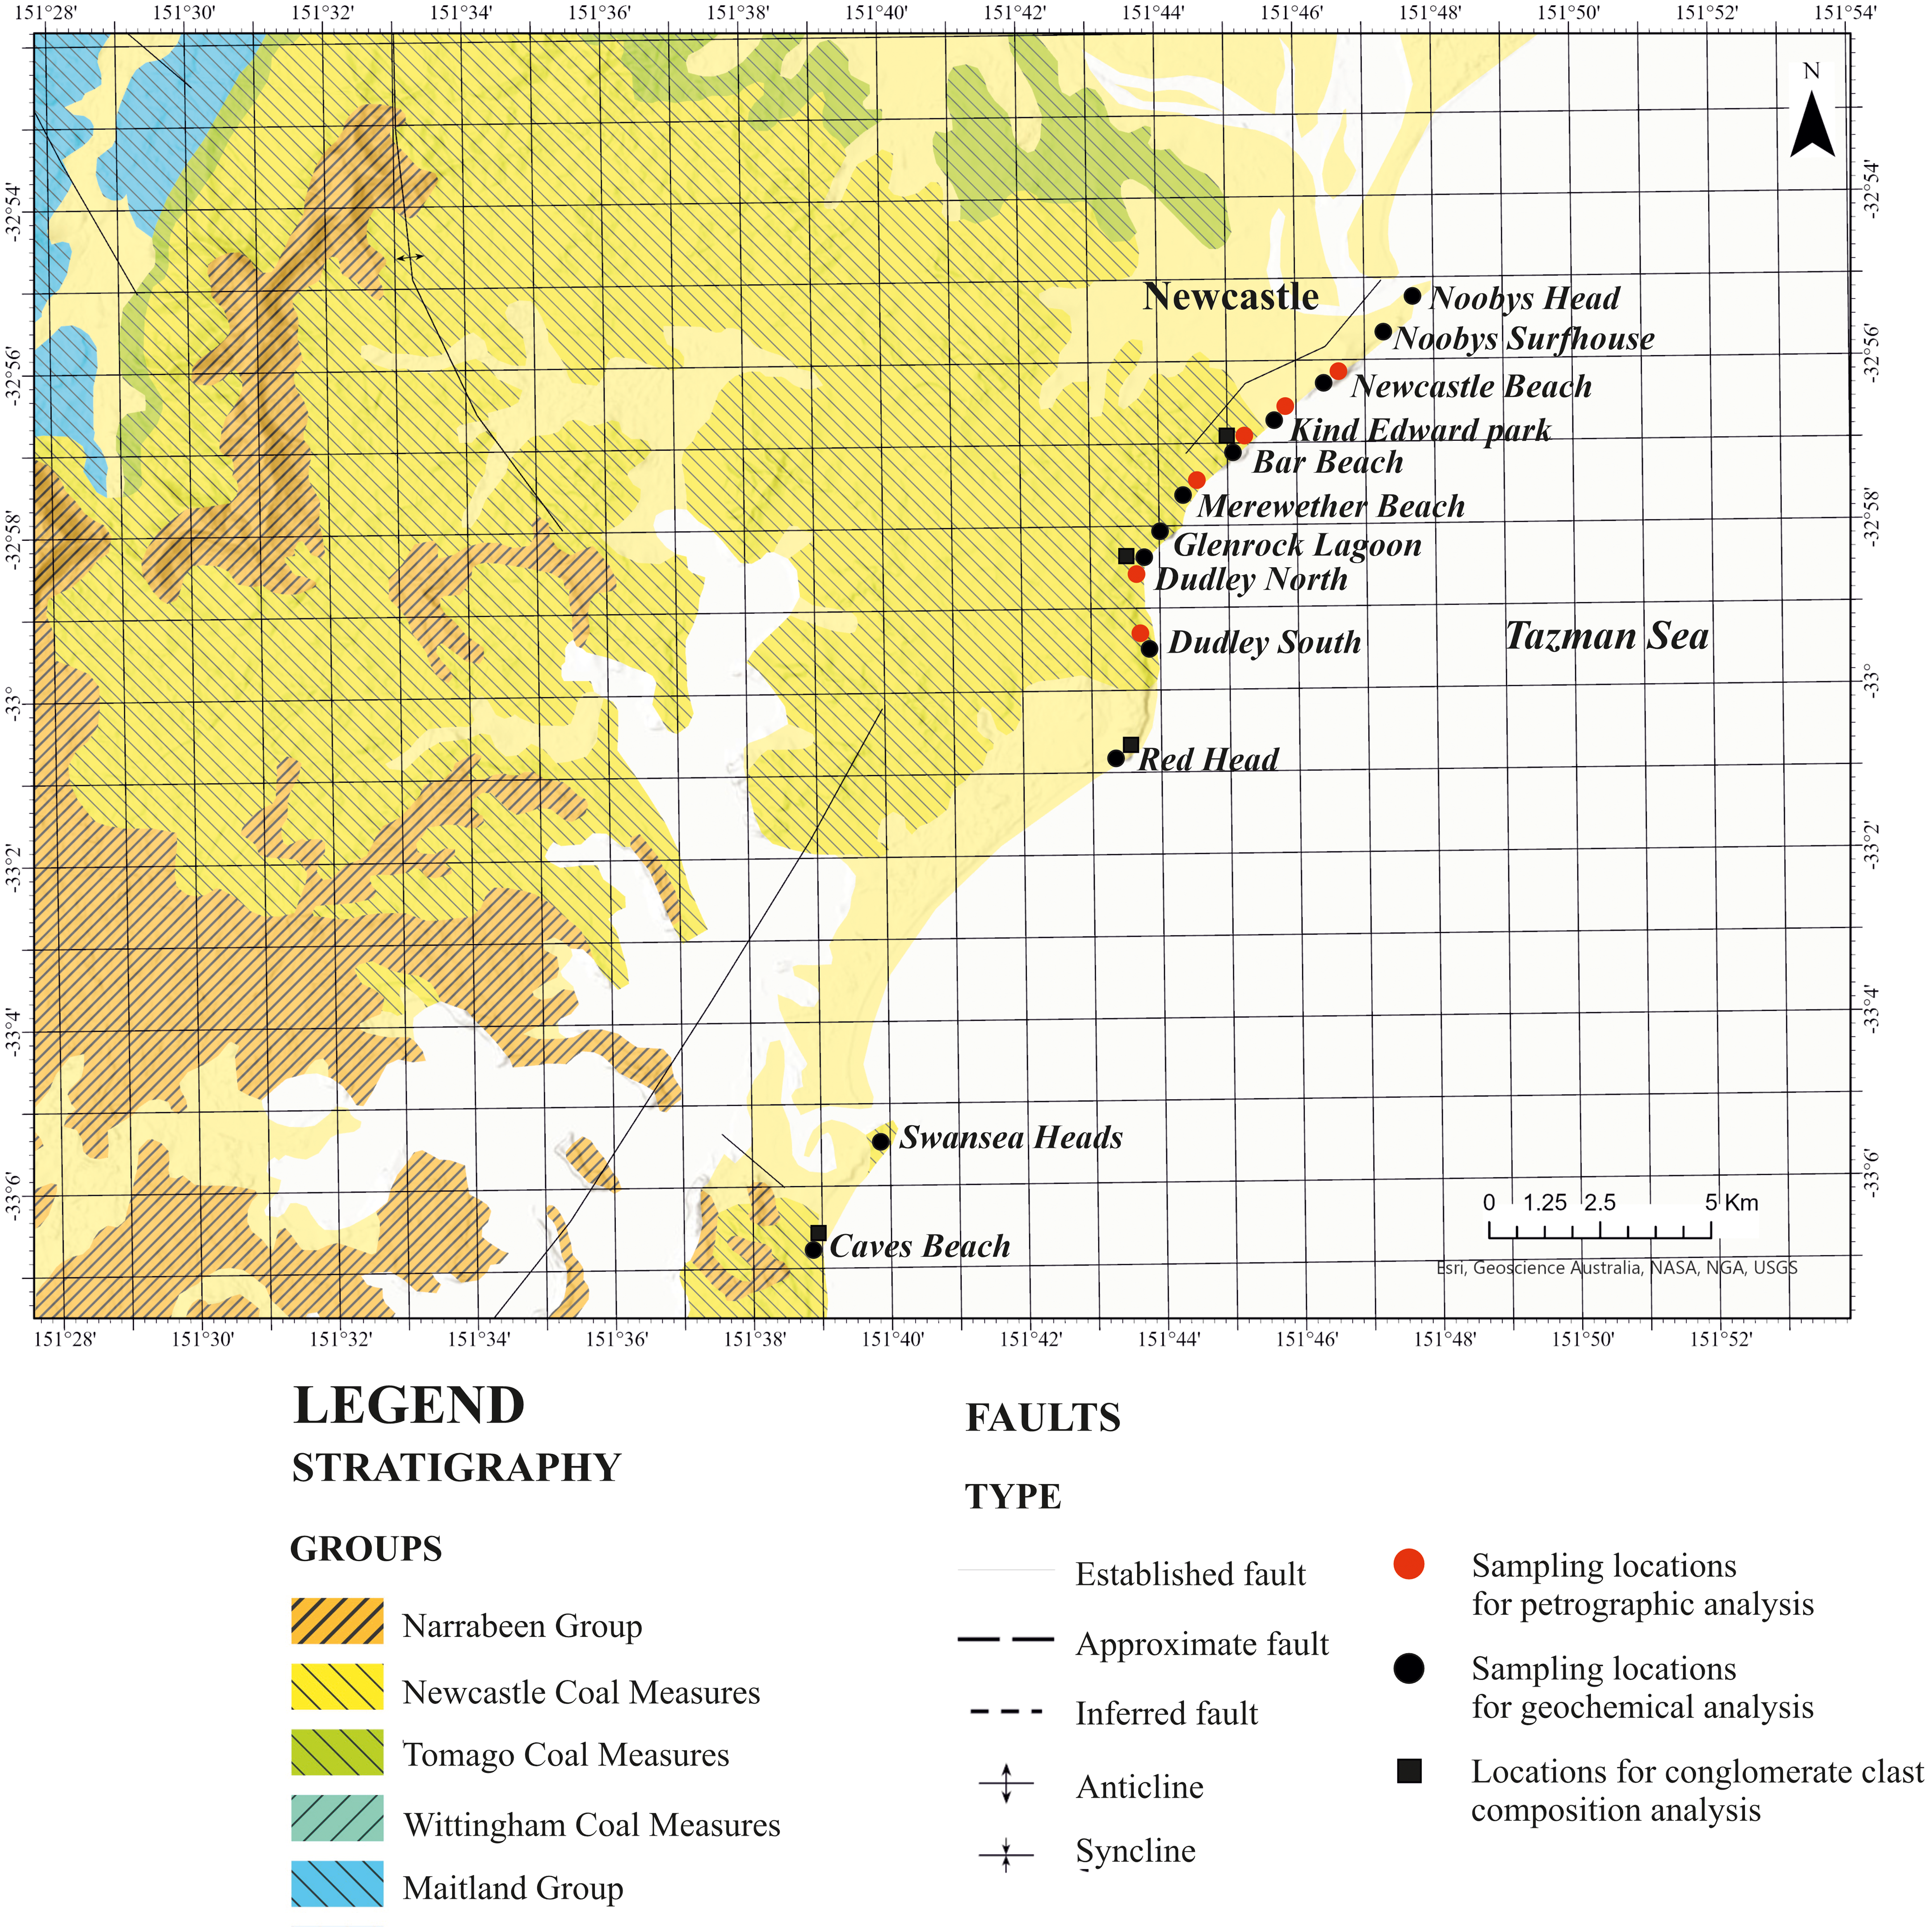
Figure 4. Map of the study region illustrating the lateral extension of the different rock units. Black dots correspond to the selected locations for geochemical analysis, red dots to the locations for petrographic analysis, and black squares to the locations for conglomerate clast composition analysis (modified from Herbert & Helby, Reference Herbert and Helby1980).
Petrographic analysis was conducted using the Gazzi-Dickinson point-counting method (Dickinson & Suczek, Reference Dickinson and Suczek1979; Ingersoll et al. Reference Ingersoll, Bullard, Ford, Grimm, Pickle and Sares1984), on a B-1000 Series Optika Italy polarizing microscope. At least 300 grains per section were examined, and features such as grain shape, types of mineral present and types of rock clasts were used to provide information on the source rocks responsible for the detrital assemblages. Conglomerate clast composition analysis was performed following the count method of Howard (Reference Howard1993). Prior to data collection, one clast sample from each litho-type was collected from each outcrop and examined under a stereo microscope. Lustre, hardness, shape of grains, phenocrysts and mineral identification were utilized to define the clast lithology. One hundred clasts were collected at ∼10 cm grid intersections in a one square metre area. Three closely spaced sub-sets (100 clasts each) at each outcrop were obtained and were then integrated for a total of 300 measurements. To maintain high accuracy in the measurements, a minimum cut-off size of 3 mm was established. All clasts less than this threshold were excluded and were considered as matrix since the identification of lithology was uncertain.
Geochemical analysis was carried out by Origin Analytical, using ICP-OES (major elements) and ICP-MS (trace elements and REE), respectively. The geochemical comparison of sedimentary rocks that have accumulated in an inferred tectonic setting with recent, known tectonic settings requires the recalculation to an anhydrous basis of the geochemical data (Rollinson, Reference Rollinson1993). In the current study, loss on ignition (LOI) was determined and for statistical coherence, the contents of the major elements in the diagrams were initially recalculated to an anhydrous (LOI-free) basis and then adjusted to 100%. The tectonic setting for the NCM samples was evaluated by using immobile trace elements and the discriminant-function-based multi-dimensional diagrams that utilize major element ratios (the reader is referred to Verma & Armstrong-Altrin, Reference Verma and Armstrong-Altrin2013, Reference Verma and Armstrong-Altrin2016 for details).
4. Results
4.a. Petrography
Sandstone samples from the NCM are poorly to moderately sorted and very fine to coarse-grained. They contain angular to sub-rounded (both mono- and polycrystalline) quartz, plagioclase, K-feldspar and lithic clasts (Fig. 4). Quartz frequently exhibits undulose extinction and/or fractures. Plagioclase is minor, and K-feldspar is uncommon. However, when present, twinning is a common characteristic in K-feldspar minerals. Subhedral to sub-rounded zircon and epidote are accessory minerals. Rare composite grains made up of quartz-plagioclase and graphic intergrowths of quartz-feldspar also occur. Opaque minerals are uncommon. Lithic fragments are abundant and are composed of sedimentary, felsic volcanics (dacitic and rhyodacitic composition) and low-grade metamorphics, such as chert (often radiolarian-bearing), slate, meta-siltstone and quartzite (Fig. 5). Fine-grained mica schist fragments are abundant, while rare granite and hornfels also occur. Some of the clasts are replaced by fine-grained aggregates of white mica (illite?). Pore spaces contain quartz, kaolinite, fine-grained white mica (illite?) and semi-opaque aggregates. The QFL triangular diagram offers information about the composition of the sedimentary rocks, based on the relative abundances of quartz (Q), feldspar (F) and rock fragments (L). The results obtained by the Gazzi-Dickinson point-counting method (Table 1 and S1) were plotted on the QFL triangular diagram (as modified by Garzanti, Reference Garzanti2019) to better describe the sandstone composition. The NCM samples plot close to the lines between the transitional arc, the undissected arc and the recycled orogenic fields (Fig. 6a). In the QmFLt triangular diagram (Qm refers to the monocrystalline quartz and Lt to the total amount of lithic clasts), the NCM samples cluster in the lithic recycled field (Fig. 6b). In the QmpFL diagram, the samples plot in the quartzo-lithic field (Fig. 6c). In the LmLvLs triangular diagram (Lm refers to the metamorphic, Lv to volcanic and Ls to sedimentary lithic clasts), the samples plot close to the Lm pole and indicate high contents of metamorphic rock fragments and lesser amounts of sedimentary lithoclasts (Fig. 6d). The NCM samples display no discernible stratigraphic-related petrographic or geochemical trends.

Figure 5. Photomicrographs showing the different types of detritus that occur in the sediments of the NCM. (a) Felsic volcanic clast (Fv) surrounded by secondary calcite aggregates Ca). (b) Possible radiolarians (R) in tuffaceous siltstone host associated with siltstone (St) and chert (Ch) clasts. (c) Chert (Ch) clast showing secondary quartz nucleated at boundary (arrow) XP. (d) Slate (Sl), detrital muscovite (Mu) and quartz (Q). (e) Felsic volcanic clast (Fv) and plagioclase (Pl) surrounded by a calcite cement. Note that many clasts are totally replaced by fine-grained white mica (I. Illite?). (f) Quartz-rich arenite with interlocking, angular to sub-angular quartz (Q) aggregates and polycrystalline quartz (Qp).
Table 1. Point-counting data (volume %) for the NCM system


Figure 6. Sandstone composition plots for the NCM samples. (a) QFL compositional plot with Q: quartz; F: feldspar; and L: lithic grains (Dickinson et al. Reference Dickinson, Beard, Brakenridge, Erjavec, Ferguson, Inman, Knepp, Lindberg and Ryberg1983). The samples cluster close to the lines between the transitional arc, the undissected arc, and the recycled orogenic fields. (b) QmFLt plot (Dickinson 1985). The samples cluster in the lithic recycled field. (c) QmpFL diagram, where the samples plot in the quartzo-lithic field. (d) Lithic grain diagram that discriminates sedimentary (Ls), volcanic (Lv) and metamorphic (Lm) lithic grains. The samples plot close to the Lm pole.
4.b. Conglomerate clast composition
Breckenridge et al. (Reference Breckenridge, Maravelis, Catuneanu, Ruming, Holmes and Collins2019) have recently studied the sedimentological aspects of the conglomeratic deposits in the NCM. The conglomerates are clast- to matrix-supported, normally to reversely graded and structureless or cross-stratified. They consist of sub-rounded to well-rounded clasts (granules or pebbles) that occur within a sandy matrix. Clast composition analysis was performed at seven outcrops, and the results indicate that the conglomerates have very similar compositions (Fig. 7). The clasts are composed of (1) igneous rocks clasts of felsic composition, (2) sedimentary rocks clasts, and (3) metamorphic rock clasts. The results from the conglomerate clast composition analysis illustrate the relative proportion of the different rock types. Felsic volcanic rocks and cherts dominate, followed less commonly by mudstone and sandstone.

Figure 7. Data from the conglomerate clast composition analysis of the studied NCM sediments. Note the prevalence of a sedimentary source (containing chert, sandstone and mudstone clasts), followed by a felsic volcanic source and a less important metamorphic source.
4.c. Major elements
Most of the major element contents in the NCM samples (Table 2 and S2) are lower than those of the Post-Archean Australian Shale (PAAS). However, SiO2 (mean 71.2 wt.%) and Na2O (mean 1.6 wt.%) contents are higher compared to PAAS (62.8 and 1.2 wt.%, respectively, Condie, Reference Condie1993). The average contents of Al2O3 (17 wt%), Fe2O3 (3.84 wt%), TiO2 (0.8 wt%), MgO (1.47 wt%), CaO (0.47 wt%), K2O (3.35 wt%) and P2O5 (0.11 wt%) in the NCM samples indicate that the studied succession is depleted in these major elements relative to the PAAS (18.9, 6.5, 1, 2.2, 1.3, 3.7 and 0.16 wt.%, respectively, Condie, Reference Condie1993).
Table 2. Major elements (in wt.%) after LOI correction for the NCM system

Pearson’s coefficient correlation variations of major elements (e.g. SiO2, TiO2 and K2O) against Al2O3 can reveal the link between the types of minerals and the distribution of major elements (Bauluz et al. Reference Bauluz, Mayayo, Fernandez-Nieto and Gonzalez Lopez2000). The choice of Al2O3 is made because Al is little affected by weathering, diagenesis and metamorphism (Bauluz et al. Reference Bauluz, Mayayo, Fernandez-Nieto and Gonzalez Lopez2000). In the samples from the NCM, Al2O3 exhibits no significant negative or positive linear correlation with SiO2, K2O and TiO2 (Fig. 8). The K2O/Al2O3 ratios in all samples are below 0.3.

Figure 8. Pearson’s correlations for selected major element (SiO2, TiO2 K2O, Al2O3) and trace element (Ba, Rb, Sr, Th, Sc, Cr, V, Ni, Co, Zr, U, Y, Hf and Cu) abundances for the studied NCM samples.
4.d. Trace elements
The trace element abundances of the NCM samples (Table 3 and S2) have been normalized and plotted against Post-Archean Australian Shale (PAAS) for comparison. Average values of Ba, Rb, Sr and Th are 725, 118, 119 and 10 ppm, respectively. Mean U, Zr, Y and Hf concentrations are 2.4, 182, 30 and 5.2 ppm, respectively, and mean Cr, V, Sc, Co, Ni and Cu are 61, 110, 17, 9, 17 and 28 ppm, respectively.
Table 3. Trace elements (in ppm) for the NCM system

The samples have similar concentrations of the large ion lithophile trace elements (LILE) such as Ba, Rb, Sr, Th and U. Furthermore, they possess similar, but slightly lower abundances of most LILEs relative to PAAS. The NCM samples have similar concentrations of high field strength elements (Zr, Y and Hf) compared to PAAS, but contain lower concentrations of Nb (Fig. 9). The trace elements display no significant correlation with Al2O3 (Fig. 8), indicating that weathering associated with clay minerals did not control their abundances and suggesting preservation in primary silicate, oxide and phosphate minerals (Absar & Sreenivas, Reference Absar and Sreenivas2015). The transition trace elements, such as Cr, V, Sc, Co and Ni, have lower concentrations than in PAAS (Fig. 8). The samples have lower abundances of Cu relative to PAAS. The correlation between Al2O3 and Co, Cr, Ni and Sc is not statistically significant for the NCM samples (Fig. 8).

Figure 9. PAAS-normalized multi-element diagram for trace element abundances of the NCM samples (PAAS normalizing values are from Taylor & McLennan, Reference Taylor and McLennan1985). The trace element values were normalized as ppm. A horizontal line for mudstone PAAS value of 1 is included for reference.
4.e. Rare earth elements
In the NCM samples, the total REE contents range from 73.4 to 758.6 ppm (mean 180.6 ppm) and the mean light to heavy REE (LREE/HREE) ratios fluctuate between 6 to 14 (average 7.3, Table 4 and S2). In most of the samples, the LaN/YbN and LaN/SmN ratios (subscript N refers to chondrite-normalized values) range from 5 to 7.8 (average 6.19) and 2.6 to 6.1 (average 3.2), respectively (Table S2). These characteristics suggest moderate LREE enrichment and fractionated REE patterns. The GdN/YbN ratios in most of the samples range from 0.6 to 1.52 (average 1.29) and display relatively flat heavy REE (HREE) patterns (Fig. 10). Only one sample (sample 4) exhibits elevated LaN/YbN and GdN/YbN ratios (29.5 and 4.8, respectively) that suggest substantial LREE enrichment and fractionated REE patterns, along with steeper heavy REE patterns (Fig. 10). Further, the sample 4 is enriched in middle REE (MREE, Sm – Ho) and displays a steep MREE/HREE slope. Further, sample 15 illustrates a convex REE pattern, steep MREE/HREE slope and HREE enrichment compared to MREE (Fig. 10). The Eu anomaly of the samples is calculated, by using the following formula: Eu/Eu* = (Eu)N/[(Sm)N × (Gd)N)1/2]. All samples display Eu depletion that ranges from 0.63 to 0.81 (mean Eu/Eu* = 0.74). The Ce anomaly is calculated using the following formula: Ce/Ce* = CeN/(PrN/LaN)1/2. All NCM samples exhibit slightly negative Ce anomalies that range from 0.91 to 0.98. N-MORB normalized patterns for the NCM samples show Nb, Ta and Sr depletion and Th enrichment (Fig. 11a), Th/Yb ratios (> 1) and Ta/Yb ratios (> 0.1), indicating that most are geochemically similar (Fig. 11b).
Table 4. Rare earth elements (in ppm) for the NCM system


Figure 10. Plot illustrating the chondrite-normalized rare earth element distribution of the NCM samples. Chondrite normalization values are from Taylor and McLennan (Reference Taylor and McLennan1985). REE pattern of Post-Archean Australian Shale (PAAS) is also presented.

Figure 11. (a). N-MORB normalized patterns of samples from the different depositional environments. The NCM samples exhibit similar features, displaying Nb, Ta depletion, Th enrichment and Sr depletion, suggesting derivation of detritus from calc-alkaline, continental arc rocks (Pearce, Reference Pearce, Hawkesworth and Norry1983). Normalizing values from Sun and McDonough (Reference Sun, McDonough, Saunders and Norry1989). (b) Th/Yb vs. Ta/Yb plot for intermediate and felsic rocks (Gorton & Schandl Reference Gorton and Shandl2000). The NCM sample plot in the active continental margin field. Abbreviations: WPB: within-plate basalts, MORB: mid-ocean ridge basalts, ACM: active continental margins, WPVZ: within-plate volcanic zones.
5. Discussion
5.a. Source rock weathering, sorting, and recycling
The data collected in this study indicate that Al2O3 does not correlate with any of the oxides. In particular, the absence of a strong negative correlation between Al and Si (r = 0.09) suggests that sedimentary sorting and fractionation of framework silicate and phyllosilicate minerals between bedload and suspended load did not take place (Fralick & Kronberg, Reference Fralick and Kronberg1997). One feature that does emerge is that all NCM samples display K2O/Al2O3 ratios below 0.3, indicating that most K2O occurs in clay minerals (K2O/Al2O3 < 0.3, Cox et al. Reference Cox, Lowe and Cullers1995), rather than in K-feldspar (K2O/Al2O3 = 0.3–0.9). In addition, the lack of correlation between Al2O3 and trace elements suggests that that these elements are related to source rocks rather than to clay minerals (Armstrong-Altrin, Reference Armstrong-Altrin2009; Madhavaraju & Lee, Reference Madhavaraju and Lee2010). The Index of Compositional Variability (ICV = (Fe2O3 + K2O + Na2O + CaO + MgO + MnO + TiO2)/Al2O3) was utilized to constrain the maturity of the sedimentary source. Sedimentary rocks that are derived from mature source rocks commonly contain a high percentage of clay minerals and exhibit low ICV values (< 1, Cox et al. Reference Cox, Lowe and Cullers1995). The samples in this study display mean ICV values (0.7) that are lower than the PAAS (Taylor & McLennan, Reference Taylor and McLennan1985; ICV = 0.85), suggesting a mature source rock (Table S2). The lack of negative correlation between SiO2 and Al2O3 in the samples (Fig. 12a) suggests a moderate degree of weathering and sorting (Fralick & Kronberg Reference Fralick and Kronberg1997). The degree of weathering has been also estimated based on the correlation of Al2O3 with TiO2 and the Chemical Index of Alteration (CIA = molar [(Al2O3/(Al2O3 + CaO* + Na2O + K2O)]) x 100; Nesbitt & Young, Reference Nesbitt and Young1982). In highly weathered rocks, Al2O3 displays strong positive correlation with TiO2, in contrast to sedimentary rocks with a low degree of weathering (Young & Nesbitt, Reference Young and Nesbitt1999). CIA values increase with increasing degree of weathering (Armstrong-Altrin, Reference Armstrong-Altrin2009). The samples display little correlation between Al2O3 and TiO2, average CIA values of 72.1 similar to PAAS (Taylor & McLennan, Reference Taylor and McLennan1985; CIA = 70–75) and indicate a moderate degree of weathering.

Figure 12. (a) TiO2 vs. Al2O3 plot for the NCM samples (anhydrous-normalized basis) suggesting that all samples have felsic compositions (fields are from Schieber, Reference Schieber1992). (b) A-CN-K diagram (Nesbitt & Young, Reference Nesbitt and Young1984) that suggests moderate degree of source rock weathering in the NCM. Abbreviations: Ga: gabbro, To: tonalite, Grd: granodiorite, G: granite (Le Maitre, Reference Le Maitre1976), Pl: plagioclase Ksp: K-feldspar (Nesbitt & Young, Reference Nesbitt and Young1984), PWT: Predicted weathering trend. (c) 15Al2O3-Zr-300TiO2 ternary diagram (Garcia et al. Reference Garcia, Coehlo and Perrin1991). Arrow points at the typical recycling trend. All plots indicate minimum degree of sediment recycling.
A moderate degree of weathering is additionally suggested by the Al2O3-CaO* + Na2O-K2O (A-CN-K) ternary diagram (Nesbitt & Young, Reference Nesbitt and Young1984). This diagram illustrates the relationship between Al2O3 (aluminous clays), CaO + Na2O (plagioclase) and K2O (K-feldspar). Sedimentary rocks that are characterized by increased weathering intensity are concentrated closer to the A axis. The deviation of the weathering trend line from the predicted line, towards the K2O apex, indicates post-depositional K-metasomatism (Nesbitt & Young, Reference Nesbitt and Young1984). The NCM samples cluster towards the A axis and along the tonalite-granodiorite predicted weathering trend (Fig. 12b). These characteristics, in conjunction with their distribution, sub-parallel to the A-CN side suggest a moderate degree of source weathering. The degree of sorting and recycling of the samples have been evaluated using the Al2O3-Zr-TiO2 diagram of Garcia et al. (Reference Garcia, Coehlo and Perrin1991). In contrast to immature sediments, mature sediments exhibit a wide range of TiO2/Zr variation (Garcia et al. Reference Garcia, Coehlo and Perrin1991). The samples show no TiO2/Zr variation and plot close to the PAAS, suggesting a low degree of source sorting and sediment recycling (Fig. 12c). This conclusion is reasonable and compatible with the position of the samples in a fluvio-deltaic system adjacent to the source region (NEO), along with the generally steep topographic gradients (Breckenridge et al. Reference Breckenridge, Maravelis, Catuneanu, Ruming, Holmes and Collins2019). Indeed, the system is coarse-grained and displays an absence of landward penetration of tidal currents into the fluvial realm (from delta-plain to fluvial deposits). These characteristics are common in systems developed under high sediment input, close to the source area.
Summarizing, the sedimentary geochemistry suggests a moderate degree of source weathering and a low degree of source sorting for the NCM samples.
5.b. Provenance
The detritus observed in the sedimentary rocks provides an insight into the sources from which they were derived. Monocrystalline and polycrystalline quartz, fine-grained mica schists, felsic volcanic and low-grade metamorphic clasts are abundant throughout the succession (Fig. 5). Granophyres and granite have also been observed in some samples. This indicates that the detritus came from felsic magmatic or volcanic sources. The presence of lithic fragments made up of low-grade metamorphic rocks (meta-siltstone, schist and quartzite), sedimentary rocks (siliceous lutite, chert, mudstone and sandstone) and polycrystalline quartz indicates that additional sources have provided the detritus for the sedimentary rocks. The plot of the NCM samples in the quartzo-lithic field of the QFL diagram supports this conclusion (Fig. 6). This field is associated with detritus that has been derived from low-grade metamorphic rocks (lower-greenschist or blueschist facies) and suggests the unroofing of upper crustal levels (Garzanti, Reference Garzanti2019). In addition, this field suggests the contribution of source rocks that are found in subduction/accretion complexes (Garzanti, Reference Garzanti2019). Such rocks containing these mineral assemblages are commonly found in the New England Tablelands Complex (Offler, Reference Offler2005; Phillips et al. Reference Phillips, Hand and Offler2010).
Support for this conclusion comes from the LmLvLs diagram where all the NCM samples plot in the suture zone field (Fig. 6c), suggesting that the source rocks have been derived from convergent settings (e.g. fold and thrust belts and accretionary complexes). The clasts in the conglomerates are of similar composition to those observed in thin sections and confirm the input of felsic volcanic, sedimentary, and low-grade metamorphic sources (Fig. 7). Previous analyses on the composition of the conglomerates that have been conducted in different parts of the SB revealed the same source rock types (Loughnan, Reference Loughnan1966; Little, Reference Little1994). In these studies, cherts dominate, followed by sandstone, conglomerate and felsic volcanics.
The provenance of the NCM was further evaluated using the chemical composition of the samples. Even though most major elements are not considered as reliable provenance indicators, TiO2 and Al2O3 are utilized to evaluate the source rock composition because Al and Ti are generally immobile during weathering and transportation processes (McLennan et al. Reference McLennan, Taylor, McCulloch and Maynard1990). The moderate to high Al2O3/TiO2 ratios (18–23, Table S2) and the TiO2 vs. Al2O3 plot suggest that the NCM samples have intermediate compositions (Fig. 12a). The absence of correlation between Al2O3 and Co, Cr, Ni and Sc for the NCM samples (Fig. 8) suggests that these elements are associated with source rocks rather than clay minerals (Armstrong-Altrin, Reference Armstrong-Altrin2009). Further, the low concentration of such elements in NCM samples indicates no contribution of mafic and ultramafic source rocks. In addition to Ti and Al, several plots based on immobile trace elements and REEs have been employed to characterize the composition of the source rock (Floyd & Leveridge, Reference Floyd and Leveridge1987; Condie, Reference Condie1993; McLennan et al. Reference McLennan, Hemming, McDaniel, Hanson, Johnson and Basu1993). The Th/Sc vs Zr/Sc plot suggests that the samples have been derived from felsic (granodiorite) igneous rocks (Fig. 13a). Similar conclusions can be drawn from the cross-plots of La/Th vs Hf and Co/Th vs. La/Th, which indicate that felsic rocks are the source of detritus in the samples (Fig. 13b and c).
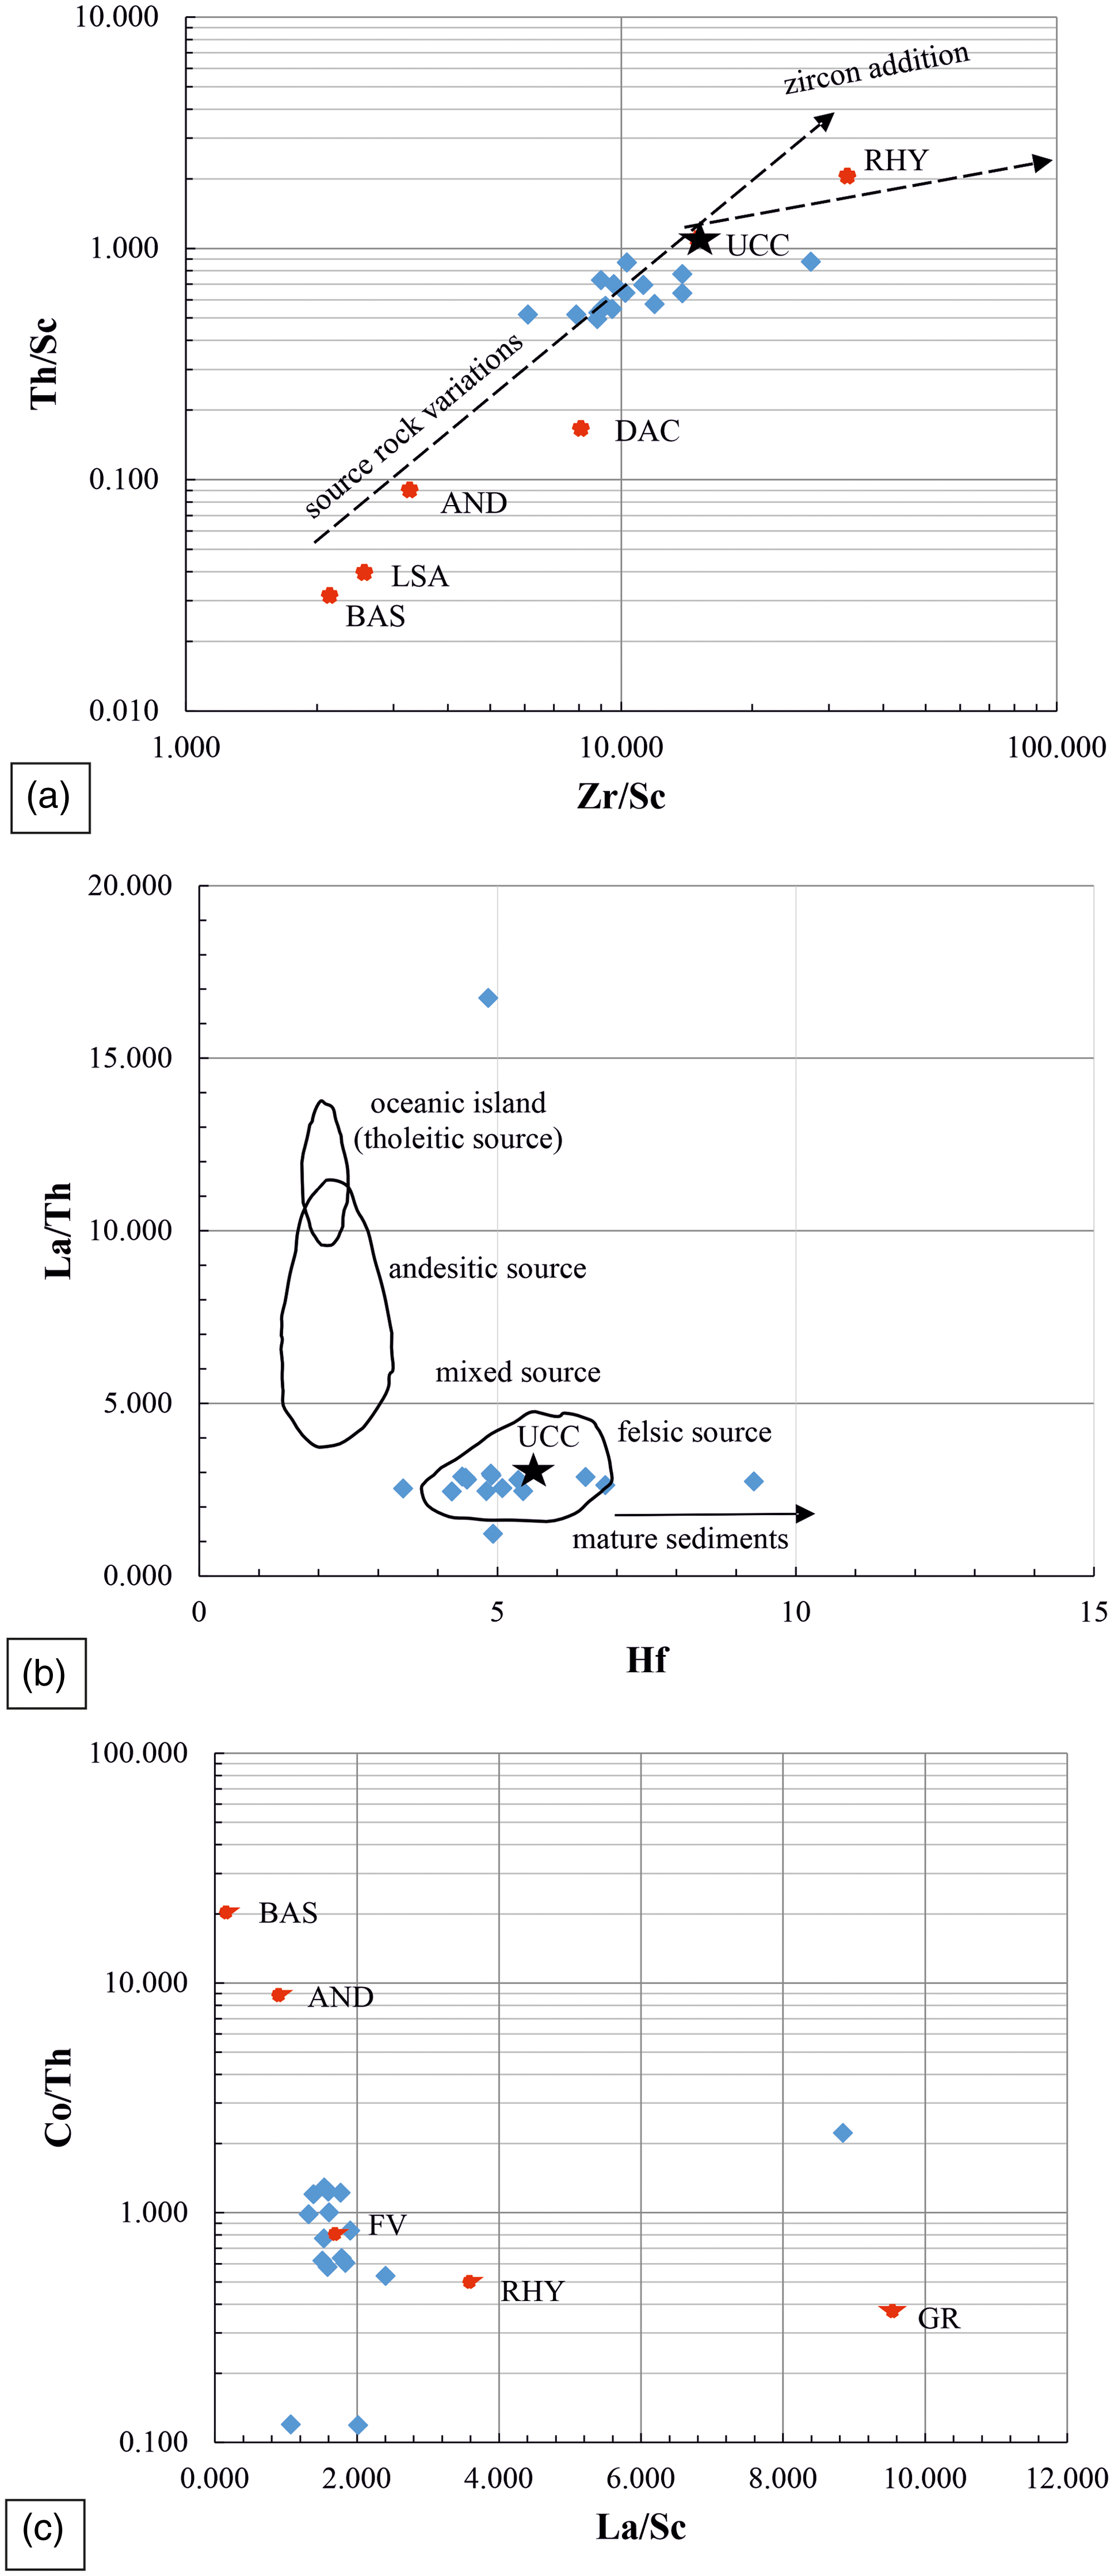
Figure 13. Binary diagrams that evaluate the source rock composition. (a) Th/Sc vs. Zr/Sc diagram. (b) La/Th vs. Hf diagram (Floyd & Leveridge, Reference Floyd and Leveridge1987). (c) Co/Th vs. La/Sc diagram. All three diagrams indicate that the studied deposits were derived from source rocks that are predominantly of felsic composition.
The chondrite-normalized REE patterns and the type of Eu anomaly can also provide insights about the type of source rocks (Armstrong-Altrin, Reference Armstrong-Altrin2009; Absar & Sreenivas, Reference Absar and Sreenivas2015). Felsic igneous rocks display LREE-enriched patterns and exhibit negative Eu anomalies (Eu/ Eu* < 1), while mafic igneous rocks are characterized by lower LREE/HREE ratios with little or no negative Eu anomaly (Cullers, Reference Cullers2000). The contribution of felsic source rocks in the NCM is suggested by the characteristics of the chondrite-normalized REE patterns (e.g. LREE enrichment, flat HREE distribution, negative Eu anomaly; Fig. 10). The MREE enrichment of the sample 4 could be ascribed to mixing of water (fresh and seawater) and fractionation by Fe-oxyhydroxides (Bolhar et al. Reference Bolhar, Hofmann, Siahi, Feng and Delvigne2015). The convex REE patterns and HREE enrichment compared to MREE of sample 15 are probably associated with the presence of phosphates that occupy MREE sites and lead to depletion (Kidder et al. Reference Kidder, Krishnaswamy and Mapes2003; Offler, Reference Offler2021).
The contribution of detritus to the SB from the rocks in the southern NEO during deposition of sediments in the NCM has been established in several studies (Herbert, Reference Herbert1997; Collins, Reference Collins2002; Breckenridge et al. Reference Breckenridge, Maravelis, Catuneanu, Ruming, Holmes and Collins2019). The provenance analysis presented here confirms the impact of southern NEO on sedimentation and assigns specific tectonostratigraphic units as source rock candidates. The southern NEO is subdivided into two units, the Tablelands Complex and the Tamworth Belt that are remnants of an older accretion-subduction complex and a forearc basin respectively (Leitch, Reference Leitch1974; Korsch Reference Korsch1977). The data from the petrographic and conglomerate clast composition analyses indicate that chert, sandstone and mudstone were important source rocks for the sedimentary successions in the NCM. Silurian-Devonian chert-rich successions are common in the Tablelands Complex as are Carboniferous turbidites (Djungati and Anaiwan terranes, Aitchison & Flood, Reference Aitchison and Flood1992) and are thus the most likely source for this rock type (Fig. 1), given that structural and metamorphic data obtained from rocks associated with them suggest a subduction-related origin (Korsch et al. Reference Korsch, Totterdell, Cathro and Nicoll2009a; Phillips et al. Reference Phillips, Offler, Rubatto and Phillips2015; Craven & Daczko, Reference Craven and Daczko2017). Similar interpretations have been also made from the geochemical analyses (major, trace and REE) on the chert exposures of the Djungati and Anaiwan terranes (Aitchison & Flood, Reference Aitchison and Flood1992). It is proposed here that the sandstone and mudstone fragments were derived from the Carboniferous turbiditic deposits that occur in the Tablelands Complex (Fig. 1). This conclusion is also supported by the geochemical and petrographic characteristics of these deposits that suggest derivation mainly from felsic sources (dacitic to rhyolitic in composition, Korsch et al. Reference Korsch, Totterdell, Cathro and Nicoll2009a). The LREE enrichment, Nb and Ta depletion and Nb/Yb values>1, shown by all samples (Fig. 11a) is indicative of calc-alkaline, continental arc rocks. This same signature is recorded by sediments in rift basins and accretion-subduction sequences in the Tablelands Complex (Offler, Reference Offler2021) and points to the Keepit arc being the source.
The fluvio-deltaic system includes thick volcaniclastic deposits (tuffs), suggesting active magmatic activity during the sediment deposition. Geochemical analysis on these tuffs indicates derivation from rhyodacitic to dacitic, continental arc, calc-alkaline magmas and a subduction-related origin (Kramer et al. Reference Kramer, Weatherall and Offler2001). The Wandsworth Volcanic Group (WVG) crops out from southern Queensland to south of Armidale in the northern margins of the southern NEO (Leitch, Reference Leitch1974). Zircon SHRIMP analysis conducted by Blevin et al. (Reference Blevin, Trigg, Partridge, Boreham and Lang2005) indicates that the WVG spans from 256.4 ± 1.6 Ma (at the base of the WVG) to 254.1 ± 2.2 Ma (Dundee Rhyodacite). These results are identical to the recently obtained high precision CA-TIMS ages of stratigraphically equivalent tuffs in the SB and Bowen Basin (Metcalfe et al. Reference Metcalfe, Crowley, Nicoll and Schmitz2015; Maravelis et al. Reference Maravelis, Breckenridge, Ruming, Holmes, Amelin and Collins2020), indicating that WVG is the principal contributor of volcanic material into these basins. The WVG is composed of calc-alkaline, silicic to intermediate volcanic rocks, with a continental, subduction-related geochemistry (Stewart, Reference Stewart2001). Rocks similar to those in the WVG are not exposed in the study area, but the presence of tuffs indicates contemporaneous volcanic activity. It is possible that such deposits occur offshore and are covered by recent sediments.
To sum up, the most likely sources of the detritus in the NCM are represented by the Tamworth Belt and Tablelands Complex, with the former providing the felsic volcanics, and the latter providing the sandstone, mudstone, slates, polycrystalline quartz and radiolarian-bearing chert/siltstone. Felsic volcanics would also have come from the Tablelands Complex that contains arenites formed from sands derived from the forearc basin adjacent to the Keepit arc that have been subducted.
5.c. Tectonic setting
QFL ternary diagrams can provide information about the tectonic setting of the source rocks, based on the proportion of quartz, feldspar and lithic components (Garzanti, Reference Garzanti2019). In this diagram, all NCM samples cluster close to the line between the transitional arc and the recycled orogenic field (QFL, Fig. 6a) and in the lithic recycled field (QmFLt, Fig. 6b). Further, the Th/Yb-Ta/Yb plot of Gorton and Schandl (Reference Gorton and Shandl2000) reveals that the source rocks formed in an active continental setting (Fig. 11b).
To gain further information about the tectonic setting, siliciclastic sediments in the study area have been evaluated using chemically based diagrams (e.g. Bhatia, Reference Bhatia1983; Roser & Korsch, Reference Roser and Korsch1986; Floyd & Leveridge, Reference Floyd and Leveridge1987; McLennan, Reference McLennan, Lipin and McKay1989; Verma & Armstrong-Altrin, Reference Verma and Armstrong-Altrin2013). However, the discrimination diagrams proposed by Bhatia (Reference Bhatia1983) and Roser and Korsch (Reference Roser and Korsch1986) have been challenged by several authors (Armstrong-Altrin & Verma, Reference Armstrong-Altrin and Verma2005; Ryan & Williams, Reference Ryan and Williams2007; Verma & Armstrong-Altrin, Reference Verma and Armstrong-Altrin2013; Verma et al. Reference Verma, Pandarinath, Verma and Agrawal2013) because their proposed tectonic settings are often inconsistent with the regional geology (Valloni & Maynard, Reference Valloni and Maynard1981; Dostal & Keppie, Reference Dostal and Keppie2009). The tectonic setting of the different source rocks that contribute to the formation of the sedimentary successions has been determined in recent studies using the diagrams proposed by Verma and Armstrong-Altrin (Reference Verma and Armstrong-Altrin2013). These diagrams are made for both high (SiO2 = 63–95%) and low silica (SiO2 = 35–63%) sediments and group the results into collision, continental or island or arc, and continental rift settings. Even though Neogene to Quaternary sediments were at first employed to test these diagrams, their application expanded to older deposits (Zaid & Gahtani, Reference Zaid and Gahtani2015; Tawfik et al. Reference Tawfik, Salah, Maejima, Armstrong-Altrin, Abdel-Hameed and Ghandour2017). The results obtained conform to the geological history of the case studies, and thus, these diagrams provide acceptable tectonic settings for the source rocks. This is because they have been constructed, considering the effects of weathering, alteration, recycling, diagenesis and experimental inconsistencies. Further, in contrast to the older methods, the datasets are treated with modern statistical techniques (Verma & Armstrong-Altrin, Reference Verma and Armstrong-Altrin2013).
All NCM samples display SiO2 contents greater than 63%, and therefore, the high-silica diagram was applied for the tectonic discrimination of the source rocks. The samples plot principally on the collision field, with a small number of samples plot on the arc field and one sample on the rift field (Fig. 14a). This diagram suggests that the source rocks come from different geotectonic settings most associated with subduction processes and regional contraction. Further, application of the diagram involving all major elements and some trace elements (Cr, Nb, Ni, V, Y and Z) that has been proposed by Verma and Armstrong-Altrin (Reference Verma and Armstrong-Altrin2016) illustrates that the NCM samples plot on the passive margin field, which is compatible with sedimentary sources derived from a rift tectonic setting (Fig. 14b).

Figure 14. Binary diagrams that evaluate the tectonic setting of the NCM samples. (a) Discriminant function multi-dimensional plot for high-silica clastic sediments (the reader should refer to Verma & Armstrong-Altrin, Reference Verma and Armstrong-Altrin2013, for detailed explanation of the discriminant-function equations). The diagram suggests an arc-related tectonic setting under contractional tectonic regime. (b) Major element-based diagram that separates active (A) and passive (P) margins (from Verma & Armstrong-Altrin, Reference Verma and Armstrong-Altrin2016). The function (DF (A-P)M) is determined from the equation: DF (A-P)M = (3.0005 × ilr1Ti) + (−2.8243 × ilr2Al) + (−1.0596 × ilr3Fe) + (−0.7056 × ilr4Mn) + (−0.3044 × ilr5Mg) + (0.6277 × ilr6Ca) + (−1.1838 × ilr7Na) + (1.5915 × ilr8K) + (0.1526 × ilr9P) – 5.9948. The diagram suggests an arc-related tectonic setting under contractional tectonic regime.
Petrographic and geochemical analyses are very important in basin analysis; however, they need to be supported by thorough field-based investigations to provide data confirming the tectonic setting of sedimentary basins (Ryan & Williams, Reference Ryan and Williams2007; Maravelis et al. Reference Maravelis, Boutelier, Catuneanu, Seymour and Zelilidis2016). Recent sedimentological and sequence stratigraphic studies suggest that the NCM was a volcanically influenced sedimentary basin and was characterized by tectonic uplift and basin confinement (Breckenridge et al. Reference Breckenridge, Maravelis, Catuneanu, Ruming, Holmes and Collins2019). The regional stratigraphy is represented by a fluvio-deltaic system that progrades on relatively steep slopes and under high sediment supply. The sequence stratigraphic analysis suggests sediment deposition during highstand and lowstand systems tracts and thus during relative sea-level rise. The fluvio-deltaic boundary is expressed by a regional-scale erosional surface (the subaerial unconformity) that developed during the falling stage systems tract and relative sea-level fall. These field characteristics are interpreted to be the result of tectonic uplift of the southern NEO (Breckenridge et al. Reference Breckenridge, Maravelis, Catuneanu, Ruming, Holmes and Collins2019). The palaeocurrent directions are towards the southeast to southwest and exhibit a temporal transition from parallel (southeast) to perpendicular (southwest) to the southern NEO (Herbert, Reference Herbert1997; Breckenridge et al. Reference Breckenridge, Maravelis, Catuneanu, Ruming, Holmes and Collins2019). This pattern is compatible with a sedimentary basin that developed at the toe of an evolving orogen. The diagrams proposed by Verma and Armstrong-Altrin (Reference Verma and Armstrong-Altrin2013, Reference Verma and Armstrong-Altrin2016) and presented in this study suggest a depositional setting that received detritus from magmatic and contractional, continental settings for the NCM and agree with the proposed basin-fill conditions. The modal compositions of NCM samples, with elevated contents of metamorphic rock fragments and lesser amounts of sedimentary lithoclasts (Fig. 6d), indicate deposition in the retro side of a foreland basin system. Similar compositions have been reported in Andes, where volcano-plutonic detritus prevails in the pro side of the orogen, whereas quartzo-lithic to quartzose detritus that contains mostly metamorphic lithic grains characterize the retro side (Garzanti et al. Reference Garzanti, Doglioni, Vezzoli and Ando2007). The lithic fragments in the NCM samples document prevalence of low-grade metamorphic fragments that could be associated with early syn-collisional stages, when detritus from volcanic arcs and subduction complexes may be abundant. The integration of sequence stratigraphic, palaeocurrent and provenance data confirms that the NCM formed in a retroarc foreland basin, in accordance with earlier studies (Herbert & Helby, Reference Herbert and Helby1980; Tye et al. Reference Tye, Fielding and Jones1996; Holcombe et al. Reference Holcombe, Stephens, Fielding, Gust, Little, Sliwa, Kassan, McPhie and Ewart1997; Fielding et al. Reference Fielding, Sliwa, Holcombe and Jones2001; Korsch & Totterdell, Reference Korsch and Totterdell2009).
5.d. Implications for the Late Permian geodynamics of eastern Australia
Eastern Australia was part of the East Gondwanaland from the Cambrian until the Early Cretaceous and part of the convergent plate boundary between the Gondwana and the Proto-Pacific (Panthalassan) Ocean (Collins, Reference Collins2002; Jenkins et al. Reference Jenkins, Landenberger and Collins2002; Glen, Reference Glen2005). This plate boundary has experienced recurring periods of contraction and extension, because of trench advance and retreat respectively (Rosenbaum et al. Reference Rosenbaum, Li and Rubatto2012; Li & Rosenbaum, Reference Li and Rosenbaum2014; Shaanan et al. Reference Shaanan, Rosenbaum and Wormald2015). In New South Wales (NSW) and along this plate boundary, during the Silurian – Carboniferous time, west-dipping subduction (Offler & Gamble, Reference Offler and Gamble2002) occurred, resulting in the development of an accretionary prism (Tablelands Complex) and forearc basin (Tamworth Belt, Korsch, Reference Korsch1977; Korsch et al. Reference Korsch, Totterdell, Cathro and Nicoll2009a). The Tablelands complex is composed of mid-ocean ridge basalt, chert and mudstone that belong to the subducted plate, along with submarine fan deposits and limestone that accumulated in the trench (Aitchison & Flood, Reference Aitchison and Flood1992). The Silurian to Upper Devonian basalt, chert and mudstone are oceanic in origin and represent the early phases of the accretionary prism, as evidenced by the radiolarian studies (Aitchison et al. Reference Aitchison, Ireland, Blake and Flood1992). The younger submarine fan deposits and limestone (Carboniferous) are the sedimentary products in the trench that have been sourced from the magmatic arc that was active that period (the Currabubula-Connors Arc, Korsch et al. Reference Korsch, Totterdell, Fomin and Nicoll2009b); Craven and Daczko (Reference Craven and Daczko2017). The Tamworth Belt consists of a wide range of depositional environments, from marginal marine and continental in the western parts, to shallow- and deep-marine in the eastern parts of the forearc basin (Champion, Reference Champion2016). The sedimentary successions in the Tamworth Belt exhibit a general shallowing-upward trend, from marine environments during the Early Carboniferous, to continental settings during the Late Carboniferous (Roberts et al. Reference Roberts, Offler and Fanning2004). The southern NEO lacks volcanic rocks that could be directly associated with the Currabubula-Connors Arc, and its existence is suggested by the occurrence of volcaniclastic material in the Tamworth Belt (Roberts et al. Reference Roberts, Offler and Fanning2006). It has been proposed that subsequent contractional tectonics could have buried the magmatic arc under the Tamworth Belt or the younger SB (Korsch et al. Reference Korsch, Johnstone, Wake-Dyster, Ashley and Flood1997; Klootwijk, Reference Klootwijk2013).
During the Late Permian – Mid Triassic time, eastern Australia experienced regional compression because of the westward advance of the subduction zone (Hoy & Rosenbaum, Reference Hoy and Rosenbaum2017). This stage corresponds to the Hunter-Bowen orogenic event and is responsible for the uplift and development of the southern NEO (Babaahmadi et al. Reference Babaahmadi, Sliwa, Esterle and Rosenbaum2017) and the transform of the SB into a retroarc foreland basin (Fig. 15). In the southern NEO, this stage leads to accretion of the Silurian – Upper Carboniferous subduction-related provinces (the Tablelands Complex, Tamworth Belt and Currabubula-Connors Arc, Fig. 1). The Hunter-Bowen orogenic event includes three main phases of contraction, a first phase of deformation (∼270–260 Ma), a second phase (∼253 Ma) and a final phase of deformation (∼235–230 Ma, Holcombe et al. Reference Holcombe, Stephens, Fielding, Gust, Little, Sliwa, Kassan, McPhie and Ewart1997; Hoy & Rosenbaum, Reference Hoy and Rosenbaum2017). The first deformational phase was the one responsible for the thickening of the crust and uplift of the Tablelands Complex and Tamworth Belt that constitute the principal components of the southern NEO (Jenkins et al. Reference Jenkins, Landenberger and Collins2002; Hoy & Rosenbaum, Reference Hoy and Rosenbaum2017). The Tamworth Belt is accreted on the Tablelands Complex through the Peel-Manning Fault system, whereas the Currabubula-Connors Arc is overthrust by the Tamworth Belt along the Hunter-Mooki Fault (Korsch et al. Reference Korsch, Johnstone, Wake-Dyster, Ashley and Flood1997, Fig. 1). The magmatic arc of this stage (the Hunter-Bowen Arc) is positioned east of the Carboniferous Currabubula-Connors Arc (Rosenbaum et al. Reference Rosenbaum, Li and Rubatto2012). The Gerringong Volcanics (263–265 Ma; Shi et al. Reference Shi, Nutman, Lee, Jones and Bann2022) correspond to the oldest products of magmatism and are associated with eastward transportation of volcaniclastic material in the SB (Campbell et al. Reference Campbell, Conaghan and Flood2001). They indicate the onset of subduction-related magmatism in the evolving NEO and suggest the evolution of the SB as a retroarc foreland basin.
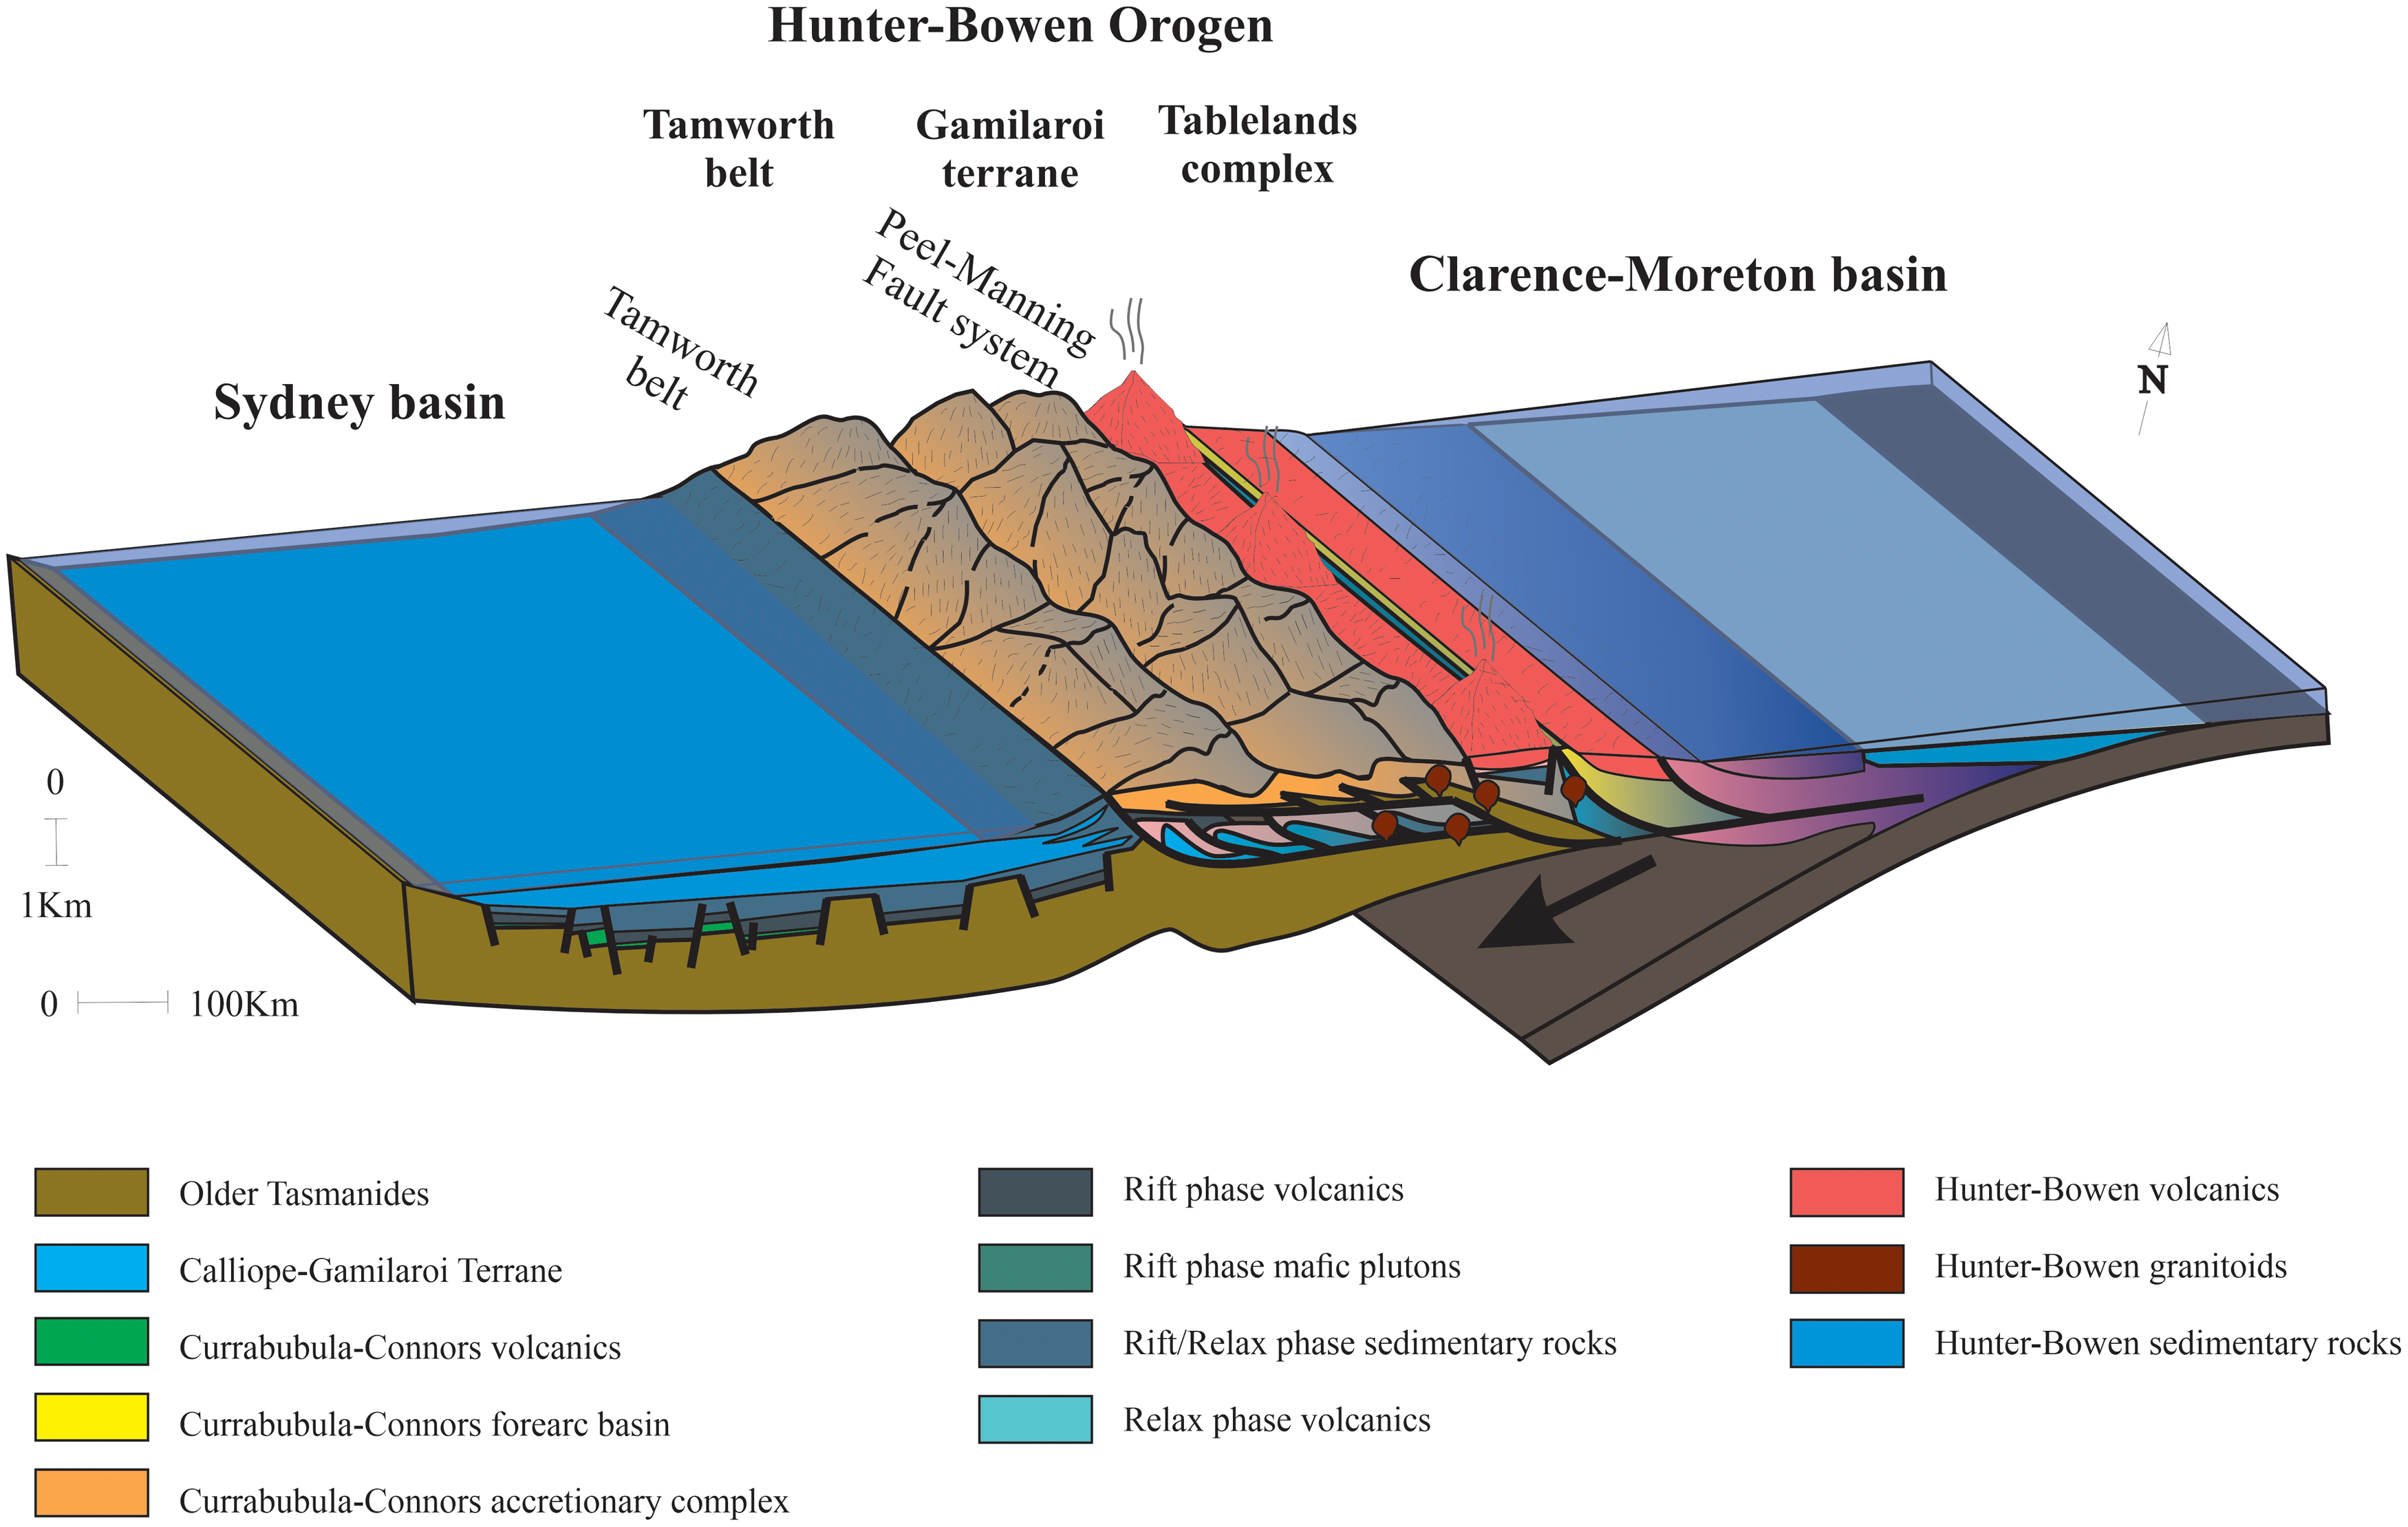
Figure 15. Schematic diagram illustrating the Late Permian geotectonic and depositional setting of the NCM (modified from Jessop et al. Reference Jessop, Daczko and Piazolo2019).
The expansion of the southern NEO and subaerial exposure of Tablelands Complex and Tamworth Belt stimulated excess in sediment supply that was delivered within the adjacent retroarc foreland SB (Diessel, Reference Diessel1992; Jenkins et al. Reference Jenkins, Landenberger and Collins2002; Breckenridge et al. Reference Breckenridge, Maravelis, Catuneanu, Ruming, Holmes and Collins2019, Fig. 15). Thus, the NCM that are the depositional products of this source region uplift should record the provenance and tectonic evolution of the NEO. Indeed, the sequence stratigraphic scenario indicates the progradation (coarsening upward) of the depositional environments and a shoaling upward trend (from delta-front to delta-plain and eventually fluvial setting, Breckenridge et al. Reference Breckenridge, Maravelis, Catuneanu, Ruming, Holmes and Collins2019). These characteristics are likely to be related to the progressively increasing proximity of the NEO to the NCM. Further, the upward shift in palaeocurrent directions (from southeast to southwest) most likely corresponds to the palaeocurrent response of the depositional environments to the Hunter-Bowen orogenic event (Breckenridge et al. Reference Breckenridge, Maravelis, Catuneanu, Ruming, Holmes and Collins2019). During the early stages of NEO uplift, the deltaic drainage systems were characterized by longitudinal flows (parallel to the southern NEO). The later stages include fluvial drainage systems with transverse flows (perpendicular to the southern NEO), reflecting the gradual growth of the NEO and the increase in sediment supply in NCM (Breckenridge et al. Reference Breckenridge, Maravelis, Catuneanu, Ruming, Holmes and Collins2019). The NCM include abundant tuffaceous deposits that document the existence of an active magmatic arc. The age of this magmatism has been elucidated by modern dating techniques (CA-IDTIMS) that revealed an age of ∼ 255 Ma (Metcalfe et al. Reference Metcalfe, Crowley, Nicoll and Schmitz2015; Maravelis et al. Reference Maravelis, Breckenridge, Ruming, Holmes, Amelin and Collins2020), indicating the existence of a Late Permian magmatic arc. The upward increase in the abundance of the tuff deposits in NCM (Diessel, Reference Diessel1992) is thought to reflect the approach of the magmatic arc to the NCM and the inboard migration of the arc, towards the edge of the Gondwana continent, during west-directed thrusting associated with the Hunter-Bowen orogenic event (Jenkins et al. Reference Jenkins, Landenberger and Collins2002).
6. Conclusions
The petrographic, geochemical and conglomerate clast composition analysis on the Upper Permian sedimentary succession of the NCM, integrated with sedimentological, palaeocurrent and sequence stratigraphic data, provide insights on the provenance and tectonic setting of the sediments.
Petrographic analysis suggests that sandstone samples from the NCM plot in the quartzo-lithic field contain detritus that has been derived from felsic volcanic and plutonic, low-grade metamorphic and sedimentary rocks. Similar conclusions derive from the conglomerate clast composition analysis that documents the prevalence of tuff, chert, sandstone and mudstone rock fragments. Major element abundances, along with ICV and CIA values, suggest that the NCM samples are geochemically mature and exhibit a moderate degree of source weathering and a low degree of source sorting and sediment recycling. Similar conclusions can be made from the 15Al2O3-Zr-300TiO2 ternary plot. The NCM deposits were derived from felsic source rocks, as suggested by the trace element and REE abundances, in conjunction with the trace element ratios. Discrimination diagrams propose that the source rocks come from an arc-related tectonic setting that experienced regional contraction and agrees with the sequence stratigraphic scenario. It suggests a regional shallowing-upward trend and the development of a sedimentary succession with a regressive architecture that is compatible with the stratigraphic evolution of a retroarc foreland basin. Palaeoflow direction in the deltaic deposits is parallel to the main structural element (southern NEO). However, the palaeoflow direction in the overlying fluvial deposits becomes perpendicular to the structural high, indicating the impact of the evolving orogen on sedimentation.
The integration of provenance, palaeocurrent and sequence stratigraphic analysis indicates that the southern NEO is the principal sediment contributor in the NCM. The Carboniferous arc-forearc basin volcanics and sediments (Tamworth Belt) and Devonian-Carboniferous accretion-subduction complex sequences (Tablelands Complex) most likely offered most of the detritus in the NCM.
Supplementary material
To view supplementary material for this article, please visit https://doi.org/10.1017/S0016756823000535
Acknowledgements
This investigation was sponsored by the New South Wales (NSW) Institute for Frontiers Geoscience (IFG), through the research project: Palaeogeographic and geotectonic evolution of the Myall Trough and Sydney Basin: Constraints in the Palaeozoic geological history of eastern Australia. The authors thank Yanyan Sun (UoN) for preparing the thin sections. The authors would like to acknowledge the two anonymous reviewers for their constructive comments and suggestions that greatly improved the manuscript.


 Open access