


1. Introduction
The geological history of the Cretaceous Period is marked by stages during which deep-marine environments underwent major deposition and burial of organic-rich, fine-grained sediments (referred to here as black shales) at regional to basin scales under the influence of low-to-absent dissolved oxygen in seawater (Hsü & Jenkyns, Reference Hsü and Jenkyns1974; Schlanger & Jenkyns, Reference Schlanger and Jenkyns1976; Scholle & Arthur, Reference Scholle and Arthur1980; Weissert et al. Reference Weissert, McKenzie, Channell, Sundquist and Broecker1985; Jenkyns, Reference Jenkyns2010; Hüneke & Mulder, Reference Hüneke and Mulder2011). These periods have been called ocean anoxic events (OAEs), and it is generally accepted that at least five major OAEs occurred during the Cretaceous Period (Schlanger & Jenkyns, Reference Schlanger and Jenkyns1976; Jenkyns, Reference Jenkyns1980, Reference Jenkyns2010; Arthur et al. Reference Arthur, Brumsack, Jenkyns, Schlanger, Ginsburg and Beaudoin1990; Wilson & Norris, Reference Wilson and Norris2001; Jarvis et al. Reference Jarvis, Gale, Jenkyns and Pearce2006; Najarro et al. Reference Najarro, Rosales, Moreno-Bedmar, de Gea, Barrón, Company and Delanoy2011; Beil et al. Reference Beil, Kuhnt, Holbourn, Scholz, Oxmann, Wallmann, Lorenzen, Aquit and Chellai2019). Cretaceous OAEs took place during greenhouse conditions (i.e. warm temperatures globally and high atmospheric pCO2), and their major significance is that they deeply perturbed the global carbon cycle through feedback mechanisms that controlled the evolution of the ocean–climate system. These events are also characterized by positive carbon isotope (δ13C) excursions related to globally enhanced rates of organic carbon burial. The intervals between Cretaceous OAEs, albeit still greenhouse conditions, are considered to be normal periods of comparatively increased seawater oxygenation and temperature change (Jenkyns, Reference Jenkyns2010; Robinson et al. Reference Robinson, Heimhofer, Hesselbo and Petrizzo2017). However, it is generally recognized that the global temperature established in OAE2 (except for the Plenus Cold Event) was prevalent until the early Turonian Age due to the high CO2 content, meaning that the subsequent cooling required changes in other factors such as a rise in sea level, weathered silicate rocks and/or nutrient sequestration in black shales (Robinson et al. Reference Robinson, Dickson, Pain, Jenkyns, O’Brien, Farnsworth and Lunt2019).
In contrast to the Cretaceous OAEs, in subsequent periods oxic, deep-marine sediments were deposited in the world’s oceans, including red to pink to purple/green/yellow limestones, marlstones, claystones and cherts (Hu et al. Reference Hu, Jansa, Wang, Sarti, Bak, Wagreich, Michalik and Soták2005; Scott, Reference Scott, Hu, Wang, Scott, Wagreich and Jansa2009). These sediments have been called Cretaceous oceanic red beds (ORBs) (Wang et al. Reference Wang, Huang, Hu and Li2004, Reference Wang, Hu, Sarti, Scott and Li2005; Hu et al. Reference Hu, Jansa, Wang, Sarti, Bak, Wagreich, Michalik and Soták2005) and, because they followed OAEs, many studies consider that their deposition was an inevitable consequence of OAE conditions (Wagreich et al. Reference Wagreich, Neuhuber, Egger, Wendler, Scott, Malata, Sanders, Hu, Wang, Scott, Wagreich and Jansa2009; Wang et al. Reference Wang, Hu, Huang, Wagreich, Scott and Hay2011). That is, continued organic-rich deposition during OAEs represented a CO2 sink, a situation that subsequently allowed both atmospheric oxygen and seawater-dissolved oxygen to increase, thus leading to the sedimentation of Cretaceous ORBs (Wagreich et al. Reference Wagreich, Neuhuber, Egger, Wendler, Scott, Malata, Sanders, Hu, Wang, Scott, Wagreich and Jansa2009; Wang et al. Reference Wang, Hu, Huang, Wagreich, Scott and Hay2011; Gambacorta et al. Reference Gambacorta, Bersezio, Weissert and Erba2016).
Along with oxygenated water masses, the main accepted conditions for the formation of Cretaceous ORBs are low sedimentation rates and oligotrophic conditions in seawater (Scott, Reference Scott, Hu, Wang, Scott, Wagreich and Jansa2009). In general, low sedimentation rates in an oxygenated water column would provide enough time for the oxidation of seawater Fe2+ into Fe3+ as the main colouring agent in ORBs, the precipitation of Fe3+-rich oxides in the water colum and/or within the sediments (surrounding other particles in both cases), and the incorporation of Fe3+ into the crystal structure of carbonate minerals (e.g. calcite) (Jansa & Hu, Reference Jansa, Hu, Hu, Wang, Scott, Wagreich and Jansa2009; Hu et al. Reference Hu, Scott, Cai, Wang and Melinte-Dobrinescu2012). Oligotrophic conditions, with a very low level of nutrients, imply that only small amounts of organic matter would reach the seafloor; this situation would promote its rapid degradation, reducing the likelihood of the creation of low-oxygen conditions in bottom waters and/or within the sediments.
The Upper Cretaceous and Paleocene sediments of the Basque–Cantabrian Basin in northern Spain are well suited for studying the origin of the colour variations within ORBs. Of particular interest are a series of short succesions (2–5 m thick) from the lower Turonian, lower Maastrichtian, upper Maastrichtian and Danian sediments that were deposited in deep-marine environments, at a palaeodepth of at least 1500 m (Pujalte et al. Reference Pujalte, Baceta, Orue-Etxebarria, Payros, de Graciansky, Hardenbol, Jacquin and Vail1998), in the Western Tethys facing the open North Atlantic. The sections are biostratigraphically complete with easily accessible outcrops that have traditionally provided a wealth of lithological, palaeontological, geochemical and cyclostratigraphic information (Gómez-Alday et al. Reference Gómez-Alday, López and Elorza2004, Reference Gómez-Alday, Zuluaga and Elorza2008; Dinarès-Turrell et al. Reference Dinarès-Turell, Pujalte, Stoykova and Elorza2013). Here, we describe the details of these colour variations, interpret their possible origin and discuss their palaeoceanographic significance. A broader impact of our work is that it may help to understand the products of the interaction between ocean and climate under greenhouse conditions, which has implications for our understanding of the evolution of our current climate.
2. Geological setting and antecedents
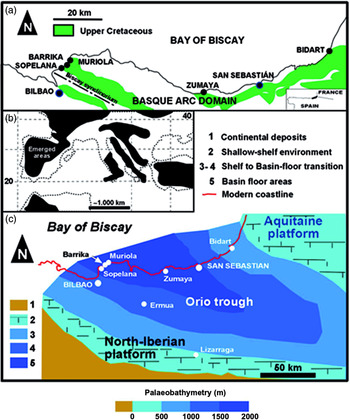
The Basque–Cantabrian Basin is located in the westernmost part of the Pyrenean chain, and its depositional history is connected to the opening of the Bay of Biscay (Fig. 1a–c). This basin constituted the most northerly part of the central North Iberian margin and occupied a latitude of c. 30–35°N during most of the Late Cretaceous–Paleocene epochs (Rat et al. Reference Rat, Amiot, Feuillee, Floquet, Mathey, Pascal and Salomón1983; Plaziat, Reference Plaziat1981; Floquet, Reference Floquet and Vera2004). A deep-marine sector, the so-called Basque Arc Domain, with several sub-basins (e.g. the Plentzia and San Juan de Luz troughs) experienced a high rate of subsidence and the deposition of more than 4000 m of calcareous flysch during the Cenomanian–Santonian ages (Mathey, Reference Mathey1987). The deep-marine sector was connected to platform settings to the south and SW (North Iberian platform) and NE (Aquitaine platform), which underwent lower subsidence rates and accumulated c. 1000 m of mainly carbonates (Floquet, Reference Floquet and Vera2004).

Fig. 1. (a) Simplified geological map of the northern part of the Basque Arc Domain showing the location of the Upper Cretaceous and Danian sections discussed (modified from Mathey, Reference Mathey1987). (b) Regional palaeogeography, according to Arenillas et al. (Reference Arenillas, Arz and Molina1998). (c) Simplified palaeogeographic sketch of the Basque–Cantabrian Basin in Maastrichtian times. Outlines show approximate palaeobathymetry, modified from Plaziat (Reference Plaziat1981), Mathey (Reference Mathey1987) and Pujalte et al. (Reference Pujalte, Robles, Orue-Etxebarria, Baceta, Payros and Larruzea2000), together with the different sections and cities referred to in the text.
In recent decades there have been many studies, with very diverse objectives, carried out on materials in flysch facies that make up the Upper Cretaceous and Palaeogene strata of the Basque–Cantabrian Basin (Martín Chivelet et al. Reference Martín Chivelet, Berástegui, Rosales, Vilas, Vera, Caus, Gräfe, Mas, Puig, Segura, Robles, Floquet, Quesada, Ruiz-Ortiz, Fregenal-Martínez, Salas, Arias, García, Martín Algarra, Meléndez, Chacón, Molina, Sanz, Castro, García-Hernández, Carenas, García-Hidalgo, Gil, Ortega, Gibbons and Moreno2002; Baceta et al. Reference Baceta, Pujalte, Serra-Kiel, Robador, Orue-Etxebarria and Vera2004; Floquet, Reference Floquet and Vera2004), collected in The Geology of Spain (Gibbons & Moreno, Reference Gibbons and Moreno2002) and Geología de España (Vera, Reference Vera2004). However, although the different colours of the same flysch facies are mentioned explicitly, as far as we know the process that gives rise to their colour, and therefore the ORB occurrence in the Basque Arc Domain, has not been investigated in depth as has been done in the North Atlantic, Eastern Alps and Carpathian areas (Wang et al. Reference Wang, Hu, Huang, Wagreich, Scott and Hay2011; Cai et al. Reference Cai, Hu, Li and Pan2012; Hu et al. Reference Hu, Scott, Cai, Wang and Melinte-Dobrinescu2012). In short educational works published with students at the University of the Basque Country, general ideas have been propounded on the local presence of the Cretaceous ORBs, which extend to the Danian Stage, as well as on the palaeoenvironmental conditions that would have favoured the red, greenish-yellow and pink colours in short sections where these facies are exposed (Domínguez et al. Reference Domínguez, Echeverría, Gómez-Urtasun, Ibisate, Martínez-García and Elorza2007; Santander et al. Reference Santander, Sopelana, Ramírez-Rodríguez, García-Peregrina, Castaños, Díez-López, Perdigón and Elorza2007; Alonso de Linaje et al. Reference Alonso de Linaje, Fernández-Lerín, Apodaca, Biain, Jaca, Hernández-Martín and Elorza2009; Iridoy et al. Reference Iridoy, Zudaire, Azaguirre, Dorronsoro, Olano, Beriain, Usarbarrena and Elorza2010).
3. Selected sections
Representative sections of red facies that emerge in the Basque Arc Domain (Fig. 1a, c) have been chosen: (1) the lower Turonian cliffs of Muriola beach (Fig. 2a); (2) five sections in the lower Maastrichtian (Fig. 3a) and upper Maastrichtian (Figs 4a and 5a) Sopelana beach cliffs; and (3) Danian materials (Fig. 6a).

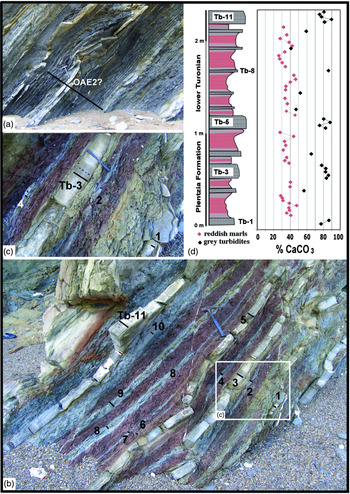
Fig. 2. Lower Turonian section (Muriola beach cliff). (a) View of the oceanic anoxic event (OAE2?) a few metres below the reddish marls. (b) Overview of the reddish hemipelagic marls with intercalated grey carbonate turbidites (Tb), belonging to the lower Turonian. (c) Detail of the reddish marls associated with grey carbonate turbidites, with irregular bleaching signs in the red marl–turbidite contact. The black bars and numbers indicate the sampling transect in the carbonate turbidites. (d) Stratigraphic column of the reddish marls, with grey carbonate turbidites. The lengths of the hammer and marker pen are 36 cm and 14 cm, respectively.

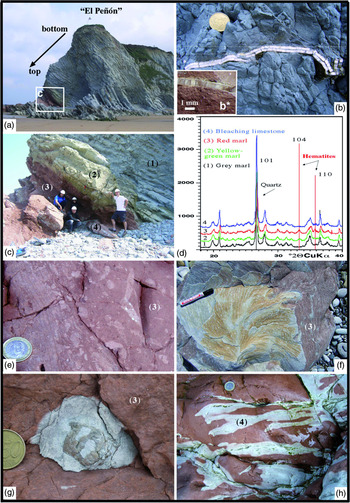
Fig. 3. (a) Inverted section called El Peñón of marl–limestone couplets belonging to the lower Maastrichtian (Sopelana beach cliffs). (b, b*) Longitudinal inoceramid section with a thick prismatic microstructure (> 6 mm) in the grey facies compared with the thin prismatic microstructure of the inoceramid (< 1 mm) in the red facies. (c) Detail of the inverted section where the gradual passage of grey (1) to yellowish-green (2) to red (3) couplets and finally to bleached (4) limestones is recognizable. (d) Diffractograms of grey marl (1), yellowish-green marl (2), red marl (3) and bleached limestone (4) showing a hematite composition (104 and 110 peaks) in the yellowish-green and red materials. (e) Detail of the heavy bioturbation in the red lithology (3), indicative of intense oxygenation. (f) View of a specimen of Zoophycos ichnofossil with clear changes in colouring (bleaching) included in red facies (3) of the same section. (g) View of an echinoid fossil causing a bleaching crown during the decomposition of organic matter in the red facies (3). (h) Network of irregular fractures as a means of transmission of reducing fluids, capable of bleaching a limited part (4) of the consolidated red limestone. Diameter of coin is (b, g) 2.4 cm and (e, h) 2.3 cm. (f) Pen is 13.5 cm long.

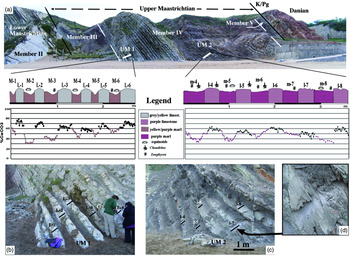
Fig. 4. (a) General view of the Sopelana cliffs with the lower Maastrichtian top part (Member II) and the upper Maastrichtian (Members III, IV and V) as far as the K/Pg limit followed by the development of the Danian pink marl–limestone couplets. The values in %CaCO3 of the small sections UM1 and UM2 studied are incorporated, where the high compositional differences between the marl and limestone couplets in section UM1 are quite noticeable compared with the much more gradual changes in section UM2. (b, c) Complete views of section UM1 (grey-yellow limestone and purple marl) and section UM2 (purple limestone and purple marl) chosen to obtain %CaCO3 values. (d) Detail of (c), where the step from marl to marly limestone is scarcely perceptible. Black bars and numbers point to the limestone subcouplets transect where samples were taken.

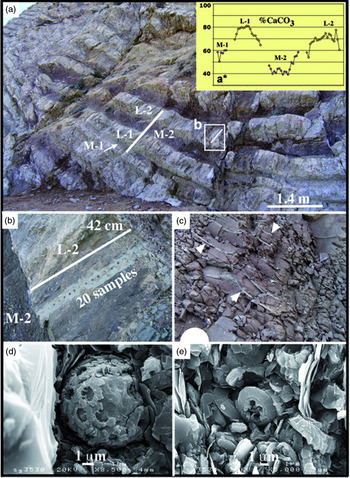
Fig. 5. (a) Upper Maastrichtian section UM1* where the marl–limestone couplets are very thick (central part of Sopelana beach cliffs). (a*) The marl subcouplets (M-1, -2) have purple tones whereas the limestone subcouplets (L-1, -2) have yellowish-grey tones. (b) Detail of transect for calcimetric analysis (2 cm per sample) of the yellowish-grey limestone subcouplet. (c) Detail of purple marl subcouplet with a vertical section of a Zoophycos fossil recognized by its bleached spreite whorls, indicated by the head of white arrows. Diameter of coin is 2.4 cm. (d, e) SEM views of a coccosphere and coccolith plates as calcareous nannoplankton and ferromagnesian clay remain protected and conserved in the Zoophycos cross-cut.

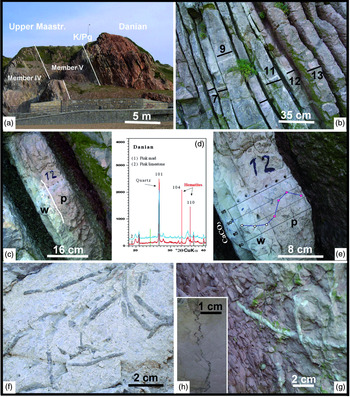
Fig. 6. (a) General view of Member V corresponding to the upper Maastrichtian section, the Cretaceous–Palaeogene border and Danian marl–limestone couplets (Sopelana beach cliffs). (b) View of the Danian pink and white couplets with limestone subcouplets strongly developed versus the marl subcouplets, numbered and sampled for calcimetric analysis. (c) Limestone subcouplet 12, where the clear transition of white (w) to pink (p) limestone is apparent. (d) Diffractograms of the Danian pink marl (1) and pink limestone (2), showing a hematite composition (104 and 110 peaks) in both lithologies. (e) Detail of the 12th couplet with the transition of white limestone at the base to pink limestone with a slight compositional change in the %CaCO3 content. (f) Grey bioturbated marl (Planolites), where the non-oxidized traces remain darker in relation to the lower Maastrichtian sediment. (g) In contrast, in the similarly heavily bioturbated pink marls, bleaching occurs in the Planolites traces. (h) View of sutured and irregular stylolite with concentration of insoluble material. Examples correspond to (b, c, e, g, h) Danian section and (f) lower Maastrichtian section (Sopelana beach cliff).
3.a. Muriola beach cliff: Lower Turonian section
The Muriola beach sea-cliff exposure (Barrika village, 20 km NE of Bilbao) covers less than 80 m and is assigned to the basal Plentzia Formation (middle Cenomanian – uppermost Santonian; Mathey, Reference Mathey and García1982); it is well developed on the NE flank of the Biscay Synclinorium, with a local direction of N90°E (Fig. 1a, c). In general, the Plentzia Formation is formed of grey carbonate turbidites where the central part contains bedded and nodular chert in the Tb, Tc and Td intervals of the Bouma sequence (Elorza & Bustillo, Reference Elorza, Bustillo, Hein and Obradovic1989), but the Muriola beach section contains a dysoxic–anoxic event (1.40 m thick, expanded by 0.50 m of interbedded turbidites) that is the OAE2 itself or a local anoxic episode (Fig. 2a). Above and a short distance away, as a result of the presence of faults, a small deposit of reddish hemipelagic marls (> 2 m thick) has thin, interbedded grey turbidites that likely formed in a deep basin environment (Fig. 2b, c). Planktonic foraminifer species (Marginotruncana pseudolinneaina, Marginotruncana renzi, Helvetoglobotruncana praehelvetica, Dicarinella hagni and Dicarinella canaliculata) date this section as early Turonian age. The thin grey turbiditic beds include trace fossils at the base, but do not contain macrofossils such as ammonite moulds or inoceramid debris. The existence of small normal faults with reactivation structures, stylolites and extension veins are highlighted.
3.b. Sopelana beach cliffs
The Sopelana beach (15 km NE of Bilbao) has a length of more than 800 m and its cliffs contain materials of different environments and ages, delimited by faults (Elorza et al. Reference Elorza, Orue-Etxebarria and Lamolda1984). All the materials were folded by the Alpine Orogeny and make up the NE flank of the Biscay Synclinorium, with a general fold axis direction of N120°E. Palaeogeographic reconstructions situate the basin at latitude 30–35°N. The Maastrichtian sediments of the Basque Arc Domain were deposited in the Orio trough, formed during the Campanian Age and limited by the North Iberian platform to the south and the Aquitaine platform to the north (see Plaziat, Reference Plaziat1981; Mathey, Reference Mathey1987; Pujalte et al. Reference Pujalte, Baceta, Orue-Etxebarria, Payros, de Graciansky, Hardenbol, Jacquin and Vail1998, Reference Pujalte, Robles, Orue-Etxebarria, Baceta, Payros and Larruzea2000). Gypsums, clays and volcanic rocks (Keuper Facies, Triassic) are visible to a minor extent compared with the vast extent of carbonate sediments ordered by couplets of marls with either marly limestone or limestone, corresponding to the lower and upper Maastrichtian Stage, included in the Zumaya–Algorri Formation (Mathey, Reference Mathey and García1982) and differentiated into Members I–V (MacLeod & Ward, Reference MacLeod, Ward, Sharpton and Ward1990; Ward & Kennedy, Reference Ward and Kennedy1993). Although the lower and upper Maastrichtian couplets usually comprise subcouplets of marls and marly limestones, for the sake of simplicity we refer to these as marl–limestone couplets. Small sections of interest are found in the Sopelana beach cliffs (Figs 1, 3–6): the lower Maastrichtian, upper Maastrichtian and Danian sections.
3.b.1. Lower Maastrichtian section
The materials of the lower Maastrichtian section are composed of grey marl–limestone couplets without turbiditic episodes and with a high rate of sedimentation per couplet (3 cm ka–1); they were deposited in a deep basin environment (Gómez-Alday et al. Reference Gómez-Alday, López and Elorza2004; Álvarez-Llano et al. Reference Álvarez-Llano, Baguer, Martínez López de Sabando, Múgica, Pérez-García, Unanue and Elorza2006). The section belongs to the Gansserina gansseri biozone, in chron C31R prior to the latest Cretaceous regression. Macrofossils comprise thick, complete inoceramid shells (Ward et al. Reference Ward, Kennedy, MacLeod and Mount1991; MacLeod, Reference MacLeod1994; Gómez-Alday et al. Reference Gómez-Alday, López and Elorza2004, Reference Gómez-Alday, Zuluaga and Elorza2008) and scarce ammonite moulds of different species (Ward & Kennedy, Reference Ward and Kennedy1993), in addition to Zoophycos and Planolites as the dominant ichnofossils.
The object of our attention is a small section in the eastern part of Sopelana beach called El Peñón, where the carbonate marl–limestone couplets, inverted due to nearby diapiric activity, correspond to the lower Maastrichtian section of the Zumaya–Azgorri Formation (Fig. 3a). The marl–limestone couplets are mostly grey, with considerable large Platyceramus salisburgensis (Fugger & Kastner, Reference Fugger and Kastner1885) (Fig. 3b) inoceramid shells. However, they evolve into greenish-yellow tones and then a greater prevalence of red tones (Fig. 3c, d). In these materials of greenish-yellow to reddish tones, inoceramid fragments, echinoids, trace fossils with numerous Zoophycos and later bleached fractures are preserved (Fig. 3b*, e–h).
3.b.2. Upper Maastrichtian section
Three small, complementary upper Maastrichtian sections have been chosen for this study. Section UM1 (2.67 m thick) is formed of six marl–limestone couplets of yellowish-grey shades in the limestones and slightly purple tones in the marls, arranged in normal position and belonging to the lower part of the upper Maastrichtian section (Fig. 4a, b). In the same Sopelana cliff, section UM1 has been complemented with another, smaller section, UM1*, of thicker couplets (two marl–limestone couplets, 1.39 m) with similar lithological characteristics and ichnofossil contents. Above, section UM2 (3.60 m thick) has five marl–limestone couplets of generally purple tones, both in marls and limestones (Fig. 4a, c, d). Both sections correspond to the Abathomphalus mayaroensis biozone, forming part of Member IV (Ward & Kennedy, Reference Ward and Kennedy1993).
3.b.3. Danian section
The Paleocene sediments were deposited in slope-apron, basin-floor and deep-sea channel environments limited by the shallow limestones of the North Iberian platform to the south and the Aquitaine platform to the north. Neither purple nor intense red, the pink and white colour of the limestones is the most evident and defining characteristic in all recognized outcrops of Danian age (Sopelana, Zumaya, San Sebastián, Hendaye, Bidart sections) in the Basque Arc Domain (Fig. 1a). The small fragment of the stratigraphic record chosen in the Sopelana beach cliff belongs to the pinkish-white pelagic limestones and hemipelagic marls of the Danian (lower Palaeogene), located on the northeastern flank of the Biscay Synclinorium (Figs 1a, c, 4a, 6a, b).
The marl–limestone couplets are grouped in turn in sets in different ways (tight, amalgamated and open), without intervening turbiditic episodes or slides that would generate intraformational gaps. The depositional environment is deep basin and reaches the biozones of Eoglobigerina pseudobulloides and Eoglobigerina trinidadensis (Pujalte et al. Reference Pujalte, Baceta, Orue-Etxebarria, Payros, de Graciansky, Hardenbol, Jacquin and Vail1998). The marl–limestone couplets are predominantly pink, but can change at the intrabed scale to white tones in both lithologies (Fig. 6c, e). Only crushed echinoid shells appear as macrofossils, and Zoophycos and Planolites are the predominant ichnofossils (Fig. 6g). The limestone subcouplets have numerous sutured, irregular small stylolites perpendicular to the stratification surface (Fig. 6h).
4. Methods
Detailed sedimentary logs, photographic documentation and a large sample set of bulk sediments and fossil shells from the sections studied were collected over several field seasons. We examined more than 50 thin-sections by standard microscopy methods, using Alizarin Red S and potassium ferricyanide staining (Dickson, Reference Dickson1965). All cathodoluminescence (CL) work employed a Technosyn Cold Cathode Luminescence system (model 8200 Mk II) mounted on an Olympus trinocular research microscope with a maximum magnification capability of 400×, using universal stage objectives. Standard operating conditions included an accelerating potential of 12 kV and a 0.5–0.6 mA beam current with a beam diameter of approximately 5 mm. For the intervals specifically addressed in this paper, sampling resolution was increased up to 2 cm per sample. Samples were collected using a portable drill and 6 mm bits on fresh surfaces of marls, marly limestones and limestones. The proportion of CaCO3 (in percent) was measured on a split (90–150 mg) of each powdered sample using an automated calcimeter (Aquitaine Technique Innovation, Bordeaux, France) at the University of the Basque Country (Bilbao, Spain) following the method of Bernard (Allison & Moodie, Reference Allison, Moodie and Black1965). The pressure of the evolved CO2 gas was individually measured and converted to %CaCO3. Analytical precision is better than 4% on the basis of replicate analyses. The stable isotope data were obtained from the same samples at the University of Missouri (USA) by reacting c. 50 μg of powder in 103% H3PO4 at 70°C in a Kiel III carbonate device. The δ13C and δ18O of the evolved CO2 was determined online in a Thermo Finnegan Delta Plus mass spectrometer. The results are normalized to the average of multiple analyses of the NBS-19 standard. The resulting corrections were small, and analytical precision, based on uncorrected values for NBS-19, was 0.02‰ and 0.05‰ for δ13C and δ18O, respectively. The isotope data are expressed in the standard δ-notation relative to the Vienna PDB standard.
A number of samples were selected and examined under a scanning electron microscope (SEM) and qualitatively determined (Al, Si, Fe, P, K, Ca) by energy-dispersive spectrometry (EDX) using a Jeol JSMT6400 at the University of the Basque Country. X-ray diffraction (XRD) analyses were performed with a Phillips PW1710 diffractometer using Cu Ka radiation monochromated by graphite with generator conditions of 40 kV, 20 mA, a step size of 0.02° (°2θ) and a time per step of 1 s.
5. Results
5.a. Lower Turonian section (Muriola beach cliff)
In the hemipelagic reddish marls of 2.35 m thickness, a total of 11 layers of grey carbonate turbidites Tb-1 to Tb-11 are intercalated, with parallel and cross laminations (Fig. 2b). The reddish marls are irregularly ‘bleached’ in contact with the grey turbidite beds (Fig. 2c). High-resolution calcimetric analyses (38 samples; c. 2–3 cm per sample) of the red hemipelagic marls reveal a mean value of 36% CaCO3, whereas the mean value of the 23 samples of the grey carbonate turbidites is 75% CaCO3 (Table 1).
Table 1. Mean proportions (%) of CaCO3 and sedimentation rates (cm ka–1) of the marl–limestone couplets analysed in the different selected sections.

In the turbidites Tb-3 and Tb-11, of medium thickness, a decrease in the concentration of CaCO3 is observed towards the top (Fig. 2d). The analysis of red marls by XRD confirms that the minority mineral phases correspond to quartz, plagioclase, feldspar, micas and clays such as kaolinite and illite and/or smectite. The presence of hematite is recognized in the insoluble concentrate, as a result of the red marls having been attacked with dilute HCL. The chronostratigraphic and geochemical characteristics assign the reddish marls of Muriola beach to the Ca Cretaceous ORBs and as short-term Cretaceous ORBs of age < 1 Ma, according to the classification of Hu et al. (Reference Hu, Scott, Cai, Wang and Melinte-Dobrinescu2012).
5.b. Lower Maastrichtian section (Sopelana beach cliff)
In El Peñón section, high-resolution calcimetric analysis provides a mean value across the five grey limestones of 79% CaCO3 versus 60% for five grey marls; a mean value of 62% CaCO3 for five greenish-yellow marls; 65% CaCO3 for five red marls versus 87% for three red limestones; and a mean value of 91% CaCO3 for three red limestones with bleaching effect. These mean values indicate a high percentage of CaCO3, although with a 20% difference between limestone versus marl values (Table 1). These compositional characteristics allow us to classify the reddish and greenish-yellow couplets of the lower Maastrichtian section as belonging to the Ca Cretaceous ORBs and as short-term Cretaceous ORBs of age < 1 Ma (Hu et al. Reference Hu, Scott, Cai, Wang and Melinte-Dobrinescu2012). The δ18O‰ and δ13C‰ (V-PDB) values of the same samples in the grey and red facies were obtained to provide complementary data (Table 2). The δ18O in the grey limestone reaches a mean value of −2.32‰ compared with the mean value of −2.17‰ in the grey marls. In both the greenish-yellow marls and the red marls, the mean value of δ18O is −1.90‰. The analyses carried out in the contact zone between the red limestone and the bleached zones provide very similar mean values of 1.65‰ and 1.66‰, respectively.
Table 2. Proportions of CaCO3 (%) and isotopic values (δ13C ‰, δ18O ‰ V-PDB) of grey, green-yellowish, red (marl–limestone) couplets and bleached parts of El Peñón section, as well as the isotopic values (δ13C ‰, δ18O ‰ V-PDB) of the inoceramid prisms collected in the grey and red facies. The isotope data are expressed in the standard δ-notation relative to the Vienna PDB standard (V-PDB). PG – Peñón grey; PV – Peñón greenish-yellow; PR – Peñón red; Pcc – Peñón calcite; SD – standard deviation.

The value obtained from a late calcite vein (100% CaCO3) is δ18O = −4.02‰. The δ13C data exhibit stable values between a minimum of 1.93‰ and a maximum of 2.12‰. The mean value of δ18O in a single inoceramid shell in grey facies is 0.39‰, whereas the mean value in different inoceramid shells in red facies is 0.12‰. The δ13C data exhibit stable values with a slight decrease in the red facies (Table 2). The analysis of grey limestones and marls by XRD indicates that the minority mineral phases correspond to quartz, plagioclase, feldspar, micas and clays such as kaolinite and illite and/or smectite. The presence of hematite is recognized in the insoluble concentrate (Fig. 3d). Cathodoluminescence microscopy (CL) was also used to verify the diagenetic zoning undergone in the inoceramid shells (Fig. 7a–d), and elemental maps (Ca, Fe, Mg) made to determine the presence of ferromagnesian clays in the intercrystalline zones of planktonic foraminifer chambers, using an energy-dispersive X-ray spectroscopic instrument (Fig. 8i–l).

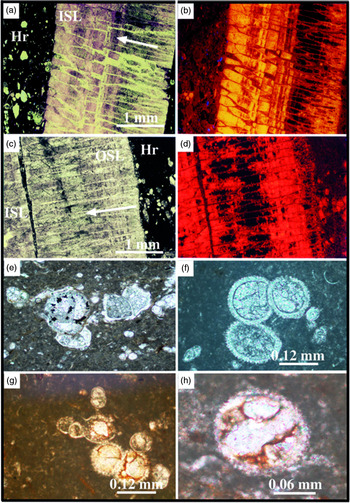
Fig. 7. (a, c) Thin-section views of the inoceramid prismatic microstructure in grey limestone of the lower Maastrichtian section (crossed nicols). (b, d) The same sections under CL, where it is seen how they are partially affected by diagenesis with luminescence in yellow and reddish colours; the central part remains unaltered and non-luminescent. The prisms grow downwards from the outer shell layer (OSL) to the inner shell layer (ISL), as indicated by the white arrows. The host rock (Hr) consists of a mudstone with foraminifer shells and bioclasts. (e) Thin-section view of a grey limestone from the Maastrichtian section (Member II) with planktonic foraminifers, where part of the chambers is infilled by framboidal pyrite crystals (parallel nicols). (f) Thin-section view of the Danian white limestone where the opaque ore surrounds the equant sparry calcite crystals in the chambers. (g, h) Thin-section views of the Danian pink limestone where the calcite fillings of the globigerinid chambers are surrounded by ferromagnesian clays/iron oxides (parallel nicols).

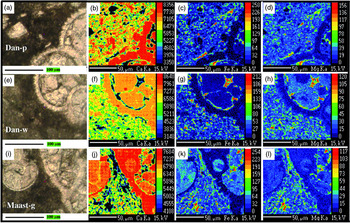
Fig. 8. (a–i) Elemental maps (Ca, Fe, Mg) using an energy-dispersive X-ray spectroscopic instrument, made in three thin-sections belonging to the (a–d) Danian pink (Dan-p), (e–h) Danian white (Dan-w) and (i–l) lower Maastrichtian grey (Maast-g) lithologies. The presence of Ca is predominant in the sections of the foraminifers and in the sparitic cement that fills the chambers. The other elements (Fe, Mg) are arranged in the intercrystalline areas with a higher concentration, indicative of the presence of illite–smectite–chlorite clays, in both the grey-white and pink lithologies. There are areas where the Fe content is predominant, and these regions are interpreted as being where the oxyhydroxides were initially concentrated (now hematite in Dan-p).
5.c. Upper Maastrichtian sections (Sopelana beach cliff)
In Member IV, where inoceramid bivalves are extinct, three small sections were studied (Figs 4a, 5a). Section UM1, of 2.67 m thickness and comprising six marl–limestone couplets with mean values of 20.3 cm thickness for purple marl subcouplets and 17.5 cm thickness for yellowish-grey limestone subcouplets, produces an average sedimentation rate of 2.4 cm ka–1. This UM1 section reveals a greater compositional contrast, with c. 20% CaCO3 difference between the purple marl subcouplets (n = 48; mean value 48% CaCO3) and the yellowish-grey limestone subcouplets (n = 83; mean value 65% CaCO3). Couplets 1, 2 and 3 show greater differences whereas couplets 5 and 6 are more continuous in their composition (Fig. 4a, b; Table 1).
In the same Sopelana cliffs, section UM1 was complemented with another, smaller section, UM1*, with similar lithological characteristics (Fig. 5a). Two complete marl–limestone couplets with a total thickness of 1.39 m were chosen for analysis. These correspond to 53 cm thickness for the two purple marl subcouplets and 86 cm thickness for the two yellowish-grey limestone subcouplets. The average sedimentation rate is 3.5 cm ka–1. The calcimetric analyses of the yellowish-grey limestones (n = 38) showed a mean value of 71.5% CaCO3, and of the purple marls (n = 24) a mean value of 48.4% CaCO3 (Table 1; Fig. 5a, b, a*). The resulting compositional contrast (> 20%) is similar to that obtained in section UM1.
Section UM2 is 3.60 m in thickness and contains five thicker marl–limestone couplets, with an average thickness of purple marl subcouplets of 38.6 cm and of purple limestone subcouplets of 33.4 cm, with a general detrital contribution noteworthy for its high sedimentation rate (3.6 cm ka–1). The high-resolution calcimetric analysis shows a lower average compositional contrast (c. 10%) between the purple marl subcouplets (n = 68; mean value 45% CaCO3) and the purple limestone subcouplets (n = 82; mean value 55% CaCO3), with a more regular curve visible at couplets 4, 5, 6 and 7. The low CaCO3 contents of the purple limestones indicate that it is more appropriate to define them as marly limestones from now on. The differences between the last values of the marl subcouplets and the first of the marly limestone subcouplets are minimal. Couplet 8 marks a change in this trend (Fig. 3a, c, d; Table 1).
The XRD analysis reveals the presence of hematite in the insoluble concentrate of both purple lithologies. The SEM analysis shows how the carbonate matrix, although cushioned by cementation and compaction, is composed of innumerable coccolith fragments grouped together with illites, such as detrital micas (Fig. 5d, e).
5.d. Danian section (Sopelana beach cliff)
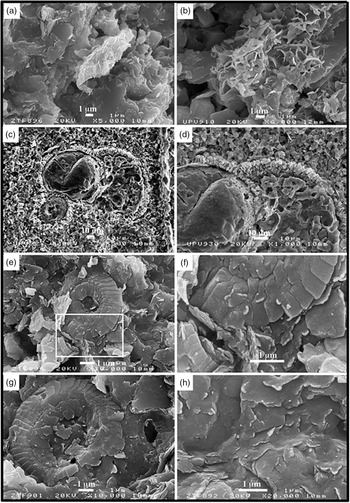
The investigated section, of 3.71 m thickness and comprising 16 continuous marl–limestone couplets, highlights the extreme thinness of the pink marl subcouplets compared with the pink limestone subcouplets (Fig. 6a, b). The average thickness of the limestone subcouplets (19 cm) is much higher on average than that of the marl subcouplets (6.4 cm). The average sedimentation rate is lower (1.2 cm ka–1) than the average value for the Maastrichtian sections discussed above. In the high-resolution calcimetric analysis (c. 1 cm per sample) of the marl–limestone couplets, high calcium carbonate contents are observed for the pink and some bleached limestone subcouplets (n = 317; mean value of 89% CaCO3) compared with the low values in the pink marls (n = 11; mean value of 39% CaCO3) (Fig. 6e; Table 1). The XRD analysis of the pink limestones and the pink marls confirms the presence of hematite in both lithologies in the insoluble concentrate (Fig. 6d). In order to obtain elemental maps (Ca, Fe, Mg) and determine the presence of ferromagnesian clays in the intercrystalline zones, an energy-dispersive X-ray spectroscopic instrument was used (Fig. 8a–h). The SEM analysis shows how the carbonate matrix, although distorted by cementation and compaction, is composed of innumerable coccolith fragments with evidence of bacterial activity (Fig. 9e–h).

Fig. 9. SEM images of whole-rock samples. (a, b) Larger detrital mica in the process of diagenetic alteration and an aggregate of illite–smectite (I-S) mixed layer (R1) in the calcareous ooze from the Danian section. (c, d) General appearance and detail of the chambers of a planktonic foraminifer filled by sparry cement. (e, h) Views and details of the calcareous ooze formed by coccolith plates and ferromagnesian clays, with evidence of nanobacterial activity in both.
6. Discussion
The International Geoscience Programmes 463, 494 and 555 (2002–2010) allowed a substantial advance in our knowledge of Cretaceous ORBs, including specific studies on chronostratigraphy, sedimentology, mineralogy, elemental and isotopic geochemistry, as well as establishing possible palaeoclimatic and palaeoceanographic relationships between OAEs and Cretaceous ORBs (e.g. Hu et al. Reference Hu, Jansa, Wang, Sarti, Bak, Wagreich, Michalik and Soták2005; Wagreich & Krenmayr, Reference Wagreich and Krenmayr2005; Wang et al. Reference Wang, Hu, Sarti, Scott and Li2005; Chen et al. Reference Chen, Wang, Hu, Huang, Wang, Jansa and Zeng2007; Cai et al. Reference Cai, Li, Hu, Chen and Pan2009). These investigations were published as SEPM Special Publication no. 91 (Hu et al. Reference Hu, Wang, Scott, Wagreich and Jansa2009) and later summarized by Hu et al. (Reference Hu, Scott, Cai, Wang and Melinte-Dobrinescu2012). Subsequently, this research was expanded upon by other works (e.g. Gambacorta et al. Reference Gambacorta, Bersezio, Weissert and Erba2016; Ahmed et al. Reference Ahmed, Tamar-Agha and Alwan2017; Song et al. Reference Song, Jiang, Poulton, Wignall, Tong, Song, An, Chu, Tian, She and Wang2017). In summary, the sedimentological, mineralogical and geochemical data suggest that the ORBs were deposited in oligotrophic conditions of cold, oxygenated waters with a low sedimentation rate (Wang et al. Reference Wang, Hu, Huang, Wagreich, Scott and Hay2011). The presence of minerals such as nano-grains of ferric minerals that were later all transformed into hematite, goethite and calcite containing Mn2+ during early diagenesis is the cause of the homogeneous pigmentation of the red beds (Eren & Kadir, Reference Eren and Kadir1999; Wang et al. Reference Wang, Hu, Huang, Scott, Wagreich, Hu, Wang, Scott, Wagreich and Jansa2009; Cai et al. Reference Cai, Hu, Li and Pan2012; Hu et al. Reference Hu, Scott, Cai, Wang and Melinte-Dobrinescu2012).
However, other investigations suggest additional mechanisms capable of producing red stains in the carbonate materials. Specifically, in the Pennsylvanian red intervals across a well-exposed carbonate slope (Sierra del Cuera, Asturias, NW Spain), the red staining is considered to be the result of iron oxidation that occurred during early diagenesis, taking place within the upper decimetres to metres of the sediment column and driven by suboxic porewaters. This likely involved iron-oxidizing bacteria, while the iron source is attributed to continental influx (Van der Kooij et al. Reference Van der Kooij, Immenhauser, Steuber, Hagmaier, Bahamonde, Samankassou and Merino Tomé2007). Van der Kooij et al. (Reference Van der Kooij, Immenhauser, Steuber, Hagmaier, Bahamonde, Samankassou and Merino Tomé2007, table 1 and fig. 1) compare different locations in Europe and Australia from early Cambrian to Cretaceous in age, with varied carbonate lithologies and depositional environments such as continental shelf, distal carbonate ramp and deepwater basin, noting possible staining mechanisms such as bacterially mediated oxidation (Della Porta et al. Reference Della Porta, Mamet, Préat and Wong2003; Mamet & Préat, Reference Mamet and Préat2006).
Along these same lines, the petrographic and sedimentological study of the Rosso Ammonitico Veronese (Middle–Upper Jurassic, NE Italy) is complemented using classic microscopy, cathodoluminescence and SEM techniques (Préat et al. Reference Préat, Morano, Loreau, Durlet and Mamet2006). These authors consider that the red colour is due to bacterially mediated precipitation of iron oxyhydroxides at the water–sediment interface, but under dysoxic–anoxic conditions. Subsequently, these oxyhydroxides were completely transformed into hematite during diagenesis (neomorphism and recrystallization), producing a homogeneous red matrix. Although not mentioned by the authors, it is interesting to verify that, in the few δ18O values provided (Préat et al. Reference Préat, Morano, Loreau, Durlet and Mamet2006, table 1, Voltascura and Forte Campo di Lucerna sections), it can be observed how, in spite of the subsequent diagenesis undergone, the mean values of the red materials are slightly higher (δ18O = −0.67‰; −0.82‰) than the mean values of the pink (δ18O = −1.17‰; −0.98‰) or grey carbonate matrix (δ18O = −1.88‰; −1.05‰). In our opinion, this indicates that the isotopic signal has been partially maintained and that the red facies were generated in association with cooler temperatures, gradually becoming warmer in the grey facies.
6.a Collected evidence
6.a.1. Lower Turonian section
This red marl event includes 11 thin grey carbonate turbidites (2–5 cm) with bleaching in the red marls both towards the top and the bottom of the calcarenite turbiditic beds (Fig. 2a–d). The preservation of the turbidite’s grey colour is accounted for by an almost instantaneous sedimentation, which prevented oxidation of its components during rapid deposition. However, the turbidites may contain enough organic matter to decompose in the oxidizing environment once deposited. The result is a limited reducing zone that solubilizes and leaches the Fe3+ iron oxyhydroxides already present in the red marls until they are bleached, just in the area of influence of the reducing environment. The marl bleaching is more powerful in contact with the bottom than in the turbidite top. If the red colour had occurred during burial diagenesis, once sedimentation was over it would have coloured the marls the same as the carbonate turbidite beds in an ongoing homogenizing process. This bleaching effect in reddish sections due to the presence of turbidite beds seems to be common in many European sections, and has been reported in graph form by different authors (Jansa & Hu, Reference Jansa, Hu, Hu, Wang, Scott, Wagreich and Jansa2009, fig. 1D, p. 61; Wagreich et al. Reference Wagreich, Neuhuber, Egger, Wendler, Scott, Malata, Sanders, Hu, Wang, Scott, Wagreich and Jansa2009; fig. 5C, p. 77; Skupien et al. Reference Skupien, Bubík, Svábenická, Mikulás, Vasícek, Matysek, Hu, Wang, Scott, Wagreich and Jansa2009, fig. 8A, p. 108), although its significance has not been explained in depth.
6.a.2. Lower Maastricht
If we assume a constant rate of sedimentation and similar thickness for the marl–limestone couplets, the colour difference must be due to higher oxygen content in the bottom waters and, therefore, a drop in the Fe2+/(Fe2++Fe3+) ratio. It is generally accepted that, for greenish-yellow facies, the ratio for Fe2+/(Fe2++Fe3+) could be higher than 0.5, whereas for red facies the Fe2+ has almost completely altered to Fe3+, with a ratio of c. 0–0.3 (see Stow, Reference Stow2005, p. 121).
Epibenthic fauna are affected by the oligotrophic conditions and highly oxic palaeoenvironment, suggested by the scarce presence of small, thin inoceramid shell fragments (thickness < 1 mm) compared with the large (> 20 cm) and thick (6 mm) inoceramids below in the less oxygenated grey facies (Fig. 3b, b*). This interpretation suggests that the oxidizing and cold-water conditions on the seafloor limited the development of such organisms.
On the other hand, evidence of a very early decomposition of organic matter is denoted by both mottled burrows (Fig. 3e) and Zoophycos tracings (Fig. 3f), as well as by the scant echinoid macrofossils recognized (Fig. 3g). The early decomposition causes visible bleaching in the limited red area affected. We deduce that the destruction in situ of the organic matter, from a living organism, produced a bleached spot (in the sense defined by Tyrell, Reference Tyrell1926 and collected in the Glossary of Geology, American Geological Institute). Such a reducing microenvironment is capable of leaching ferric iron and generating hydrogen sulphide, which very occasionally produces small framboidal pyrite crystals (FeS2). In addition, subsequent brittle fractures in the marl–limestone couplets of the red facies are of note since reducing fluids circulate and cause bleaching unevenly within the zone of influence of the fractures (Fig. 3h); in contrast, although fracturing is present in the grey facies, it is not marked by a change in colour.
A comparison of the isotope values in the grey, greenish-yellow and red materials, as well as in the inoceramid prisms in the El Peñón section, reveal that the red and greenish-yellow materials have higher δ18O values (mean value δ18O = −1.90‰) compared with the lighter-grey materials (mean value δ18O = −2.25‰). All these values indicate that the trend of the palaeoenvironmental signal (cooler in the red facies than in the grey facies; Wang et al. Reference Wang, Hu, Huang, Wagreich, Scott and Hay2011) continues, although modified by burial diagenesis. With respect to the values of the grey facies inoceramids, there is an opposite trend since these values are higher (mean value δ18O = 0.38‰) than those in the red facies (mean value δ18O = 0.12‰). This difference can be explained by the scant thickness (< 1 mm) of the red facies inoceramids, which have been completely affected by diagenesis; in contrast, in the grey facies inoceramids (6 mm thick), the central parts have remained less affected and the average isotope signal is therefore higher (Table 1, Fig. 7a–d).
It is worth noting that the record of the boreal inoceramid Spyridoceramus tegulatus (Hagenow, 1842), which coincides with the positive δ18O excursion, suggests the entry of deep, cold, oxygenated waters from the North Atlantic. These observations confirm the modification of the thermocline and the distribution of oxygen content in the ocean water column and the onset of climatic cooling around the time of the early–late Maastrichtian boundary, which might have been one of the main causes of the disappearance of inoceramids in the Basque Arc Domain (Gómez-Alday et al. Reference Gómez-Alday, López and Elorza2004).
6.a.3. Upper Maastrichtian
The abrupt colour change from the grey Member II to the purple Member III in the transition from the lower to the upper Maastrichtian section (Fig. 4a) is a good example of palaeoceanographic changes occurring quickly in the shift from a highstand systems tract (HST) (Member II, grey facies, biozone G. gansseri) to a lowstand systems tract (LST) (Member III, red facies, biozone A. mayaroensis) (MacLeod, Reference MacLeod1994; Pujalte et al. Reference Pujalte, Robles, Orue-Etxebarria, Baceta, Payros and Larruzea2000; Gómez-Alday et al. Reference Gómez-Alday, López and Elorza2004).
Already in Member IV, on the scale of the couplet, when passing from yellowish-grey limestone to purple marl in the marl–limestone couplets, there is a clear, abrupt change (Figs 4a, b, 5a, b). The compositional similarity revealed by XRD (except for the presence of hematite) between the yellowish-grey limestone and purple marl (section UM1) and purple marly limestone and purple marl (section UM2) (Fig. 4a) suggests the same origin of the deposit and that the change in colour occurs during the sedimentation of fundamentally calcareous ooze (coccolithophorids, planktonic foraminifera and ferromagnesian clay remains such as illite and smectite) from the warm surface waters during the Cretaceous greenhouse climate. Recall that the main original components of the limestones, as observed by SEM, are coccolithophorids and detrital clays (Fig. 5d, e) and, in oxygenated and cooler waters with higher viscosity, the sedimentation rate slows down (Stokes’ Law); this is why it can more effectively allow the transition from Fe2+ to Fe3+. Subsequent burial diagenesis causes the coccoliths, formed of individual plates of calcium carbonate, to partially dissolve, creating micritic cement crystals that bind them together to form the mudstone–wackestone observed in the marl–limestone couplets.
In section UM2, the range of average %CaCO3 values between the purple marl and the purple marly limestone is significantly small (10%) and sedimentation rates are high (3.6 cm ka–1). These mean values do not coincide with the idea advocated for the Cretaceous ORBs as probably being characterized by a low sedimentation rate (e.g. Hu et al. Reference Hu, Scott, Cai, Wang and Melinte-Dobrinescu2012). These marked differences between compositional contrast and average sedimentation rate likely reflect a change from more drastic palaeoenvironmental conditions (rainy versus longer dry periods) to a predominance of wet rainy periods, with increased terrigenous material input and less seasonality (Einsele, Reference Einsele, Einsele and Seilacher1982; Arthur et al. Reference Arthur, Dean, Bottjer, Scholle, Berger, Imbrie, Hays, Kukla and Saltzman1984; Einsele et al. Reference Einsele, Ricken and Seilacher1991; MacLeod et al. Reference MacLeod, Huber, Pletsch, Röhl and Kucera2001; Giorgioni et al. Reference Giorgioni, Weissert, Bernasconi, Hochuli, Cocción and Séller2012; Jiménez Berrocoso et al. Reference Jiménez Berrocoso, Elorza and MacLeod2013).
The purple colour, without reaching red tones, can be well accounted for by: (1) a higher sedimentation rate that does not allow a complete oxidation to red tones during settling to the bottom, despite a high oxygen content of the water mass; or (2) on the contrary, the presence of less oxygenated and more temperate waters, unable to completely oxidize the Fe2+ during sedimentation, resulting in purple marl–limestone couplets with Fe2+/(Fe2++Fe3+) values of 0.3–0.5 (Stow, Reference Stow2005).
6.a.4. Danian section
The palaeogeographic reconstruction of the western Pyrenean area during the Maastrichtian–Paleocene and stratigraphic profiles made by certain authors (Pujalte et al. Reference Pujalte, Robles, Orue-Etxebarria, Baceta, Payros and Larruzea2000; Baceta et al. Reference Baceta, Pujalte, Serra-Kiel, Robador, Orue-Etxebarria and Vera2004) confirm substantial colour differences in materials of the same age but from different environments. During the Danian Age, the shallow limestones that formed on a carbonate platform setting (Lizarraga section, Navarra) and the breccias and turbidites that formed on a carbonate slope-apron (section of Aixola, Ermua, Gipuzkoa) are therefore all greyish-white. In contrast, the limestones and hemipelagic marls corresponding to a deep-marine basin setting (Zumaya section, lateral equivalent to the Sopelana section) have the characteristic pink colours (Fig. 1c). This suggests that the triggering factor for pink colouring is likely in the palaeoenvironmental conditions that dominate the basin bottom (cold, oxygenated waters), which do not occur in shallower environments of the same age (carbonate platform and slope-apron), despite having also undergone appreciable diagenetic compaction and recrystallization.
Other evidence on the partial preservation of the palaeoenvironmental signal in the marl–limestone couplets of the Sopelana sections is confirmed by examining the isotopic oxygen values of the lower Maastrichtian and Danian couplets obtained by Jiménez Berrocoso et al. (Reference Jiménez Berrocoso, Elorza and MacLeod2013). The lower Maastrichtian grey marls have a mean value of δ18O = −3.15‰ (n = 27) versus limestones δ18O = −3.46‰ (n = 42), whereas the Danian pink marls have an average value of δ18O = −1.97‰ (n = 22) and the pink limestones an average of δ18O = −2.27‰ (n = 28). These results support the authors’ suggestion that, at the level of Milankovitch precession cycles, during the deposition of marls, temperatures were lower (a rainier, colder climate), with a higher detrital contribution from the continent, and with an increase in temperature during the deposition of the calcareous ooze (warmer and drier climate). In turn, the δ18O average values of the Danian pink marls and limestones are higher (cooler) than in the lower Maastrichtian grey limestones and marls (warmer).
In the Danian section, at the subcouplet scale, it is even detectable how a white limestone bed at the base changes to pink limestone in the middle of the bed, with a clear separation parallel to planar stratification, to continue with a pink marl (Fig. 6a–c, e). Further, a yellowish-grey marl at the base becomes pink towards the top bed and continues with a pink limestone subcouplet, in the image partially covered due to humidity by current green algae (Fig. 6c, e). Strong bioturbation (Planolites) recorded in the lower Maastrichtian grey marls and the Danian pink marls also provides an insight into their different settings. In the grey marls, fossil traces remain darker than sediment (Fig. 6f), proof that the environment did not have enough oxidative capacity to break down the organic matter provided by the organism; in contrast, in the pink marls the fossil traces are bleached (Fig. 6g) by substantial organic matter oxidation.
6.b. Burial diagenesis and partial preservation of the palaeoenvironmental signal
In thick Cretaceous and Paleocene sedimentary series, such as those produced in the Basque–Cantabrian Basin, there is no doubt that early and burial diagenesis occurred with different degrees of intensity, according to the height of the selected column as well as its location with respect to the depocentre or the lateral zones of the basin (Arostegui et al. Reference Arostegui, Zuluaga, Velasco, Ortega-Huertas and Nieto1991, Reference Arostegui, Sangüesa, Nieto and Uriarte2006; Ortega-Huertas et al. Reference Ortega-Huertas, Martínez-Ruiz, Palomo and Chamley1995; Sangüesa et al. Reference Sangüesa, Arostegui and Suarez-Ruiz2000). Published works on the diagenetic activity in the marl–limestone grey couplets of the lower Maastrichtian section demonstrate their effects by variations in luminescence and isotopic changes that are determined both in thick-shelled epibenthic inoceramid organisms as well as in the grey marl–limestone couplets themselves. Illite is the most abundant clay mineral (< 2 μm), reaching a mean value of about 58%, followed by chlorite (13%) and kaolinite (11%). The illite–smectite (I-S) mixed layers (R1, 17% illite) and δ18O (−2.89‰ PDB) also indicate diagenetic alteration (Fig. 9a, b) (Gómez-Alday et al. Reference Gómez-Alday, Zuluaga and Elorza2008).
These same trends of diagenetic alteration in inoceramids and deep-marine sediments are also detected in grey materials from the Coniacian–Santonian sections of the Basque–Cantabrian Basin. The transformations of the clay minerals have been recognized with more diagenetically advanced illite–smectite (I-S) mixed layers (R1, 70% illite), authigenic chlorite and low δ18O (−4.05‰ PDB) in the Barrika section (deep-marine basin) versus the platform-marine (Isla de Castro, Villamartín and Olazagutía) settings (Fig. 1a, c). All these transformations are good indicators of the diagenetic activity undergone by these sediments, which reached burial depths of up to 6–9 km (Jiménez Berrocoso et al. Reference Jiménez Berrocoso, Zuluaga and Elorza2004, Reference Jiménez Berrocoso, Zuluaga and Elorza2008).
However, despite having undergone greater or lesser degrees of diagenetic alteration, the palaeoenvironmental signal can still be detected, preserved in inoceramid shells under CL (Fig. 7a–d), oxygen isotopes, mean 87Sr/86Sr isotope ratios (0.707819 ± 0.000003 (2σ, n = 8) and also in the sediments, although in more attenuated form, in very favourable conditions (Gómez-Alday et al. Reference Gómez-Alday, López and Elorza2004, Reference Gómez-Alday, Zuluaga and Elorza2008). The vertical distribution and variability of the clay minerals (< 2 μm) observed is therefore not likely to be the exclusive product of their diagenetic transformation; at 25–40 m, the sediment thickness is not enough to record notable changes in diagenetic gradients between the bottom and the top of the recognized stratigraphic sections. Instead, tectonosedimentary causes related to unsuitable conditions for clay formation and transport from the local source areas contributed to the original clay differences (Jiménez Berrocoso et al. Reference Jiménez Berrocoso, Zuluaga and Elorza2008). Finally, Jiménez Berrocoso et al. (Reference Jiménez Berrocoso, Elorza and MacLeod2013) considered that the fine-scale (2 cm per sample) geochemical and sedimentological (%CaCO3, δ18O and δ13C) records of calcareous couplets challenge purely diagenetic explanations. The lower Maastrichtian transition to a transgressive system tract therefore favoured a greater influence of oceanic processes in the depositional setting, whereas a relatively cool, oxygen-rich water mass with high oxidation potential influenced the geochemical and depositional patterns of Danian couplets. In other words, the geochemical and sedimentological patterns of these calcareous couplets were caused by the interplay of climate, palaeogeography and oceanography as forcing mechanisms.
6.c. End-Cretaceous North Atlantic Ocean circulation
To explain the cooling detected by the oxygen isotope signal during the early Maastrichtian Age and the presence of the boreal inoceramid Spyridoceramus tegulatus, Gómez-Alday et al. (Reference Gómez-Alday, López and Elorza2004) suggest that there is a change in the type of thermohaline circulation due to the entry of deep, cold waters from high latitudes that results in greater temperature stratification in the oceans. Apparently, the origin of these deep, cold waters varied throughout the Maastrichtian Age. Up to the lower–upper Maastrichtian boundary, the ocean floor was occupied by saline and warm oxygen-poor waters with an origin in the vast epicontinental seas of the globe. During this boundary period, deep, cold and dense waters formed in the polar regions and reached low latitudes to form the intermediate and deep waters of the tropics (Saltzman et al. Reference Saltzman, Barron and Price1982; Barron et al. Reference Barron, Saltzman, Price, Hay and Sibuet1984; MacLeod et al. Reference MacLeod, Isaza Londoño, Martin, Jiménez Berrocoso and Basak2011; Huber et al. Reference Huber, MacLeod, Watkins and Coffin2018). Further, Gambacorta et al. (Reference Gambacorta, Bersezio, Weissert and Erba2016) defend the same idea: “…although the paleotemperature reconstructions are still loose, reddish lithologies corresponding to times of relatively cooler conditions might indicate a mechanism of deep water formation different from saline waters at low-latitude characteristic of warm climatic conditions. Possibly, during times of decreasing temperature after warming episodes, cooler oxygen richer bottom water masses originated at higher latitudes.”
6.d. Iron source and distribution of Fe3+ in the sediment
Riverine, atmospheric, iceberg, hydrothermal and diagenetic recycling are thought to be the main iron (Fe) sources in oceans (Raiswell & Canfield, Reference Raiswell and Canfield2012). Iron in the environment exists in two redox states: Fe2+ and Fe3+ . The abundance of each iron form depends on the pH/Eh conditions in which the Fe species are thermodynamically more stable. Through enzymatic activity, bacteria can catalyse redox reactions. In the oceans, dissolved Fe concentrations can be as low as 0.02–2 nM in oxygenated waters and as high as 300–3000 nM in anoxic waters (De Baar & De Jong, Reference De Baar, De Jong, Turner and Hunter2001). Gledhill & Buck (Reference Gledhill and Buck2012) point out that about 99.9% of dissolved Fe3+ in seawater is bound to organic molecules as Fe-binding ligands (FeL); the mean maximum FeL concentration can reach c. 4 nM. The existence of FeL explains why Fe3+ is retained in solution instead of forming iron (oxyhydroxide) precipitates. Dissolved Fe2+ appears at very low concentrations in oxic seawater due to rapid oxidation by its two main oxidants, oxygen (O2) and hydrogen peroxide (H2O2). Organic ligands can also stabilize Fe2+ , which may circumvent the rapid transformation to oxyhydroxides (Breitbarth et al. Reference Breitbarth, Achterberger, Ardelan, Baker, Bucciarelli, Chever, Croot, Duggan, Gledhill, Hasselhov, Hoffmann, Hunter, Huthins, Ingri, Jickells, Lohan, Nielsdottir, Sarthou, Schoemann, Trapp, Turner and Ye2010). Consequently, Fe2+ and Fe3+ can be either inorganic or complexed to dissolved organic compounds.
Biogenic iron concentrations in surface waters constitute an important pool of Fe since this element is a limiting nutrient for phytoplankton. Inorganic Fe3+ is more available for biota than organic Fe-bearing complexes, but primary producers establish mechanisms for taking up aqueous Fe3+ species as well as solubilizing iron (oxyhydroxides). The transformation of organic matter to simpler dissolved organic compounds during sinking may play a role in the speciation and complexation of Fe2+ . Under oxygen-deficient conditions, as described by Heller et al. (Reference Heller, Lam, Moffett, Till, Lee, Toner and Marcus2017) in modern ocean oxygen-minimum zones, the regeneration of Fe2+ contained in organic matter can be coupled to microbially mediated nitrate (NO3−) and reduction to nitrite (NO2−). Fe3+ formation, and the subsequent hydrolysis and precipitation of oxyhydroxides, may therefore take place within the water column. Fe contained in Fe-bearing minerals can be released through diffusive outflow from sediment pore water to the water column (Raiswell & Canfield, Reference Raiswell and Canfield2012). For instance, Fe can be carried by clay minerals, either as part of the clay structure or, highly important, as oxide films on the surface of clays (Tucker, Reference Tucker1994). The microbial reduction of iron oxyhydroxides during the decomposition of organic matter (Noffke et al. Reference Noffke, Hensen, Sommer, Scholz, Bohlen, Mosch, Graco and Wallmann2012), for example, produces dissolved Fe2+ in high concentrations in oxygen-depleted marine sediments. If the overlying water contains oxygen, reduced Fe2+ is oxidized by O2 or H2O2 to Fe3+, which forms oxyhydroxide precipitates.
In our case, traditional microscopy reveals that the iron forms aggregates of framboidal pyrite on the edges of the microsparite crystals that fill the chambers of the foraminifers encased in the grey limestones of the lower Maastrichtian (Fig. 7e). However, such pyrite formations do not occur in the Danian white limestones (Fig. 7f). In contrast, it can be seen how, in the filling of the foraminifer chambers of the Danian pink limestone, the microsparite cyrstals are covered by iron oxides/ferromagnesian clays (Figs 7g, h, 9c, d). This difference seems to indicate the lack of incorporation of the iron into the microstructure of the microsparite–sparite as a product of the neoformation–diagenetic recrystallization.
The elemental maps (Ca, Fe, Mg) were examined using an energy-dispersive X-ray spectroscopic instrument on three thin-sections belonging to the Danian pink and white (Dan-p; Dan-w) and Maastrichtian lower grey (Maast-g); the examination reveals that Ca is the dominant element in the foraminifer sections and in the sparitic cement that fills the chambers. The other elements (Fe, Mg) are arranged in the intercrystalline areas with a higher concentration, indicative of the presence of ferromagnesian clays (illite–smectite–chlorite) in both the grey-white and pink lithologies. There are areas where Fe predominates and can be interpreted as belonging to oxyhydroxides (later hematite in Dan-p); or (later pyrite in Dan-w/Maast-g) although, because of the size of the possible crystals (< 10 nm) found by Cai et al. (Reference Cai, Hu, Li and Pan2012) in Vispi Quarry limestones, the resolution of our image does not allow us to directly observe the crystals (Fig. 8).
Bacterial activity was certainly a factor in the development of the pink colour of the Danian couplets (Fig. 9e–h); however, in the absence of more precise studies, it cannot be considered the primary cause of the red colouring in the case of the Basque–Cantabrian Basin, even though other authors consider iron-oxidizing bacteria to be the main cause of such tones in their studies on other areas (Mamet et al. Reference Mamet, Préat and De Ridder1997; Della Porta et al. Reference Della Porta, Mamet, Préat and Wong2003; Mamet & Préat, Reference Mamet and Préat2005, Reference Mamet and Préat2006; Préat et al. Reference Préat, Morano, Loreau, Durlet and Mamet2006, Reference Préat, De Ridder and Gillan2018; Van der Kooij et al. Reference Van der Kooij, Immenhauser, Steuber, Hagmaier, Bahamonde, Samankassou and Merino Tomé2007; Song et al. Reference Song, Jiang, Poulton, Wignall, Tong, Song, An, Chu, Tian, She and Wang2017). Nanobacteria with coalescent structure forms (< 0.1 μm) thrive in the superficial part of the coccolith plates and ferromagnesian clays, with a strong similarity to those reported by Mamet & Préat (Reference Mamet and Préat2006, fig. 1A), Préat et al. (Reference Préat, Morano, Loreau, Durlet and Mamet2006, fig. 8C–F).
As a result of the points discussed above, we discard the notion that reddish-pink to greenish-yellow tones are the main product of early diagenesis, as claimed by other authors (Eren & Kadir, Reference Eren and Kadir1999; Hu et al. Reference Hu, Jansa, Wang, Sarti, Bak, Wagreich, Michalik and Soták2005, Reference Hu, Scott, Cai, Wang and Melinte-Dobrinescu2012; Jansa & Hu, Reference Jansa, Hu, Hu, Wang, Scott, Wagreich and Jansa2009) in the Cretaceous ORBs of the Tethysian and North Atlantic basins. We are in favour of a synsedimentary process, where the deposition of the calcareous ooze involved mainly coccolithophorids, planktonic foraminifers and ferromagnesian clays derived from the oceanic surface and continental sources, and was sedimented towards the sea bottom through cold, oxygenated waters. These waters are not only available at different heights of the water column, but can reach the sea bottom and remain for long enough for oxidation to occur (MacLeod et al. Reference MacLeod, Isaza Londoño, Martin, Jiménez Berrocoso and Basak2011). The coating of the calcareous particles by oxyhydroxides during the slow sedimentation was conditioned by a lower temperature of the oxidizing waters and the availability of Fe2+. The different red, pink and greenish-yellow colours may be determined by the sedimentation rate and/or oxidation capacity of the water mass. The red colour in the marl–limestone couplets was already present before the organic decomposition of echinoids, and the trace markers of ichnofossils such as Planolites and Zoophycos, was able to generate a reducing zone, with centimetric extension and bleaching of both the limestones and the marls (Fig. 3e–g). Even the presence of grey carbonate turbidites included in red marls indicates that the process is of synsedimentary origin and did not occur during burial diagenesis (Fig. 2b, c).
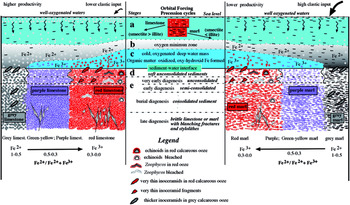
We have attempted a simplified model with the differentiated vertical marine stages represented schematically (Fig. 10), as well as possible variations in temperature and oxidation capacity of the water mass, which allows us to distinguish at least five types of couplets according to their variable colouring (Table 3).

Fig. 10. Deep-facies depositional model for the formation of the marl–limestone couplets belonging to the Maastrichtian and Danian sections at the Sopelana beach cliffs. They depend on the residence time that the foraminifers and coccolith debris and the ferromagnesian clay minerals spent passing, or not, through occasional masses of cold, oxygenated water to reach the sea bottom. The unconsolidated deposits acquire different shades of grey to greenish-yellow, purple, pink and finally red. These colours are generated during synsedimentary deposition and are interpreted as a depositional feature.
Table 3. Possible conditions (temperature and oxidation capacity) of water mass at the seafloor for the five cases proposed to explain colouring in the marl–limestone couplets.

6.e. First possibility during sedimentation (stages (a) and (b))
Particles settling until reaching the basin bottom pass through different stages. (a) This stage ranges from the marine surface, where lesser or greater organic seasonal productivity occurs, to the oxygen minimum zone (OMZ), with a part of the organic matter still preserved. A greater or lesser contribution of clastic materials determines the subsequent formation of marls or limestones controlled by processional cycles (Fig. 10). (b) In the transit through the OMZ, with sufficient thickness and an appreciable lack of oxygen and light, partial decomposition of organic matter from protozoans (foraminifers, radiolarians) and algae (coccolithophores) is triggered, and Fe2+ is consequently liberated in this reducing zone. Settling continues until the basin bottom, where the residual organic matter is associated with calcareous ooze in a dysoxic environment, but always above the carbonate compensation depth (CCD). The presence of Fe2+ as pyrite (FeS2) precipitation and ferromagnesian clays can be recognized inside microforaminifer chambers (Figs 7e, 8).
As a result, substantial grey sediment formation is arranged in the marl–limestone couplets, governed by orbital precession variations (c. 20 ka), consisting mainly of a calcareous ooze component and a larger (marls) or smaller (marly limestone to limestones) concentration of inherited clays (illite–smectite, kaolinite) undergoing alteration with the liberation of cations. The presence of epibenthic organisms such as large inoceramids and ichnofossils such as Planolites and Zoophycos in both the limestones and marls is remarkable. Subsequently, burial diagenesis generated neomicrite (< 1 μm) that successively underwent recrystallization to larger particles such as micrite (< 4 μm) and microsparite (> 4 μm), and the neoformation of illite–smectite (I-S) mixed layers, chlorite and illite agregates produced the compaction–recrystallization and consequent differentiation of the couplets according to their content in clays and carbonate (Figs 3a, 4a).
6.f. Second possibility during sedimentation (stages (a–c))
Recall that it is accepted in the literature that Cretaceous ORBs were deposited in oligotrophic conditions of cold, oxygenated waters with a low sedimentation rate (Hu et al. Reference Hu, Scott, Cai, Wang and Melinte-Dobrinescu2012). In accordance with the evidence presented above, it is therefore also possible that in our basin a mass of denser-than-usual cold, oxygenated waters were incorporated from the North Atlantic Sea, possibly comprising tongues advancing and retreating on the basin bottom at temporary intervals as short-term ORBs (< 1 Ma). Stages (a) and (b) have the same characteristics as those described in Section 6.e above (first possibility), but stage (b) does not reach the sediment–water interface because the transitory arrival of colder, oxygenated water would lead to important changes in the biogeochemical cycles by modifying the extent of the OMZ. (c) The slower settling of ferromagnesian particles (Fig. 9a) and their passage through the mass of cold, well-oxygenated water allows the Fe2+ to Fe3+ to be transformed into oxyhydroxides. These can occur on the surface and interior of particles (detrital/shells) as a fine film (Tucker, Reference Tucker1994), and are deposited on the sediment–water interface as pigmented calcareous ooze.
The sediment has different colours (red, pink, greenish-yellow) depending on its settling speed and the oxygen content, and therefore the Fe2+/(Fe2++Fe3+) ratio, of the water. It is even possible to determine the appearance of the tongues of cold, oxygenated waters during the initial formation of a white-grey limestone subcouplet that ends up as a pink limestone, with the same morphological characteristics and with a slight increase in the %CaCO3 contents (Fig. 6c, e).
6.g. Soft, unconsolidated sediments (stage (d))
(d) The calcareous ooze is already pigmented at the water–sediment interface, and a significant number of epibenthic organisms are recorded, such as small, thin inoceramids, echinoids and trace fossils such as Zoophycos and Planolites. The rapid post-mortem decomposition of organic matter generated a limited reducing environment around these remains, recognizable by bleaching due to the leaching of Fe3+ (Fig. 3e–g). It is possible to differentiate between the soft unconsolidated sediments and the next phase of still unconsolidated sediments until very early diagenesis began.
6.h. Very early diagenesis and burial diagenesis (stage (e))
(e) Partial or complete dissolution of the calcareous ooze allowed neomicrite formation (< 1 μm) that successively underwent recrystallization to larger particles such as micrite (< 4 μm) and microsparite (> 4 μm). Under normal microscopy, it seems that ferromagnesian clays and iron oxides (hematite) are not substantially incorporated and do not form part of the neoformed matrix crystals (micrite–microsparite) and that, in the foraminifer chambers, these minerals surround the new sparite cement without incorporating it (Fig. 7g, h). The Fe3+ now forming nanocrystals of hematite seems to have been distributed in the matrix, but it does not become part of the sparry calcite in the filling of the foraminifer chambers. This interpretation suggests that the pigmented calcareous ooze pre-dates diagenesis as a dominant depositional feature (Fig. 8). As a result, the marl–limestone coloured couplets (red, pink, greenish-yellow) form according to the Fe2+/(Fe2++Fe3+) ratio.
6.i. Late diagenesis
This stage is evidenced by limited and irregular fracturing of the already consolidated rock with slight displacement that allows the circulation of reducing fluids and the consequent dissolution of Fe3+ recognized by the bleaching in the red facies (Fig. 3h). In the greenish-yellow layers, the bleaching is more muted and barely perceptible, but it also occurs in the El Peñón section. Another late-diagenesis characteristic of the Danian limestone subcouplets is the presence of numerous small, sutured and irregular stylolites perpendicular to the stratification surface. These are caused by a pressure–dissolution effect and are recognized at first sight by the concentration of insoluble material that highlights the suture (Fig. 6h). Analysing this concentrated residue by XRD confirms the presence of ferromagnesian micas, quartz, plagioclase and small amounts of hematite.
7. Conclusions
The ORBs present in Upper Cretaceous and Danian sections in the Basque–Cantabrian Basin are exceptional due to the presence and regularity of their marl–limestone couplets, together with the macroscopic, microscopic and geochemical evidence collected. Five types of marl–limestone couplets can be differentiated according to the exposed colouring: (1) pink-red marl versus pink-red limestone; (2) purple marl versus purple limestone; (3) greyish-yellow limestone versus purple marl; (4) steps from grey to greenish-yellow to red marl–limestone couplets; and (5) grey marl versus grey limestone. The sedimentation rate is variable, but in contrast to what is published on Cretaceous ORBs, it can be high (3.6 cm ka–1) in the coloured couplets. The oxygen isotopic signal in the lower–upper Maastrichtian and Danian sections and the presence of the boreal inoceramid Spyridoceramus tegulatus serve to confirm the presence of deep, cold, oxygenated waters surely coming from high latitudes (North Atlantic). The variation in colours is interpreted as the possible palaeoenvironmental transit of the particles, mainly calcareous nannoplankton such as coccolith plates, planktonic foraminifers and detrital clays, which settle slowly in dysoxic environments forming grey marl–limestone couplets. However, as they circulate through a cooler and more oxidizing water body, they change to greenish-yellow, purple and pink until finally reaching red tones based on the Fe2+/(Fe2++Fe3+) ratio. Hematite, considered the main staining agent, was detected by XRD together with the ferromagnesian clays. The colouring is considered a depositional factor, without discarding the possible redistribution of oxyhydroxides changing to hematite as a final product. Given the nanometric size of the hematite particles, they are difficult to detect by SEM-EDX. The shell and chamber filling of the foraminifers do not incorporate appreciable amounts of Fe and Mg during diagenesis. In the intercrystalline sparry cement, ferromagnesian clays are distributed as detected by the Ca, Fe and Mg maps. Fe in grey facies is present as Fe2+ (pyrite). Nanobacterial activity is also detected, present both in the coccolith plates and in the ferromagnesian micas, without it being possible to establish its importance in the staining process.
Acknowledgements
JE is supported by the Universidad del País Vasco/Euskal Herriko Unibertsitatea, Spain (UPV/EHU, research group GIU18/16317/05) and by the Elorza Foundation. We thank Dr Ana Pascual (UPV/EHU) for the micropalaeontological determination. We thank the anonymous referees for their comments, which have significantly enriched the contents of the manuscript. We are also grateful to Christine Laurin and Rupert Glasgow for improving the English.


 Open access