


Management Implications
To effectively manage the invasive introduced subspecies of Phragmites australis (common reed) and avoid misallocating resources, land managers require practical, reliable tools to differentiate it from the desirable native subspecies. While genetic tools are extremely useful for identification, morphological identification is a valuable complementary tool that is easier, cheaper, available in the field, and thus more accessible for many land managers and researchers. From a survey of 22 morphological measurements of native and introduced P. australis populations across southern Ontario, we identified five easy to measure traits that offer reliable discrimination between native and introduced P. australis. These traits include the presence or absence of round stem fungal spots, the presence of dark red pigmentation on lower internodes, leaf sheath retention on dead stems, ligule height, and a combined measurement of lower glume length and leaf length. We provide a checklist of these traits and recommend evaluating all measurements to help identify a specimen. Any samples for which traits are not consistent with the checklist should be evaluated further with genetic identification tools when possible. “Common wisdom” about the differences between native and introduced P. australis was often true (e.g., introduced subspecies tend to have taller, wider stems with higher stem densities); however, many populations can exhibit variation beyond these expectations, and these generalizations are not sufficient for reliable identification. Given the geographic variation in P. australis populations, this checklist of traits is most applicable for samples collected in the late summer and early fall in the Great Lakes region.
Introduction
Introduced common reed [Phragmites australis (Cav.) Trin. ex Steud.] is a tall perennial grass that forms dense, near-monospecific stands in a variety of wetland, riverine, and roadside habitats (Mozdzer et al. Reference Mozdzer, Brisson and Hazelton2013; Packer et al. Reference Packer, Meyerson, Skálová, Pyšek and Kueffer2017). Three subspecies of P. australis occur in North America (Saltonstall Reference Saltonstall2016): Phragmites australis ssp. australis Trin. ex Steud. (hereafter “introduced P. australis”) is a widespread nonnative, invasive lineage; Phragmites australis ssp. americanus Saltonst., P.M. Peterson & Soreng (“native P. australis”) is a desirable native lineage endemic to North America (Saltonstall Reference Saltonstall2002; Saltonstall et al. Reference Saltonstall, Peterson and Soreng2004); and Phragmites australis ssp. berlandieri (E. Fourn.) Saltonst. & Hauber (“Gulf Coast P. australis”) is an endemic lineage distributed along the Gulf Coast (Colin and Eguiarte Reference Colin and Eguiarte2016; Saltonstall and Hauber Reference Saltonstall and Hauber2007). In the Great Lakes Region of northern North America, only the native and introduced P. australis subspecies occur (Lindsay et al. Reference Lindsay, Freeland, Gong, Guan, Harms, Kowalski, Lance, Oh, Sartain and Wendell2023). Pollination studies indicate that the introduced and native P. australis subspecies can hybridize (Meyerson et al. Reference Meyerson, Viola and Brown2010), but hybrids have rarely been found in the field (Paul et al. Reference Paul, Vachon, Garroway and Freeland2010; Saltonstall et al. Reference Saltonstall, Castillo and Blossey2014, Reference Saltonstall, Lambert and Rice2016; Wu et al. Reference Wu, Murray and Heffernan2015).
The introduced subspecies of P. australis is considered one of the most invasive plants in Canada and is managed using physical, chemical, cultural, and biological control methods (Blossey and Casagrande Reference Blossey and Casagrande2016; Hazelton et al. Reference Hazelton, Mozdzer, Burdick, Kettenring and Whigham2014; Nichols Reference Nichols2020). Unfortunately, a lack of awareness of the subspecies or of practical tools to reliably identify them can result in accidental management of native P. australis (Hunt et al. Reference Hunt, Fant, Steger, Hartzog, Lonsdorf, Jacobi and Larkin2017), misallocating limited weed control resources and inadvertently harming desirable native flora.
Genetic tools are useful for discriminating between different P. australis lineages and are reviewed by Lindsay et al. (Reference Lindsay, Freeland, Gong, Guan, Harms, Kowalski, Lance, Oh, Sartain and Wendell2023), including a method to screen for native-introduced P. australis hybrids (Wendell et al. Reference Wendell, Huang, Gryspeerd and Freeland2021). However, for land managers, availability of genetic tools can be limited by a lack of access to laboratory resources and technical expertise, financial costs, and the challenges of proper collection and preservation of tissue samples to extract high-quality genetic material (Lambert et al. Reference Lambert, Saltonstall, Long and Dudley2016). These limitations may be particularly pronounced for community science programs (Hunt et al. Reference Hunt, Fant, Steger, Hartzog, Lonsdorf, Jacobi and Larkin2017).
Morphological identification can also be a useful approach to differentiate between P. australis lineages, supplementing genetic tools with a low- to zero-cost option that does not require specialized equipment or technical expertise (Allen et al. Reference Allen, McCormick, Jantzen, Marr and Brown2017). Phragmites australis subspecies differ in vegetative, floral, and growth properties that can be measured from P. australis specimens in the field, lab, and herbaria (Mozdzer et al. Reference Mozdzer, Brisson and Hazelton2013; Swearingen et al. Reference Swearingen, Saltonstall and Tilley2022). These differences inform various identification guides and keys based on several individual morphological measurements (e.g., Blossey Reference Blossey2003; Catling and Mitrow Reference Catling and Mitrow2011; Catling et al. Reference Catling, Mitrow and Black2007; Nichols Reference Nichols2020; Saltonstall and Hauber Reference Saltonstall and Hauber2007; Saltonstall et al. Reference Saltonstall, Peterson and Soreng2004; Swearingen et al. Reference Swearingen, Saltonstall and Tilley2022) or composite indices of multiple traits determined from principal component analysis (e.g., Allen et al. Reference Allen, McCormick, Jantzen, Marr and Brown2017).
Despite the existence of these guides, reports have emerged from land managers around the Great Lakes region of unknown P. australis populations with “unusual” traits that they worry may be hybrids (Lindsay et al. Reference Lindsay, Freeland, Gong, Guan, Harms, Kowalski, Lance, Oh, Sartain and Wendell2023; MJM, personal observation). However, genetic surveys have not detected hybrids within any of these “unusual” populations (Tippery et al. Reference Tippery, Pesch, Murphy and Bautzmann2020; Warren Reference Warren2020), suggesting that land managers are encountering normal native and introduced P. australis populations beyond their expected range of variation for the subspecies and signaling a need to improve current morphological identification tools.
At the subspecies level, routine morphological identification of native and introduced P. australis can be difficult for several reasons. First, P. australis exhibits high phenotypic variability within and across genotypes resulting from multiple introductions and haplotypes (Meyerson and Cronin Reference Meyerson and Cronin2013); seasonal changes (Allen et al. Reference Allen, McCormick, Jantzen, Marr and Brown2017; Blossey Reference Blossey2003; Catling et al. Reference Catling, Mitrow and Black2007); and environmental stress and disturbance, including management (Blossey Reference Blossey2003; Lambert et al. Reference Lambert, Saltonstall, Long and Dudley2016). Given the high degree of variation and overlap within and between subspecies, many of these traits (e.g., stem density, stem height) can be unreliable predictors of subspecies identity (Blossey Reference Blossey2003; Hunt et al. Reference Hunt, Fant, Steger, Hartzog, Lonsdorf, Jacobi and Larkin2017). Second, some traits are subjective and prone to user bias (e.g., categorical assessment of stem color or texture) (Allen et al. Reference Allen, McCormick, Jantzen, Marr and Brown2017; Saltonstall et al. Reference Saltonstall, Peterson and Soreng2004) or measurement error (e.g., ligule height) (Catling et al. Reference Catling, Mitrow and Black2007) and may be especially difficult if working from herbarium specimens that are incomplete, discolored, or damaged (Allen et al. Reference Allen, McCormick, Jantzen, Marr and Brown2017; Catling and Mitrow Reference Catling and Mitrow2011). Third, observers may be ignoring existing P. australis guides and quantitative measurements altogether—especially more complex ones—in favor of a more “common sense” or “general wisdom” approach (e.g., “introduced P. australis is taller and has higher stem density and larger patches”).
Here we report on research to identify the best morphological traits for rapid and simple identification of native and introduced P. australis. The goal was to assess traits that ideally provide good separation of introduced and native P. australis, can be quantified objectively and accurately, and are quick and easy to use. This study includes a large-scale field survey of native and introduced P. australis populations across southern Ontario, Canada, and individually compares a large group of 22 morphological traits to identify those that differ between lineages.
Materials and Methods
Phragmites australis Field Surveys
We surveyed a total of 63 sites across southern Ontario, Canada in early fall (September 2019). Sampling was conducted within a single year and season to limit other differences between populations beyond subspecies identity. Sites were chosen from a 2016 to 2017 survey of introduced and native Phragmites populations (deJonge et al. Reference deJonge, McTavish, Smith and Bourchier2022) supplemented by additional sites identified by partner organizations (Ducks Unlimited Canada), historical records (Catling and Mitrow Reference Catling and Mitrow2011), community science resources (e.g., https://www.iNaturalist.org), and opportunistic observations while traveling between sites. Of the 63 initial sites, 15 were unsuitable for sampling (private property, population no longer present, etc.) and were not included in the final study. The 48 remaining suitable sites were confirmed by subsequent genetic identification (see next section) to include 21 introduced and 27 native P. australis populations. Given the sampling approach, most sites were roadside ditches (73%), while others occurred off-road in larger marshes (21%) or in open fields (6%). The sampled sites encompassed 3.6° of latitude (42.0°N to 45.6°N) and 7.7° of longitude (74.8°W to 82.5°W). All sites were located roughly within a triangular area reaching from the Ottawa area in the northeast, down to Point Pelee in the southwest, and up to the Bruce Peninsula in the northwest.
At each replicate sampling site, five subsamples were collected to account for within-population variation. Five circular plots (0.6-m diameter, 0.28 m2) were spaced equidistantly along the navigable perimeter of each patch and ∼5 m inside each patch to minimize edge effects. Within each plot, the total numbers of living and dead stems were counted. A single random living and a single dead stem from the center of each plot was cut at ground level and removed. The total number of nodes and retained leaf sheaths were counted on the dead stems, which were then discarded. A single leaf was removed from near the top of each green stem, torn into small (∼5-cm) pieces and placed in sealed plastic bags with silica gel to preserve the samples for DNA extraction (Chase and Hills Reference Chase and Hills1991; Saltonstall Reference Saltonstall2002). The rest of the stems were folded, labeled, and placed in large paper yard waste bags for transport back to the lab (n = 5 stems per site).
Genetic Identification
A total of 272 leaf tissue samples were collected. DNA was isolated using the NucleoSpin Plant II DNA isolation kit (Macherey and Nagel GmbH & Co. KG, Allentown, PA, USA). We amplified the noncoding chloroplast region rbcL-psaI using primers 5′-TGTACAAGCTCGTAACGAAGG-3′ and 5′-TAAGCCTACTAAAGGYACG-3′ (Saltonstall Reference Saltonstall2001), and a thermal cycle program of 95 C for 4 min, 34 cycles of 94 C for 30 sec, 55 C for 1 min, 72 C for 1 min, followed by 72 C for 10 min. Sequences were aligned by eye using Geneious (v. 11.1.5; Biomatters, Auckland, New Zealand) and matched to reference locus haplotype sequences as described by Saltonstall (Reference Saltonstall2016).
Morphological Analysis
Data collected in the field were combined with measurements taken in the lab for a total of 22 characteristics described below, presented roughly in the order of measurement (Table 1). Most characteristics were selected from existing guides and literature (noted in Table 1). This resulted in the most comprehensive single list of traits for comparison to date. Unless otherwise noted, each measurement was averaged across 5 stems (one from each of five field plots) to create a mean value for each of 48 sites.
Table 1. Overview of 22 measurements taken from native and introduced Phragmites australis samples collected in southern Ontario, Canada, including measurement name, units of measurement, a general description, and literature that has used the same or similar measurements.

a Stems were sampled from 0.6-m-diameter circular plots (0.28 m2). Old and living stem density measurements (measurements 1 and 2) were counted across the whole plot, while the remaining measurements were taken from a single dead stem (measurement 3) or a single living stem (measurements 4 to 22) from the center of the plot.
Most of the measurements were conducted as outlined in the referenced guides and keys (see Table 1). Old and living stem densities, stem height, stem diameter (at the base, middle, and top of the stem), and inflorescence fullness are less common measurements but were included because they have been descriptively compared between subspecies (Nichols Reference Nichols2020; Swearingen et al. Reference Swearingen, Saltonstall and Tilley2022) and inform some of the “general wisdom” about differences between native and introduced P. australis (MJM, personal observation). All traits have been operationalized as quantitative (continuous or ordinal) data to facilitate analytical comparison, including categorical assessments of stem texture, color, and inflorescence fullness (sensu Allen et al. Reference Allen, McCormick, Jantzen, Marr and Brown2017), and we generated quantitative versions of traits that have previously been descriptive only, including the percent of leaf sheaths retained on an old stem and stem spot fungus occurrence across multiple stems.
Other measurements that have been studied or proposed but were not assessed in this study include leaf color, stem toughness, timing of senescence, rhizome biomass (Blossey Reference Blossey2003), herbivore attack rate (Allen et al. Reference Allen, Young, Bhattarai, Croy, Lambert, Meyerson and Cronin2015; deJonge et al. Reference deJonge, McTavish, Smith and Bourchier2022; Lambert and Casagrande Reference Lambert and Casagrande2007; Lambert et al. Reference Lambert, Winiarski and Casagrande2007; Park and Blossey Reference Park and Blossey2008), vegetation diversity (Swearingen et al. Reference Swearingen, Saltonstall and Tilley2022), inflorescence branch length (Allen et al. Reference Allen, McCormick, Jantzen, Marr and Brown2017), aboveground–belowground biomass ratio (Mozdzer et al. Reference Mozdzer, Brisson and Hazelton2013), rhizome internode length, and internode leaf sheath coverage (League et al. Reference League, Colbert, Seliskar and Gallagher2006). Traits were omitted if they required too much effort to easily measure (e.g., biomass, vegetation and insect diversity) and to prioritize more commonly used traits that already appear in existing guides.
While stem color is one of the most common diagnostic traits for comparing introduced and native P. australis descriptively (e.g., Blossey Reference Blossey2003; Catling and Mitrow Reference Catling and Mitrow2011; Catling and Robichaud Reference Catling and Robichaud2003; Catling et al. Reference Catling, Mitrow and Black2007; Nichols Reference Nichols2020; Swearingen et al. Reference Swearingen, Saltonstall and Tilley2022) or numerically/categorically (e.g., Allen et al. Reference Allen, McCormick, Jantzen, Marr and Brown2017), it is a highly subjective trait that can vary throughout the season (Saltonstall et al. Reference Saltonstall, Peterson and Soreng2004). Therefore, we used photographs of P. australis stems and image analysis to produce an objective, quantitative assessment of stem color and to validate the subjective categorical stem color observations. In the lab, the second-lowest complete internode was photographed against a plain white backdrop under standard indoor lighting conditions using a Canon EOS Rebel XTi/400D DSLR camera (Canon Canada Inc., Brampton, ON, Canada). Images were imported into ImageJ software (National Institutes of Health, Bethesda, MD, USA), which was then used to mask and isolate the internode tissue from the background and extract average RGB values. RGB values were then converted into the three parameters of the HSL (hue, saturation, lightness) color system using a free online tool (https://www.w3schools.com/colors). Spearman’s rank correlations for data lacking bivariate normality were used to assess the associations between the standard categorical measure of stem color and each of the three HSL parameters.
Data Analysis
For each measurement, the mean (±SD) is given along with the range for each subspecies. To assess differences in traits between the subspecies, the effects of subspecies genetic ID on each of the 22 morphological characteristics were tested using one-way ANOVA or Welch’s test for data that violated the assumption of equal variance (Welch Reference Welch1951). Both tests were run using the oneway function from R package userfriendlyscience (Peters Reference Peters2018). Multiple univariate analyses were prioritized over multivariate statistics or other data reduction techniques (e.g., Allen et al. Reference Allen, McCormick, Jantzen, Marr and Brown2017; Mozdzer et al. Reference Mozdzer, Brisson and Hazelton2013) to better address our research objective of identifying individual diagnostic traits that can be used for simple and rapid identification, ideally in the field. Omega-squared (ω2) was calculated (using the function omega_squared from R package effectsize; Ben-Shachar et al. Reference Ben-Shachar, Lüdecke and Makowski2020) as an effect size and used to rank characteristics in order of the proportion of trait variation that was explained by subspecies. We also calculated the amount of overlap in the distribution of observations for a given trait between the subspecies, that is, what percent of total observations fell within the range of data shared between subspecies.
Our univariate analyses identified a set of “primary” variables that individually provided clear discrimination between the subspecies. We then conducted a linear discriminant analysis (LDA) of the remaining variables. The objective of this supplemental analysis was to identify combinations of variables that were useful in distinguishing between the subspecies in order to confirm identifications when the primary variables were not available or were difficult to assess. Starting from the full set of variables, we removed any for which there was no overlap between the two subspecies (i.e., the primary variables). We also removed all color variables, as these are difficult to assess in the field and may vary over the course of the growing season. We assessed correlations among the remaining variables and selected a set for which no two variables had a pairwise correlation >0.8.
At the end of this process, eight variables remained: stem height, leaf length, leaf width, dead stem density, lower glume length, ligule length, inflorescence height, and stem base diameter. Excluding specimens that were missing one or more of these measurements, we retained 41 samples, including 18 introduced P. australis and 23 native P. australis.
The eight variables were standardized to mean = 0, SD = 1. We tested for a significant difference between subspecies with a multivariate analysis of variance (MANOVA), and then proceeded to an LDA using the lda function in the R package mass (Ripley et al. Reference Ripley, Venables, Bates, Hornik, Gebhardt and Firth2023). We used the absolute scaling values to rank the variables’ discriminating power.
All analyses were completed in R (R Core Team 2019), and tables and figures were produced in Microsoft Excel.
Results and Discussion
Genetic Identification
Of the 272 tissue samples analyzed, 222 yielded sequences adequate for haplotyping. Of these, 126 matched rbcL locus haplotype r2, which is associated with seven combined haplotypes by Saltonstall (Reference Saltonstall2016), all of which are native. The second most abundant haplotype was r4, which was present in 94 samples. Saltonstall (Reference Saltonstall2016) documents this haplotype as part of nine combined haplotypes, all nonnative, and including the widespread invasive haplotype M. A third locus haplotype, r7, was present in two samples. This haplotype has been documented in a single native combined haplotype, S (Saltonstall Reference Saltonstall2016). We conclude that all samples with haplotype r4 are nonnative, and most likely the invasive combined haplotype M, and samples with haplotypes r2 and r7 are native.
The native haplotypes r2 and r7 co-occurred at two locations. The native haplotype r2 co-occurred with the invasive haplotype at two locations. The remaining 44 sites had only a single haplotype present (native r2 or invasive r4), and there were no locations with only the native r7 haplotype present. For the two sites with co-occurring native and introduced P. australis, we identified the numerically dominant subspecies in the samples (accounting for four out of five subsamples) and dropped the nonmatching subsamples from further analyses. The two locations with different native haplotypes were treated as ordinary native P. australis sites for the purpose of this study, and all subsamples were averaged together.
Measuring Traits of Native and Introduced Phragmites australis
Of the 22 measured variables, a statistically significant difference was found between the subspecies for all but one variable (living stem density) (Table 2). However, high effect size (ω2: 0.76 to 0.96) and zero overlap were observed for only three measurements: old stem leaf retention, categorical stem color, and ligule base height. A fourth variable, the proportion of stems with fungal spots, was notable, in that fungal spots only appeared on native P. australis (although not all native plants had them); these spots never appeared on introduced P. australis. All other measurements included some amount of overlap ranging from 4% to 98% (Figure 1).
Table 2. Morphological measurement comparison between introduced (n = 21) and native Phragmites australis populations (n = 27) in southern Ontario, Canada. a

a Measurements per site are based on an average of 5 plots (living and old stem density) or 5 stems per site (all other measurements). Statistical output is from a one-way ANOVA or Welch’s test (*) assessing the effects of subspecies on each individual measurement. Results are ordered by decreasing effect size and also include the amount of overlap between subspecies measurements, mean ± SD, and ranges for each subspecies. P-values in bold denote statistically significant differences at α = 0.05.

Figure 1. Dot plot of 22 morphological traits measured for introduced (n = 21 sites, filled blue circles) and native Phragmites australis (n = 27 sites, empty white circles), presented as normalized measurements (range 0–1), arranged to consistently present introduced values at the higher end of the range. Traits are presented along the x axis, with bolded and starred traits used for further identification purposes and traits with 0% overlap highlighted by the dotted box.
After primary variables were excluded, the MANOVA revealed there was a statistically significant difference between the subspecies for the eight variables retained for the LDA (Wilks Λ = 0.131, df = 8, P < 0.001). Lower glume length and leaf blade length had the highest absolute scaling values, and while variables overlapped for the subspecies when plotted individually, they show clear separation when plotted together (Figure 2).

Figure 2. Scatter plot of lower glume length (mm) and leaf length (mm) averaged from 5 stems per site from 18 introduced (filled blue circles) and 25 native Phragmites australis populations (empty white circles). The dashed lines indicate the threshold values used to separate subspecies samples using a combination of the two measurements (lower glume length: 4.6 mm; leaf length: 37 cm).
The Best Morphological Traits for Separating Introduced and Native Phragmites australis
We have identified four individual traits (old stem leaf retention, ligule base height, stem color, and stem spot fungus) and one combination of two traits (lower glume length + leaf length) that provide rapid and simple separation of the 48 introduced and native P. australis populations that we examined.
The individual trait that was best explained by subspecies (ω2 = 0.96) and had zero overlap between lineages was the percent of leaf sheaths retained on old dead standing stems (Table 2). Despite being starkly different between subspecies and easy to measure, leaf sheath retention is underrepresented in identification guides compared with other traits such as stem color. While some researchers have highlighted the value of this trait (e.g., Blossey Reference Blossey2003; Swearingen et al. Reference Swearingen, Saltonstall and Tilley2022), it may be especially underused in comparisons of native and introduced P. australis traits using herbarium or voucher specimens, which may not always include older stems (Allen et al. Reference Allen, McCormick, Jantzen, Marr and Brown2017).
The second individual trait of interest was ligule height, which is commonly regarded as one of the most useful distinguishing traits, though with disagreement about whether or not to measure the height of the full ligule (e.g., Saltonstall et al. Reference Saltonstall, Peterson and Soreng2004; Swearingen et al. Reference Swearingen, Saltonstall and Tilley2022) or to exclude the hairy fringe that can form above the darkened basal tissue (Allen et al. Reference Allen, McCormick, Jantzen, Marr and Brown2017; Catling and Mitrow Reference Catling and Mitrow2011; Nichols Reference Nichols2020). Our results support excluding the fringe, because it can introduce additional variation to the measurement from damaged or particularly long hairs (Catling et al. Reference Catling, Mitrow and Black2007); while the base height of the ligule had no overlap between introduced and native P. australis, full ligule height had 54% overlap (Table 1) and was therefore less diagnostic in our samples.
The third individual trait that offered complete subspecies separation was a categorical assessment of stem color. While stem color is one of the most commonly cited differences between introduced and native P. australis, it is also one of the least reliable traits, because it is subjective and prone to observer bias (Allen et al. Reference Allen, McCormick, Jantzen, Marr and Brown2017; Saltonstall et al. Reference Saltonstall, Peterson and Soreng2004). However, while individual stems of both subspecies had no to light red pigmentation, dark red pigmentation was more diagnostic and less subjective. Dark red coloration (i.e., color categories 3 to 4) was only observed on native stems and can be used as strong evidence for an identification. Additionally, image analysis objectively supported the perceived color differences, with strong correlations between the categorical color values and actual stem hue (Spearman’s rank correlation, rS(46) = −0.90, P < 0.001), lightness (rS(46) = −0.81, P < 0.001), and to a lesser extent, saturation (rS(46) = −0.30, P = 0.04). While image analysis was useful to validate the descriptive color differences and to compare samples within our study, this approach is less useful for general identification of individual samples, as differences in camera and lighting conditions will limit comparability of HSL values and the method is logistically demanding compared with other measurements.
Although both subspecies had some stems with no round fungal stem spots (Table 2), the presence of these spots is nevertheless a useful fourth individual characteristic for separating them. The spots form on some stems of native P. australis (average 64% in this study) but never appear on the introduced lineage (Swearingen et al. Reference Swearingen, Saltonstall and Tilley2022). Thus, while the absence of stem spots is not diagnostic, the presence of spots can provide a quick and easy positive identification of native P. australis. While stem spot fungus is only rarely recommended as a diagnostic trait (e.g., Blossey Reference Blossey2003; Swearingen et al. Reference Swearingen, Saltonstall and Tilley2022), the spots are clear and easy to distinguish from the other fungi that appear on introduced P. australis as a dark smudge or smear on the leaf sheaths (Blossey Reference Blossey2003). To date, the presence or absence of fungal spots on hybrid P. australis has not been documented.
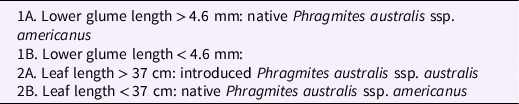
Finally, LDA identified lower glume length and leaf blade length as combined traits that were not sufficiently diagnostic on their own but could be used together to separate introduced and native P. australis. While differences in leaf length are only rarely considered (e.g., Allen et al. Reference Allen, McCormick, Jantzen, Marr and Brown2017), lower glume length has been suggested as a useful trait (Catling and Robichaud Reference Catling and Robichaud2003; Catling et al. Reference Catling, Mitrow and Black2007; Saltonstall et al. Reference Saltonstall, Peterson and Soreng2004). Additional effort is required to measure two traits rather than one, but the combined assessment of lower glume length and leaf length using a two-step binomial key remains accessible, as it does not require statistical analysis or calculation of additional indices (Table 3).
Table 3. Binomial key for differentiating native and introduced Phragmites australis using lower glume length and leaf length measurements.
All five traits can be measured with moderate to high confidence and ease. The only tools required will be a meter stick or measuring tape for leaf length and a pair of calipers for the smaller measurements of ligule height and glume length. All can also be conveniently measured in the field or lab, except for lower glume length, which is most accurately measured under a microscope.
Recommendations for Identification
To facilitate rapid and simple identification of introduced and native P. australis, we have organized the five diagnostic traits/trait combinations into a checklist (Figure 3). For ease of use and based on the trait ranges observed in this study (Table 2), we describe the difference between subspecies for each trait as either a clear binary or with convenient numerical thresholds. While our results indicate that any one of these five traits/double traits can be sufficient to diagnostically separate introduced and native P. australis, we suggest examining all traits for increased confidence. Multiple stems should be examined per suspected population of P. australis (e.g., minimum 5 stems) to capture within-site variation. Complete consensus among all measured traits in this guide across samples should provide morphological identification with high confidence. Incomplete consensus—which could emerge due to measurement error, within-subspecies variation beyond what was documented in our populations, multiple subspecies co-occurring at a single site, or hybrids with intermediate traits (Williams et al. Reference Williams, Lambert, Long and Saltonstall2019)—should be considered inconclusive and followed by genetic testing where possible.
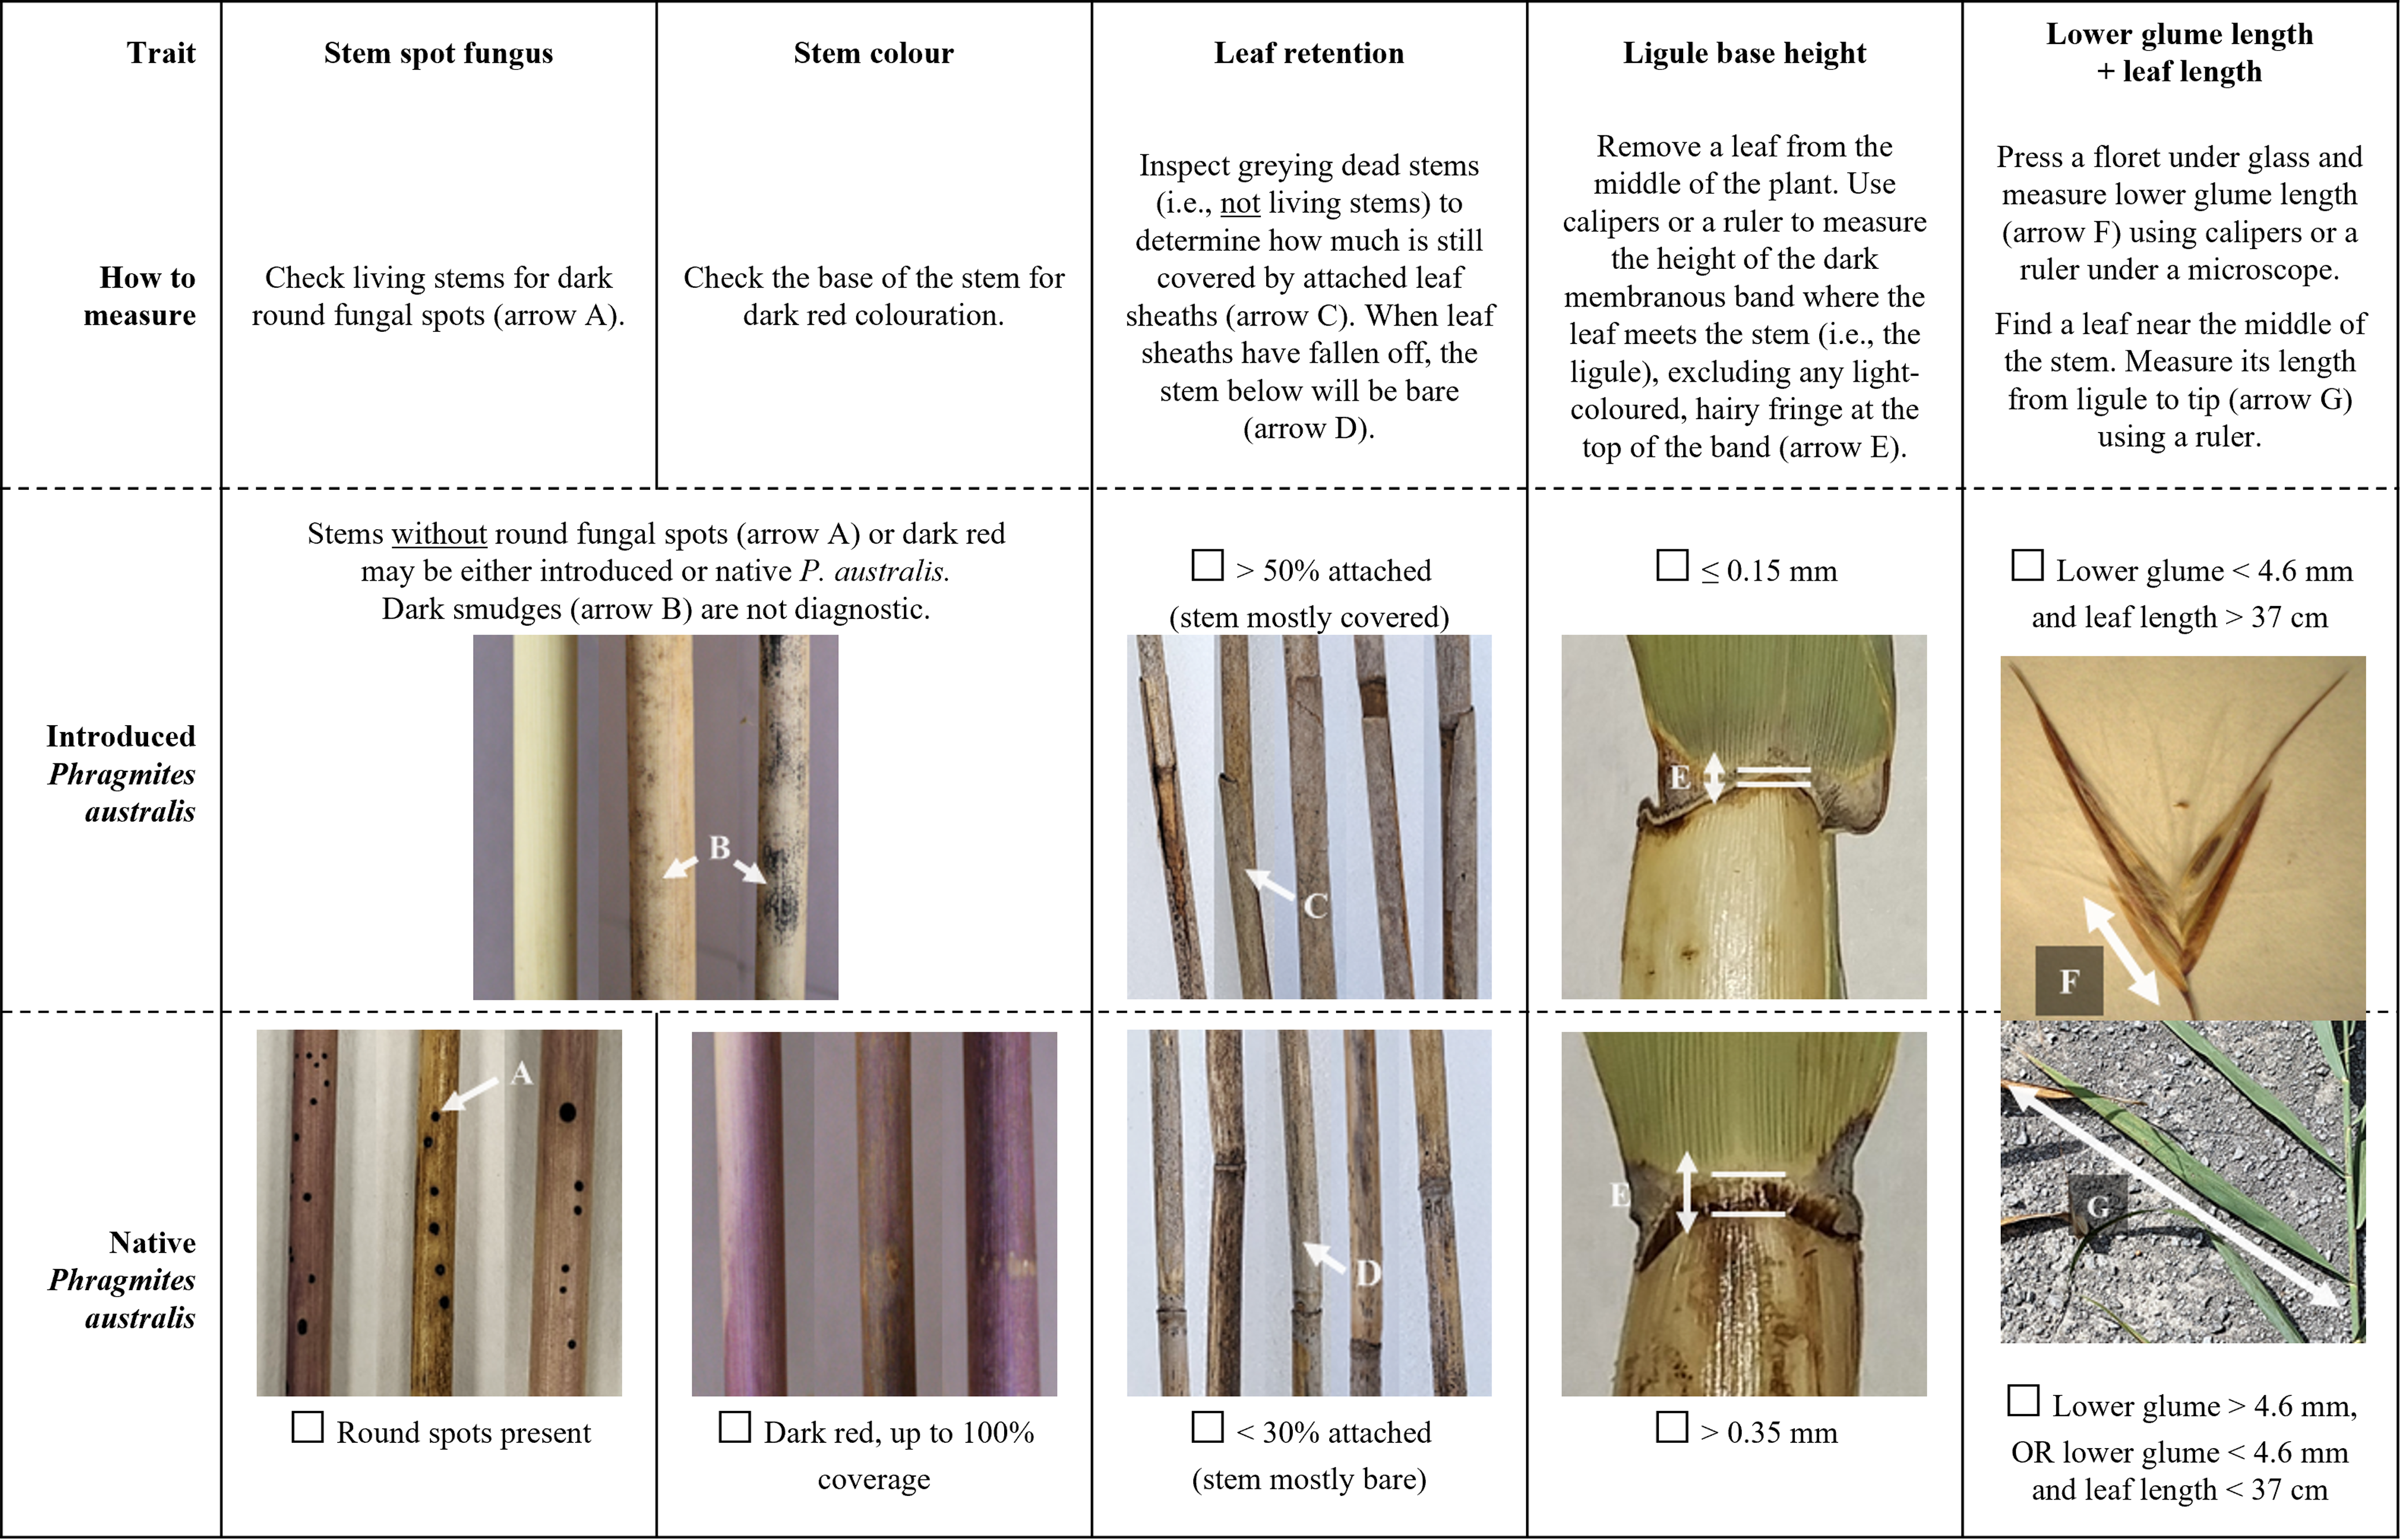
Figure 3. Checklist of the best traits for distinguishing between introduced and native Phragmites australis. For each trait, follow the instructions for “How to measure” and mark off the corresponding check box. Measurements will be most comparable if taken in the Great Lakes region in late summer or fall and should be compared across a minimum of 5 samples per suspected P. australis population. Complete consensus between all traits and samples with introduced or native P. australis should provide morphological identification with high confidence. Incomplete consensus should be considered inconclusive and followed by genetic testing where possible.
In general, identification will be easiest and most consistent with this checklist in the late summer or fall. Many morphological traits develop over the course of the growing season, after which time they can fade or degrade as stems senesce (Blossey Reference Blossey2003; MJM, personal observation). One useful exception is old stem leaf retention, which is expected to remain an informative trait year-round. Old, greying stems of native P. australis will drop most of their leaf sheaths by the end of the growing season and remain bare while old stems of introduced P. australis can retain their leaf sheaths for multiple seasons and years (Blossey Reference Blossey2003).
Because P. australis traits are known to vary regionally (Lambert et al. Reference Lambert, Saltonstall, Long and Dudley2016), this guide will be most valuable for populations located in the Great Lakes region. Notably, similar research from eastern Ontario (Catling et al. Reference Catling, Mitrow and Black2007) and western Canada (Allen et al. Reference Allen, McCormick, Jantzen, Marr and Brown2017) observed overlap in traits (e.g., ligule height) that were fully separable in our southern Ontario specimens, suggesting strong regional variation at larger geographic scales. In particular, this guide should not be used in regions with Gulf Coast P. australis, which has morphological traits intermediate to the introduced and native lineages and occurs much further south beyond the Great Lakes region (Colin and Eguiarte Reference Colin and Eguiarte2016; Saltonstall and Hauber Reference Saltonstall and Hauber2007; Swearingen et al. Reference Swearingen, Saltonstall and Tilley2022). We hope that this study will guide continuing investigation to determine the best practices for morphological identification of P. australis subspecies in additional geographic areas.
Relying on Diagnostic Traits Rather Than “Common Wisdom”
This study reinforces the importance of reliable identification features to distinguish between introduced and native P. australis. While 21 of our 22 measured traits differed between the two lineages and were generally in accordance with “common wisdoms” (e.g., on average, introduced P. australis was indeed taller, had larger panicles, broader leaves), all but three of the measurements had overlap up to 98%. Thus, common observations of plants with “intermediate” traits are not automatically indicative of aberrant populations or hybridization. Instead, they are representative of the normal range of variation within and between the subspecies. We hope that this checklist of five easy to use traits (Figure 3) will provide a practical, affordable, and objective assessment tool to supplement genetic methods (Lindsay et al. Reference Lindsay, Freeland, Gong, Guan, Harms, Kowalski, Lance, Oh, Sartain and Wendell2023) and help land managers and researchers identify P. australis subspecies around the Great Lakes region.
Acknowledgments
We thank Carla Timm (University of Toronto) for assistance processing samples in the laboratory and two reviewers for their helpful feedback in developing this article. This research was funded by the Institute of Forestry and Conservation at the University of Toronto, Agriculture and Agri-Food Canada, Mitacs Elevate, Ducks Unlimited Canada, and the Nature Conservancy of Canada. No conflicts of interest have been declared.


 Open access