


1. Introduction
The United States Department of Agriculture (USDA) has been the primary source of public information in agriculture for over 150 years, and its data and reports are generally regarded as accurate and trustworthy. However, it is natural to think that the surge in communications technology, computing power, storage, and remote sensing in the last two decades has increased the competitiveness of private sector in generating agricultural data. In this environment, some argue that public information programs can be downsized or eliminated because better private data essentially make these programs irrelevant. This argument has been put to the test during the government shutdown in January 2019 that resulted in delayed releases of Crop Production Annual Summary, Grain Stocks, Winter Wheat Seedings, and World Agricultural Supply and Demand Estimates reports. During that time, Reuters reported that “To fill the void in data, traders and farmers are relying on private crop forecasters, satellite imagery firms, and brokerages offering analyses on trade and supplies. Some have been scouring Twitter for tidbits on shifting weather patterns and rumors of grain exports, but say it is difficult to replace the USDA” (Huffstutter and Polansek, Reference Huffstutter and Polansek2019).
This raises a question about the value and accuracy of the information USDA provides to the markets over and above the information that is available from private sources. Furthermore, it is important to determine whether USDA forecasts have become less competitive relative to the private forecasts over time with emergence of “big data” and better access to information. Therefore, the goal of this study is to assess the accuracy of USDA reports relative to their private counterparts and their informational value, as well as changes in relative accuracy over time.
Most previous studies of the value of USDA information focused on the price impact of USDA reports and show that USDA crop reports have moved markets for decades (e.g., Colling and Irwin, Reference Colling and Irwin1990; Fortenbery and Sumner, Reference Fortenbery and Sumner1993; Baur and Orazem, Reference Baur and Orazem1994; Isengildina-Massa et al., Reference Isengildina-Massa, Irwin, Good and Gomez2008; McKenzie, Reference McKenzie2008; Adjemian, Reference Adjemian2012; Lehecka, Wang, and Garcia, Reference Lehecka, Wang and Garcia2014; Isengildina-Massa et al., Reference Isengildina-Massa, Karali, Irwin, Adjemian and Cao2016; Ying, Chen, and Dorfman, Reference Ying, Chen and Dorfman2019; Karali et al., Reference Karali, Isengildina-Massa, Irwin, Adjemian and Johansson2019; Karali, Isengildina-Massa, and Irwin, Reference Karali, Isengildina-Massa and Irwin2019). However, less is known about the relative accuracy of USDA estimates. Garcia et al. (Reference Garcia, Irwin, Leuthold and Yang1997) applied an informational value test developed by Baur and Orazem (Reference Baur and Orazem1994) to evaluate the impact of USDA corn and soybean production forecasts over 1971–1992. They found that the USDA August corn production forecast had the largest informational value among the forecasts included in the analysis, and the private market analysts have substantially improved their forecasting ability relative to the USDA over their sample period. The authors argued that this finding is consistent with large declines in the cost of information due to technological improvement in computers, communications equipment, remote-sensing satellites, etc.
Egelkraut et al. (Reference Egelkraut, Garcia, Irwin and Good2003) assessed the accuracy of USDA’s corn and soybean production forecasts relative to the private forecasts released by Conrad Leslie and Sparks Companies over 1971–2000 and found that the relative accuracy of USDA forecasts varied by crop and month. Their results suggest that for corn, USDA forecasts appeared more accurate than private forecasts, especially later in the forecasting cycle. For soybeans, private forecasts appeared more accurate than USDA’s in the beginning of the forecasting cycle (August and September), but USDA forecasts were dominant for October and November.
Other related studies, e.g. Colino and Irwin (Reference Colino and Irwin2010) and Colino et al. (Reference Colino, Irwin, Garcia and Etienne2012), assessed predictive accuracy of quarterly forecasts of hog prices from outlook programs, futures prices, and time series models and demonstrated that composite forecasts improve predictive performance, dominating the best individual forecasts. Hoffman et al. (Reference Hoffman, Etienne, Irwin, Colino and Toasa2015) evaluated the forecast performance of WASDE price forecasts for corn relative to several future-based alternatives. However, we are not aware of any recent evidence that would compare the performance of USDA and private forecasts and demonstrate the impact of the emergence of “big data” and better access to information on USDA’s relative accuracy.
We evaluate the relative accuracy of USDA estimates compared to their private counterparts and test whether there have been changes in relative accuracy over time. Our study includes corn, soybean, and winter wheat forecasts in Prospective Plantings, Acreage, and Crop Production reports and uses three sets of statistical analyses. Specifically, we test for bias in average percent forecast errors for both USDA and private analysts. In addition, we compare the magnitude of errors across public and private forecasts using mean absolute percent errors (MAPE). Another measure of relative accuracy is the informational value test (Baur and Orazem, Reference Baur and Orazem1994); Garcia et al., Reference Garcia, Irwin, Leuthold and Yang1997), where we assess the reduction in market forecast variance due to additional information contained in the USDA forecast. Thus, we are expanding the current state of knowledge across time by adding data post 2000, across commodities by including winter wheat, and across reports by adding Prospective Plantings and Acreage reports to our analysis.
To examine patterns in forecast errors and relative accuracy over time, we split our sample into several subperiods determined based on data availability. Furthermore, we compare differences in 10-year rolling MAPEs across various forecasts for each commodity to assess changes in relative forecast accuracy over time. Our main findings suggest that USDA forecasts often had significantly smaller errors than their private counterparts, indicating that USDA forecasts were more accurate. The accuracy of corn Crop Production forecasts has improved in the most recent subsample for both USDA and private forecasts likely due to the access to better remote sensing information. However, the accuracy of USDA corn production forecasts has improved more than that of private forecasts, maintaining the USDA’s relative accuracy advantage. The results of the tests of informational value highlight the largest accuracy advantage of Prospective Plantings and Acreage reports for all crops and Crop Production reports in wheat, especially in the most recent subperiod. This evidence indicates that the relative accuracy of USDA forecasts did not decline with the emergence of better access to information but instead continues to rise in this increasingly competitive forecasting environment.
2. Data and descriptive statistics
2.1. USDA forecasts
This study examines the relative accuracy of USDA’s key crop reports that are prepared and issued by their National Agricultural Statistics Service (NASS) agency over the 1965/66 through 2019/20 marketing years. NASS is the main branch of USDA responsible for collection and dissemination of surveys related to agricultural operations to provide estimates of production, supply, and prices. The annual forecasting cycle for spring crops (corn and soybeans) starts with Prospective Plantings reports. These annual reports contain survey-based estimates of producers’ planting intentions as of March 1st and are typically released at the end of March. Good and Irwin (Reference Good and Irwin2011) provide a thorough review of the survey procedures used by the USDA. Additional expected supply information is disclosed in Acreage reports. These reports provide updated survey information on planted and/or harvested acreages for those commodities included in Prospective Plantings reports and are released at the end of every June. Planted and harvested acreage is finalized in Crop Production Annual Summary report released in January. Differently from spring crops, winter wheat is planted in the fall, and the Winter Wheat Seedings reports released in December provide winter wheat acreage information similar to the one released in Acreage reports for spring crops.
Crop Production reports include information from Acreage reports and other sources and contain forecasts of marketing year yield and production for major crops consistent with their growing cycles. These reports are typically released between the 9th and 15th of each month. For corn and soybeans, production forecasts are released from August through November and for winter wheat from May through August. All forecasts are finalized in the January Crop Production Annual Summary.Footnote 1 Thus, production forecasts released before January represent an update of the previous forecast describing a marketing year total production. For more information on the preparation of Crop Production reports, see Irwin, Sanders, and Good (Reference Irwin, Sanders and Good2014).
2.2. Private analysts’ estimates
Industry analysts’ estimates, which are usually released a few days before the USDA reports, have been traditionally used as a proxy for market expectations of government reports (e.g., Colling and Irwin, Reference Colling and Irwin1990; Grunewald, McNulty, and Biere, Reference Grunewald, McNulty and Biere1993; Garcia et al., Reference Garcia, Irwin, Leuthold and Yang1997; Egelkraut et al., Reference Egelkraut, Garcia, Irwin and Good2003). Following these studies, we construct private expectation series for corn and soybean Crop Production forecasts using an average of production forecasts by Conrad Leslie and Informa Economics (formerly Sparks Companies, Inc.) during 1965–2000, the average between the Informa Economics estimate and the average analyst estimate reported by the Dow Jones Newswire survey for 2001–2005, the average of the Dow Jones survey for 2006–2012, and the average of the Bloomberg survey during 2013–2019.Footnote 2 For winter wheat Crop Production expectations, the average production forecasts by Informa Economics are used for the 1971–1983 period, and the average analyst forecasts reported by Knight-Ridder Wire Service and Dow Jones Newswire are used for the period of 1984–2019. Private expectations data for most Prospective Plantings and Acreage reports are available from the same sources starting in 1983.
Descriptive statistics of USDA and private forecasts of crop acreage and production shown in Table 1 demonstrate that over 1983–2019 crop plantings averaged 81.38 million acres for corn, 70.83 million acres for soybeans, and 45.38 million acres for winter wheat according to the final estimates published in the Crop Production Annual Summary. Deviations of the forecasts published in Prospective Plantings and Acreage reports (as well as the private expectations for these forecasts) from the final estimates are defined in this study as forecast errors as described in detail in the methodology section. Similarly, crop production averaged 8,807 million bushels for corn, 2,339 million bushels for soybeans, and 1,570 million bushels for wheat over the study period.
Table 1. Descriptive statistics of USDA and private forecasts of crop acreage and production over 1965–2019
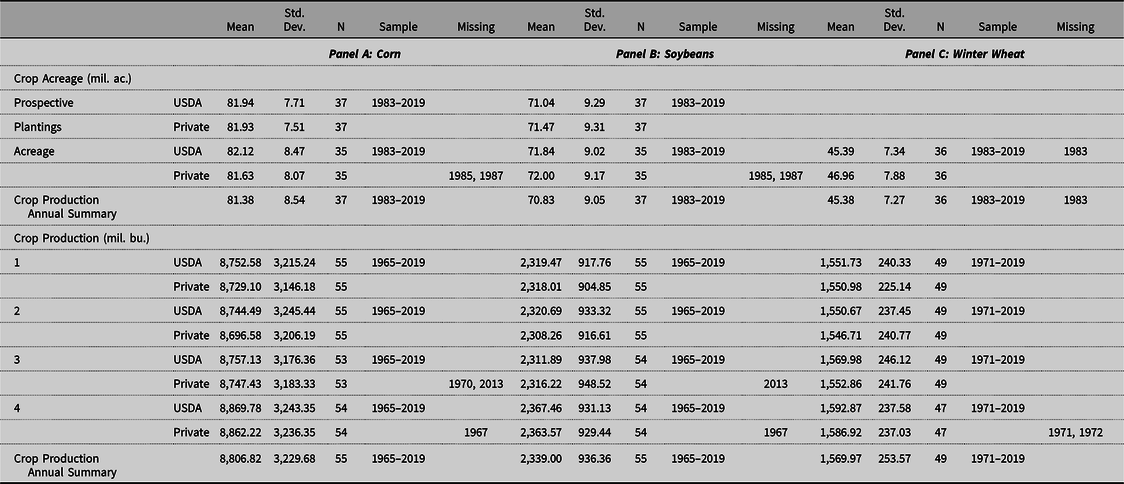
Note: Crop production forecasts were released in 1=August, 2=September, 3=October, and 4=November for corn and soybeans and 1=May, 2=June, 3=July, and 4=August for winter wheat.
Since the goal of this study is to evaluate relative accuracy of USDA and private forecasts as well as changes in relative accuracy over time, identification of subsamples is based on maximizing subsample sizes subject to data availability. Acreage forecasts are the most constrained by data availability with the sample period 1983–2019, which is split in half to generate two subsamples: 1983–2001 and 2002–2019. Crop Production forecasts are available prior to 1983, allowing for a third subsample in their analysis, 1965–1982 for corn and soybeans and 1971–1982 for winter wheat. All statistical tests are conducted for full sample periods, as shown in Table 1 as well as for subsamples described here.
3. Methods
Forecast errors of USDA $\left( {FE_t^U} \right)$
and private analysts
$\left( {FE_t^U} \right)$
and private analysts $\left( {FE_t^P} \right)$
are defined as the percentage difference between the final USDA estimate in marketing year
$\left( {FE_t^P} \right)$
are defined as the percentage difference between the final USDA estimate in marketing year $t$
,
$t$
, $q_{Final,t}^U$
, and the forecast,
$q_{Final,t}^U$
, and the forecast, $q_t^U$
for USDA and
$q_t^U$
for USDA and $q_t^P$
for private analysts:
$q_t^P$
for private analysts:
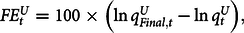 $$FE_t^U = 100 \times \left( {\ln q_{Final,t}^U - \ln q_t^U} \right),$$
 $$FE_t^P = 100 \times \left( {\ln q_{Final,t}^U - \ln q_t^P} \right),$$
where the final USDA estimate is annual acres planted for Prospective Plantings and Acreage reports and annual production for Crop Production report.
The first benchmark of forecast accuracy applied in this study is a test of bias. A t-test with a null hypothesis of mean forecast errors equal zero was used to examine bias in USDA and private analysts’ forecasts. If the average forecast errors are different from zero, this would indicate a systematic underestimation if average errors are positive and overestimation in average errors are negative.
The second test focuses on the size of forecast errors measured using MAPE:
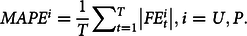 $$MAPE_{}^i = \frac{{1}\over{T}}\mathop \sum \nolimits_{t = 1}^T \left| {FE_t^i} \right|, i = U,{\rm}P.$$
We test whether the difference in MAPE between private and USDA forecasts is significantly different from zero using the modified Diebold Mariano (MDM) test proposed by Harvey, Leybourne, and Newbold (Reference Harvey, Leybourne and Newbold1997). This test for differences in MAPEs is based on a loss function specified as a difference between absolute forecast errors: $d = \left| {FE_t^U} \right| - \left| {FE_t^P} \right|$
. Then, the test statistic is calculated as:
$d = \left| {FE_t^U} \right| - \left| {FE_t^P} \right|$
. Then, the test statistic is calculated as:
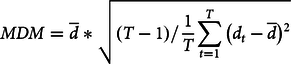 $$MDM = \overbar d *\sqrt {\left( {T - 1} \right)/\frac{{1}\over{T}}\mathop \sum \limits_{t = 1}^T {{\left( {{d_t} - \overbar d} \right)}^2}} $$
where $\overbar d$
is the average d and T refers to the number of observations. The MDM test statistic follows a t-distribution with T-1 degrees of freedom. Significant positive difference would indicate that the errors of private forecasts are significantly larger than the USDA forecast errors and vice versa.
$\overbar d$
is the average d and T refers to the number of observations. The MDM test statistic follows a t-distribution with T-1 degrees of freedom. Significant positive difference would indicate that the errors of private forecasts are significantly larger than the USDA forecast errors and vice versa.
The third test focuses on the informational value of USDA forecasts using the test proposed by Baur and Orazem (Reference Baur and Orazem1994) and applied by Garcia et al. (Reference Garcia, Irwin, Leuthold and Yang1997). This test is based on the premise that the social welfare value of a government supply forecast is proportional to the reduction in the market’s supply forecast variance resulting from the introduction of the government forecast. We implement this test for each report separately by first estimating the “partial information” Equation (5) to obtain a measure of the market’s forecast variance (as measured by the adjusted R-squared) before the USDA report is released:
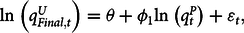 $${\rm{ln}}\;\left( {q_{Final,t}^U} \right) = \theta + {\phi _1}{\rm{ln}}\;\left( {q_t^P} \right) + {\varepsilon _t},$$
where ${\varepsilon _t}$
is the random error term, and the variables
${\varepsilon _t}$
is the random error term, and the variables $q_{Final,t}^U$
and
$q_{Final,t}^U$
and $q_t^P$
are the final USDA estimate in marketing year
$q_t^P$
are the final USDA estimate in marketing year $t$
and the private forecast, respectively, as defined above. A similar measure of the market’s forecast variance (adjusted R-squared) after the release of USDA report is obtained by estimating the “full information” equation:
$t$
and the private forecast, respectively, as defined above. A similar measure of the market’s forecast variance (adjusted R-squared) after the release of USDA report is obtained by estimating the “full information” equation:
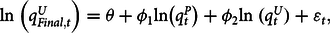 $${\rm{ln}}\;\left( {q_{Final,t}^U} \right) = \theta + {\phi _1}{\rm{ln}}\left( {q_t^P} \right) + {\phi _2}{\rm{ln}}\;(q_t^U) + {\varepsilon _t},$$
where $q_t^U$
is the USDA forecast. Finally, a reduction in the market’s forecast variance resulting from the USDA report is assessed with the difference in the adjusted R-squared values between the “full information” Equation (6) and the “partial information” Equation (5). The larger the difference, the more valuable the USDA forecast is in reducing the production forecast variance of the market. Analogously, the smaller the difference, the better the private analysts’ forecasts and the less valuable are the USDA reports.
$q_t^U$
is the USDA forecast. Finally, a reduction in the market’s forecast variance resulting from the USDA report is assessed with the difference in the adjusted R-squared values between the “full information” Equation (6) and the “partial information” Equation (5). The larger the difference, the more valuable the USDA forecast is in reducing the production forecast variance of the market. Analogously, the smaller the difference, the better the private analysts’ forecasts and the less valuable are the USDA reports.
4. Results
4.1. Bias
Our findings for the full sample shown in Table 2 indicate overestimation in several Acreage forecasts: USDA corn acreage, both USDA and private soybean acreage, and private winter wheat. The magnitude of overestimation by private analysts is the largest for wheat Acreage forecasts by over 3%, persisting at this level across both subperiods. Overestimation of soybean acreage is much smaller in magnitude, 0.75% for private forecasts and 0.55% for USDA. However, the bias is not statistically significant in subsamples except for 1983–2001 for USDA forecast errors. Overestimation of corn acreage by USDA is even smaller, at 0.41% for the full sample, but it continued to be statistically significant in subsamples with 0.28% and 0.53% overestimation over 1983–2001 and 2002–2019, respectively. In addition, there is evidence of overestimation by 1.69% in USDA’s Prospective Plantings forecasts during 1983–2001, but it declines to almost zero in 2002–2019 subsample leading to statistically insignificant bias in the whole sample.
Table 2. Comparison of bias between USDA and private forecasts of crop acreage and production over 1965–2019
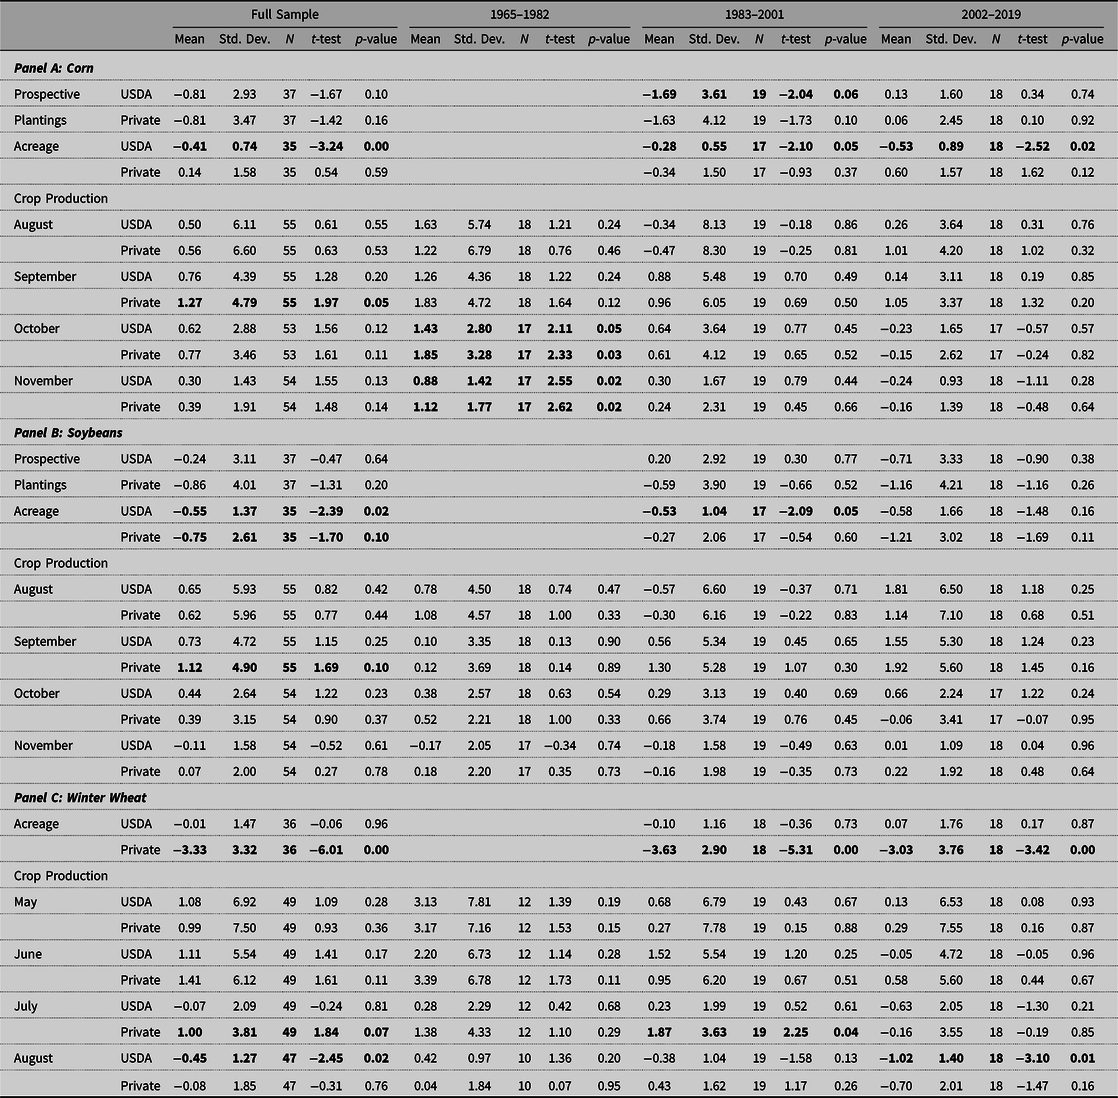
Notes: The null hypothesis for the test of bias is that mean forecast error is equal zero. Values that are statistically significant at 10% level are highlighted in bold.
While analysts tended to overestimate area at times, they had an opposite tendency for production in some cases. Our full sample results in Table 2 demonstrate that private analysts underestimate corn and soybean production in their September forecasts by 1.27% and 1.12%, respectively. They also underestimate wheat production in their July forecasts by 1% during the entire sample period and by 1.87% over 1983–2001 subsample. Additionally, there is evidence of underestimation in October and November forecasts of corn production by both USDA and private analysts during 1965–1982 that did not persist into later subperiods. The only evidence of overestimating production is detected in USDA’s August forecasts for wheat that overestimated the final estimates by 0.45% across the full sample and 1.02% during 2002–2019.
Overall, these findings reveal that both USDA and private analysts tend to overestimate planted area at times, but they have an opposite tendency to underestimate production in some cases. The underestimation in production is more common among private analysts and is likely associated with underestimation in yields that are substantially affected by improvements in biotechnology during the period of study.
4.2. Relative accuracy
The analysis of relative accuracy compares the size of errors between USDA and private forecasts and examines whether the difference between private and USDA forecast errors is statistically significant. Our findings for the full sample shown in Table 3 demonstrate the dominance of USDA forecasts in corn, but less so in wheat and particularly in soybeans. The errors of USDA forecasts of corn Prospective Plantings, Acreage, and September through November Production are significantly smaller than the errors of private forecasts. These advantages range from a low of 0.38 point for November Crop Production to a high of 0.67 point for Acreage. On the other hand, USDA does not appear to have a significant advantage over private analysts in August corn production forecasts with some evidence of private forecasts being more accurate during 1983–2001, although not statistically significant.
Table 3. Comparison of magnitude of forecast errors between USDA and private forecasts of crop acreage and production over 1965–2019
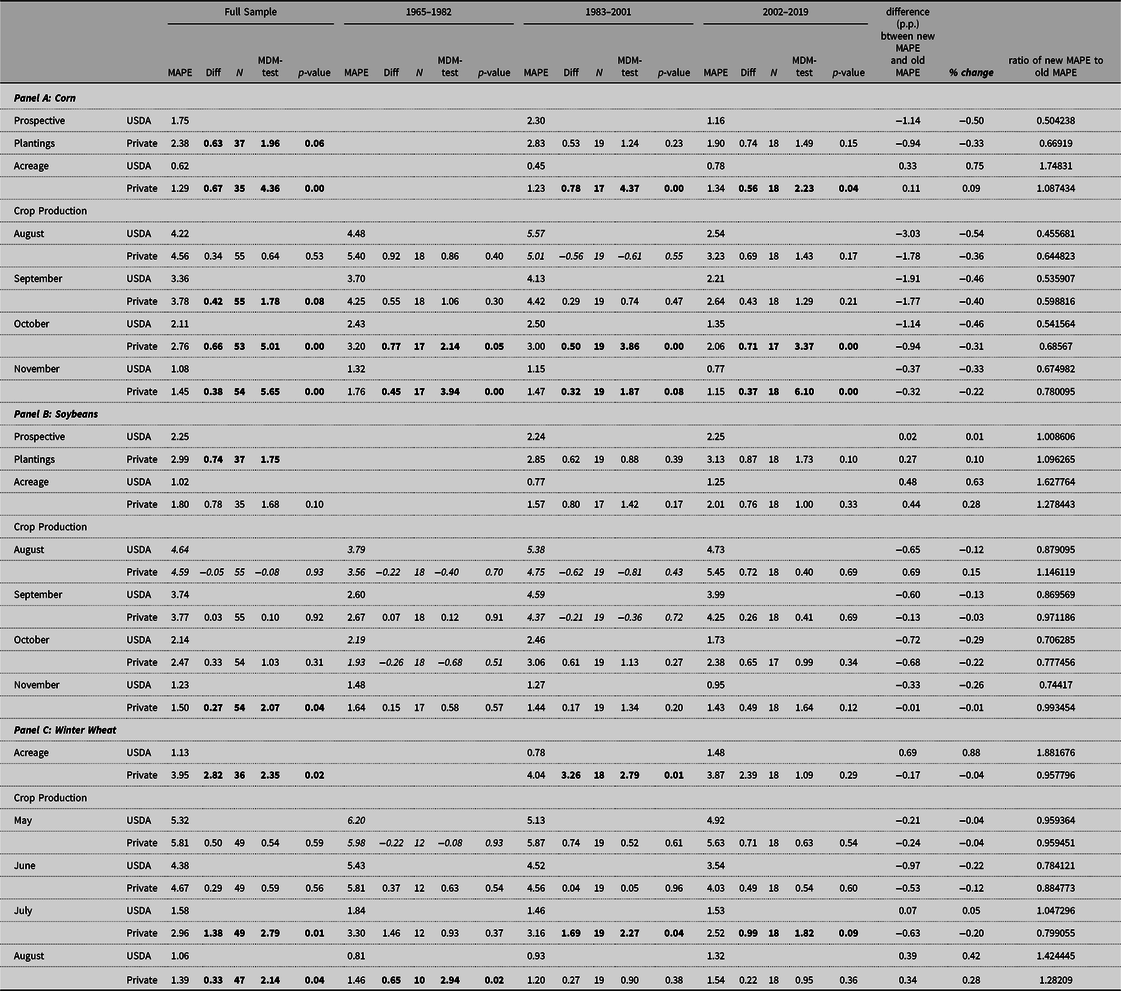
Notes: MAPE is mean absolute percent error. MDM is a Modified Diebold–Mariano test with a null hypothesis that the difference in the size of errors is zero. Values that are statistically significant at 10% level are highlighted in bold. Any evidence of smaller errors in private forecasts is highlighted in italics.
These patterns are also demonstrated in Figure 1, which shows the difference between 10-year rolling MAPEs of private and USDA forecasts to assess if our results are sensitive to subsample selection. Since positive differences demonstrate the smaller size of USDA errors, this figure confirms the findings in Table 3 with the biggest advantages of USDA in Prospective Plantings, acreage, and October Crop Production forecasts and the only evidence of private forecasts dominating the USDA for August Crop Production during 1990s and early 2000s. However, it appears that USDA has regained its advantage in August corn Crop Production forecasts since the mid-2000s.
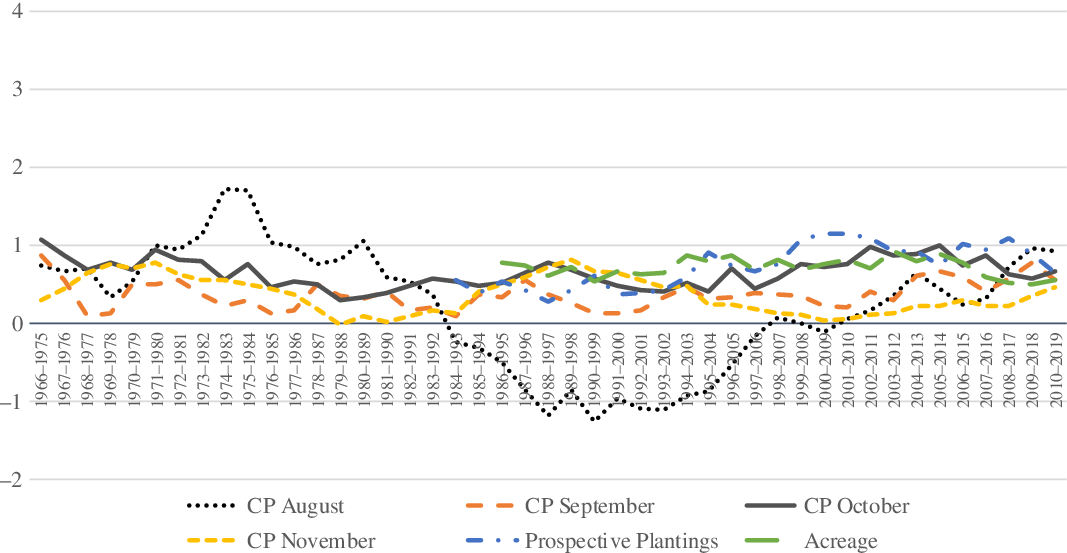
Figure 1. Difference between private and USDA 10-year rolling mean absolute percent errors of corn forecasts. Note: Positive difference indicates that the size of USDA forecast errors was smaller.
The smallest evidence of USDA forecasts dominating the accuracy of private forecasts is detected in soybeans, and it is limited to Prospective Plantings and November Crop Production reports in the full sample but not in subsamples. These forecasts are 0.74 and 0.27 points more accurate than their private counterparts, respectively. Table 3 also shows some evidence of private forecasts being more accurate than USDA’s for August soybean production forecasts in full sample and 1965–1982 and 1983–2001 subsamples, September soybean production in 1983–2001 subsample, and October soybean production in 1965–1982 subsample, although this advantage is not statistically significant. Figure 2 offers more detail illustrating these patterns. It appears that USDA has a small but clear advantage in accuracy of its soybean Prospective Plantings and Acreage forecasts as well as October production forecasts in the last two subperiods. On the other hand, private analysts appear to have as good as or better accuracy for August and September production forecasts during most of the study period and appear to lose this advantage only very recently, post 2006. Similarly, relative accuracy of USDA’s November soybean production forecasts appears to improve only since 2000.
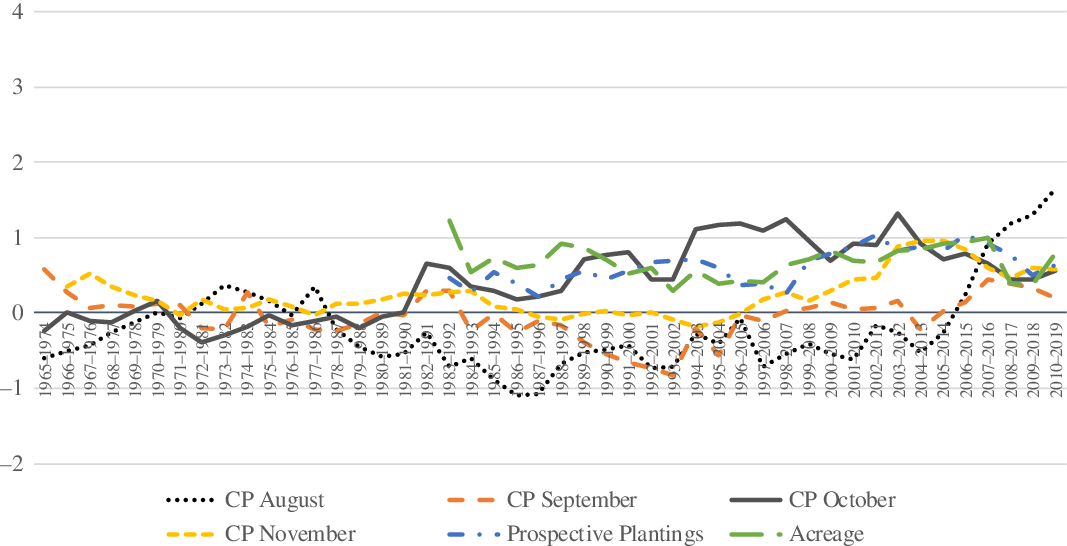
Figure 2. Difference between Private and USDA 10-year rolling mean absolute percent errors of soybean forecasts. Note: Positive difference indicates that the size of USDA forecast errors was smaller.
Our full sample findings shown in Table 3 demonstrate that USDA’s wheat acreage and July and August production forecasts are more accurate than their private counterparts. The largest advantage of USDA is in the Acreage forecasts published in Winter Wheat Seedings reports which have on average 2.82 percentage point smaller errors than private forecasts in the full sample, with 3.26 point smaller errors during 1983–2001. USDA’s winter wheat forecasts in July Crop Production reports are about 1.38 point more accurate than private forecasts in the full sample and about 1.69 and 0.99 points in the 1983–2001 and 2002–2019 subsamples, respectively. USDA’s advantage in August wheat production reports is more limited with 0.33 point smaller errors in the full sample and 0.65 point in the 1965–1982 subsample. The differences in 10-year rolling MAPEs shown in Figure 3 generally support the results shown in Table 3 with the largest USDA advantage in wheat forecast accuracy associated with Acreage reports, followed by July Crop Production reports, and the weakest relative performance associated with June Crop Production reports. The dominance of private forecasts for May wheat production appears only in the beginning of the sample and does not persist through time.
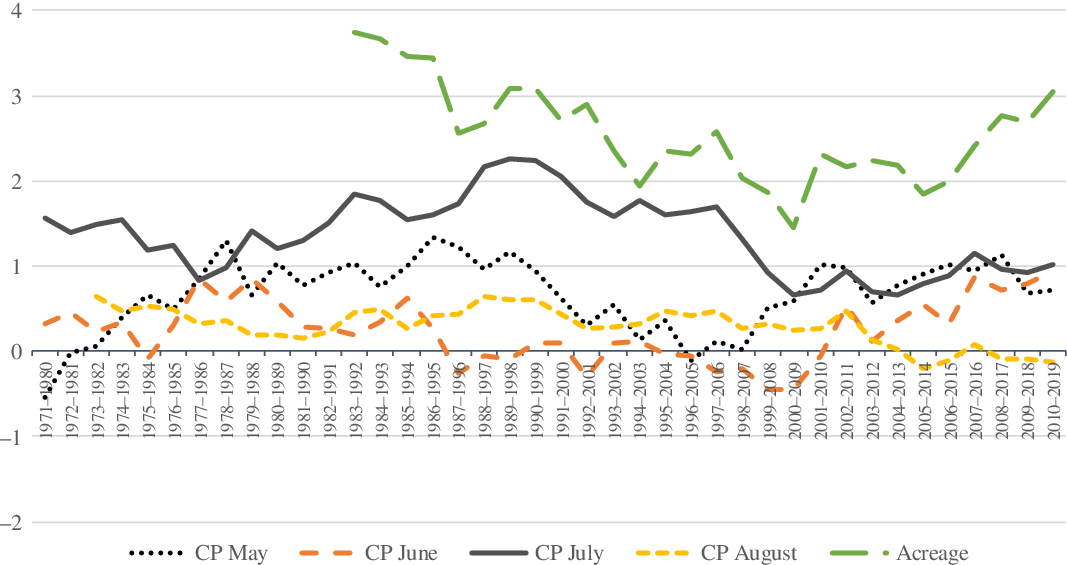
Figure 3. Difference between private and USDA 10-year rolling mean absolute percent errors of winter wheat forecasts. Note: Positive difference indicates that the size of USDA forecast errors was smaller.
Furthermore, Table 3 shows some interesting patterns of changes in forecast accuracy over time. Comparison of the size of errors between 1983–2001 and 2002–2019 subperiods reveals that MAPEs of USDA Prospective Plantings forecasts decreased by about 50% (from 2.3% to 1.16%) and those of private forecasts by 33% (from 2.83% to 1.9%). Similar patterns are observed for corn Crop Production forecasts with substantial decreases in forecast error observed in all cases ranging from 54% for August to 33% for November USDA forecasts and from 40% for September to 22% for November private forecasts. Accuracy improvement in soybean production forecasts is not as dramatic ranging from 29% for October (from 2.46% to 1.73%) to 12% for August USDA forecasts and from 22% (from 3.06% to 2.38%) for October to −15% for August private forecasts.
Accuracy improvements in wheat forecasts are most pronounced in June production forecasts with 22% (from 4.52% to 3.54%) and 12% (from 4.56% to 4.03%) decreases in MAPE for USDA and private forecasts, respectively. Modest 4% improvements in May wheat production forecasts are also observed. Accuracy of July wheat production forecasts improved for private but not USDA forecasts, while the accuracy of August forecasts deteriorated for both sources. Note that in almost all of these cases (with exception of July wheat production forecasts), accuracy improved for both USDA and private forecasts with a larger improvement in USDA forecasts, indicating that USDA has increased its relative accuracy advantage over time.
4.3. Informational value
Another measure of forecast accuracy that focuses on reduction in the market’s forecast variance resulting from the USDA report release is shown in Table 4. These findings suggest that USDA’s wheat reports appear to result in the largest reduction in forecast variance, followed by corn and soybean forecasts. This evidence is likely associated with the fact that forecast variance in early wheat production forecasts (0.78 for May and 0.85 for June in full sample) appears to be much larger than that of corn or soybean forecasts (0.97 and 0.98 for corn August and September in full sample), as smaller adjusted R-squared values imply greater uncertainty. It is also consistent with the evidence of bias and large errors of the private forecasts of wheat acreage. Our findings show that winter wheat Acreage reports decrease market forecast variance by about 8 points over 2002–2019 and 5 points over 1983–2001. Winter wheat production forecasts by USDA also result in substantial reductions in the market’s forecast variance, by about by about 9 points in 1983–2001 and 2002–2019 subperiods due to May Crop Production reports, by 4 and 6 points in the same subperiods due to June reports, and by about 6 points in the same subperiods due to July reports. The informational impact of August wheat production report as well as all Crop Production reports during 1965–1982 subperiod is smaller.
Table 4. Assessment of informational value contribution of USDA forecasts of crop acreage and production over 1965–2019
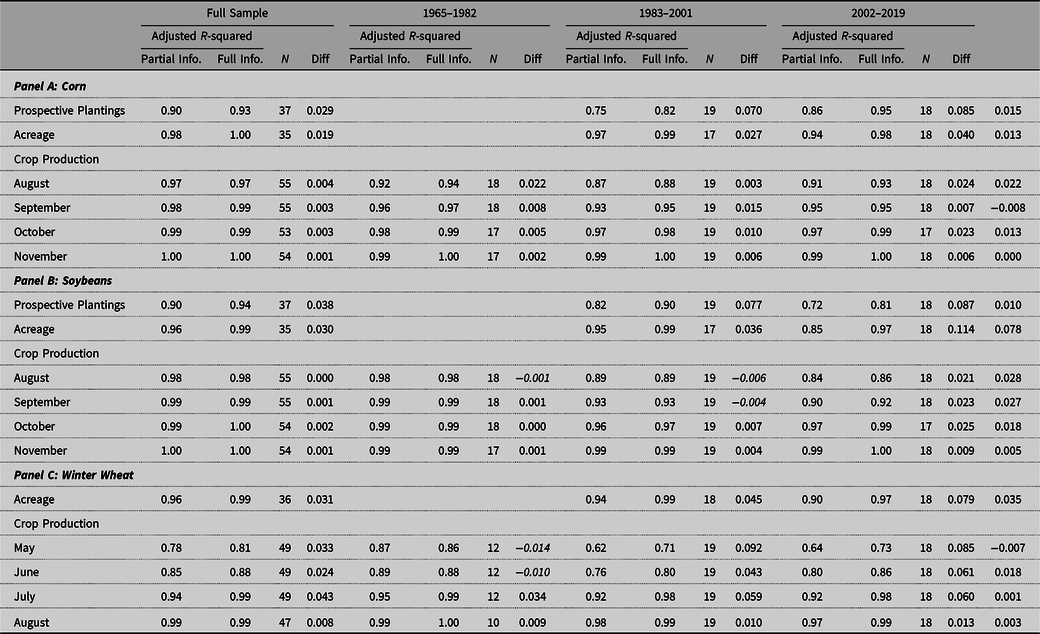
Among corn forecasts, Prospective Plantings reports appear to result in largest reduction in market forecast variance with decreases of 7 and 9 points in 1983–2001 and 2002–2019 subperiods, respectively. These are followed by Acreage reports that resulted in decreases in forecast variance by 3 and 4 points in 1983–2001 and 2002–2019 subperiods, respectively. Corn production reports appear to decrease forecast variance by about 1 percentage point due to September and November reports and 2 points following AugustFootnote 3 and October reports during 2002–2019 subperiod. The impact of October and November production reports in the earlier 1965–1982 subperiod and all corn production reports in the full sample appear to be smaller.
A similar pattern is observed in soybean forecasts with Prospective Plantings and Acreage reports resulting in largest declines in market forecast variance. Specifically, soybean Prospective Plantings reports result in a reduction of forecast variance by 8 and 9 points in 1983–2001 and 2002–2019 subperiods, respectively. Soybean Acreage reports result in a reduction of forecast variance by 4 and 11 points in 1983–2001 and 2002–2019 subperiods, respectively. Crop Production reports decrease soybean forecast variance by 1 to 3 points over 2002–2019, but much less so in the previous subperiods. The only evidence of USDA reports failing to reduce forecast variance is limited to August soybean production reports over 1965–2001 and September soybean production reports over 1983–2001 as well as May and June wheat production reports over 1965–1982 subperiod.
Another important result is observed by comparing the reduction in forecast variance across 1983–2001 and 2002–2019 subperiods, which reveals that these reductions are larger in the most recent subperiod in all but two cases. The largest improvements are observed for soybean forecasts. Improvements in wheat Acreage forecasts are also substantial, but they do not extend to substantial improvements in wheat production forecasts. This evidence once again demonstrates that the relative accuracy and informational value of USDA reports increased, rather than decreased over time with the emergence of big data in most cases.
5. Summary and conclusions
This study evaluates the accuracy of USDA crop Acreage and Production forecasts relative to their private counterparts and changes in this relative accuracy over time. Our findings reveal that in the vast majority of cases, USDA forecasts are more accurate than their private counterparts. The accuracy domination of the USDA forecasts is most consistent in corn, largest in wheat, and least prevalent in soybeans. For corn, we find the consistent accuracy advantages of USDA in Prospective Plantings, acreage, and October Crop Production forecasts throughout the study period. On the other hand, the only evidence of private forecasts dominating the USDA is found for August Crop Production during 1990s and early 2000s. However, it appears that USDA has regained its advantage in August corn production forecasts since the mid-2000s.
For wheat, USDA appeared to have significant accuracy advantages in Acreage and July production forecasts that have not diminished over time. For soybeans, USDA has a small but clear advantage in accuracy of its Prospective Plantings and Acreage forecasts as well as October production forecasts in the last two subperiods, but in most other cases, private forecasts are just as accurate or better. However, there is evidence of private soybean forecasts losing this advantage in the very recent post-2006 period. In fact, our results indicate that in almost all cases accuracy improved for both USDA and private forecasts over time with a larger improvement in USDA forecasts. These findings suggest that the methods used by USDA to forecast crop acreage and production continue to remain effective in the big data environment and the USDA has not lost its edge over the private analysts with the increased availability of data and technical tools for its analysis.
This conclusion is also supported by the results of informational value analysis that indicate that informational value of USDA forecasts has not decreased but rather increased over time with the largest reductions in market forecast variance resulting from soybean, corn, and wheat Acreage and Prospective Planting report releases in the most recent subsample, 2002–2019. These forecasts, along with May through July wheat production forecasts, tend to have the largest informational value in both 1983–2001 and 2002–2019 subsamples. The largest improvements in informational value between the last two subperiods are observed for soybean Acreage and Production forecasts as well as corn acreage and August and October production forecasts. This evidence once again confirms that the accuracy and value of USDA forecasts did not decline with the emergence of better access to information and instead continues to rise in this increasingly competitive forecasting environment.
The fact that USDA appears to have the largest informational value and accuracy advantages in Prospective Plantings and Acreage reports highlights the importance of the survey-based approaches used for preparing these forecasts. On the other hand, the emergence of remote sensing technology has the potential to improve the accuracy of Crop Production forecasts. Our findings demonstrate improvements in accuracy of Crop Production forecasts, particularly in corn, for both USDA and private sources. However, these accuracy improvements were larger for USDA forecasts, thus increased its relative accuracy advantage over time. These findings are consistent with the results of several recent studies (Isengildina-Massa et al., Reference Isengildina-Massa, Karali, Irwin, Adjemian and Cao2016; Ying, Chen, and Dorfman, Reference Ying, Chen and Dorfman2019; Karali et al., Reference Karali, Isengildina-Massa, Irwin, Adjemian and Johansson2019) that show that the price impact of USDA information has also increased over time and contribute additional evidence on the strong record of accuracy, value, and impact of USDA information in commodity markets. It is clear that USDA would not be able to maintain the superior informational value and relative accuracy of its forecasts without continuous updates and improvements in their forecasting approaches to include new technology, and it is important that they continue to be innovative and proactive in the future.


 Open access