


1. Introduction
The Tennessee cattle industry generated approximately $537 million in cash receipts in 2016 making it the third-largest agricultural commodity in the state (U.S. Department of Agriculture [USDA], Economic Research Service, 2017). Tennessee is primarily a cow-calf producing state, and nearly all feeder cattle are shipped to feedlots in the midwestern United States to be finished and harvested (Lewis et al., Reference Lewis, Griffith, Boyer and Rhinehart2016b). In 2016, only 64,900 head of cattle were slaughtered in Tennessee of the 886,000 total beef cows that calved in the state; thus, only approximately 7% of cattle originating in Tennessee were harvested in-state (USDA, National Agricultural Statistics Service, 2017a, 2017b).
There are several reasons cattle are not commonly finished in Tennessee and the southeastern United States on a larger scale. The primary reason is because of the cattle feeding and slaughter facility infrastructure already being established in other parts of the country. The infrastructure was established in many of these regions because of comparative advantages in grain production or climatic advantages. Tennessee feed grain production and feed grain accessibility are relatively small compared with major cattle feeding states such as Kansas, Nebraska, Iowa, and Minnesota. Similarly, major cattle feeding regions such as Texas, Oklahoma, New Mexico, and Colorado have more favorable climatic conditions because cattle being finished in Tennessee would struggle with the humidity during the summer months and with wet and muddy conditions during the winter months.
Despite the reasons why cattle are currently not finished in Tennessee, consumer interest in locally sourced foods could result in price premiums for producers to sell their cattle in-state, which could help overcome cost disadvantages Tennessee producers currently face. Recently, Tennessee's Governor Haslam challenged policy makers and state agricultural leaders to develop a plan to help expand the agricultural and forestry industries within the state (Johnson, Upchurch, and Arrington, Reference Johnson, Upchurch and Arrington2013). One approach identified was to expand marketing opportunities for Tennessee producers. Given this and growing consumer interest in local foods, it is possible that Tennessee cattle producers could expand their marketing opportunities by selling Tennessee-produced beef. However, there was no state-certified beef labeling program in Tennessee at the time of this research.
Although there is no Tennessee beef state-labeling program, cattle producers may become certified for passing the Advanced Master Beef Producer (AMBP) and the Beef Quality Assurance (BQA) programs. The AMBP is a University of Tennessee Extension Service program that covers topics cattle producers may find helpful in the management of their businesses such as marketing and management, production economics, genetics, cattle handling and transport, forages, and other cattle industry and cattle health issues (University of Tennessee Beef and Forage Center, 2016). The BQA program is a nationally coordinated, state-implemented program that can be used by both U.S. beef producers and consumers to better understand husbandry techniques and scientific knowledge about emerging herd management methods (BQA, 2016). Unfortunately, the level of consumer awareness regarding producer participation in these programs is likely limited.
The goal of this article is to use a choice experiment to determine Tennessee consumer willingness to pay (WTP) for steak and ground beef labeled as Tennessee Certified Beef (TCB), labeled as produced by cattle producers who have completed AMBP and BQA programs, and labeled with other attributes that would likely appear on TCB (e.g., grass-fed, Certified Angus Beef [CAB], and no hormones administered). This study also examines consumer WTP for the TCB label interacted with the various product attributes. For example, it is hypothesized that steak that is TCB and also CAB will garner a greater premium than steak that is only CAB. Additionally, the impact of providing participants with information regarding the label definitions on consumer WTP will be determined. If results show that a TCB label and a label indicating farmers completed AMBP and BQA programs results in increased WTP for steak and ground beef, this would indicate that Tennessee cattle producers could benefit from these labeling programs.
2. Previous Research
Several previous studies have examined consumer preferences for attributes on beef products ranging from local attributes (e.g., Adalja et al., Reference Adalja, Hanson, Towe and Tselepidakis2015; Carpio and Isengilidina-Massa, Reference Carpio and Isengilidina-Massa2008; Franken, Parcell, and Tonsor, Reference Franken, Parcell and Tonsor2011; Maynard, Burdine, and Meyer, Reference Maynard, Burdine and Meyer2003; Mennecke et al., Reference Mennecke, Townsend, Hayes and Lonergan2007) to attributes describing the production process of the cattle (e.g., Carlberg, Froehlich, and Ward, Reference Carlberg, Froehlich and Ward2007; Franken, Parcell, and Tonsor, Reference Franken, Parcell and Tonsor2011; Grannis, Hooker, and Thilmany, Reference Grannis, Hooker and Thilmany2000; Mennecke et al., Reference Mennecke, Townsend, Hayes and Lonergan2007; Taylor and Tonsor, Reference Taylor and Tonsor2013). Carlberg, Froehlich, and Ward (Reference Carlberg, Froehlich and Ward2007) surveyed consumers to determine WTP for four hypothetical branded beef attributes (guaranteed tender, premium, breed-specific, and organic) and found a premium ranging from $1.49 to $2.44 per pound for rib-eye steak. Franken, Parcell, and Tonsor (Reference Franken, Parcell and Tonsor2011) found that local and U.S.-produced beef as well as natural and grass-fed/lean attributes played an important role in attracting Missouri consumers to consider these products. Mennecke et al. (Reference Mennecke, Townsend, Hayes and Lonergan2007) indicated that region of origin is the most important factor affecting consumer's utility, followed by animal breed, traceability, and animal feed attributes. Grannis, Hooker, and Thilmany (Reference Grannis, Hooker and Thilmany2000) suggested that steak and ground beef consumers placed the most value on hormone-free beef. Adalja et al. (Reference Adalja, Hanson, Towe and Tselepidakis2015) estimated consumer WTP for locally produced ground beef and found that Maryland consumers were willing to pay premiums of $2.71 and $2.39 per pound for beef raised within 100 and 400 miles, respectively. Carpio and Isengilidina-Massa (Reference Carpio and Isengilidina-Massa2008) found that consumers would pay an average premium of 23% for local animal products in South Carolina. Maynard, Burdine, and Meyer (Reference Maynard, Burdine and Meyer2003) studied consumer WTP for various locally produced meats in Kentucky including ground beef and beef steaks. About 20% of respondents stated they were willing to pay a 40% premium for local beef steak, and 52% of respondents stated they were willing to pay a 20% premium. When asked about WTP for locally produced ground beef, 15% of the consumers indicated they were willing to pay the 40% premium, and 64% indicated they would pay a 20% premium. Revealed preference research by Taylor and Tonsor (Reference Taylor and Tonsor2013) used a Rotterdam demand model to investigate the impact of U.S. mandatory country-of-origin labeling (MCOOL) on meat demand. They failed to detect any impact of MCOOL on consumer meat demand.
Studies have assessed product differentiation that would have the potential to help create specialized products garnering premiums in states such as Tennessee, Missouri, and Texas (Dobbs et al., Reference Dobbs, Jensen, Leffew, English, Lambert and Clark2016; Franken, Parcell, and Tonsor, Reference Franken, Parcell and Tonsor2011; Hanagriff, Rhoades, and Wilmeth, Reference Hanagriff, Rhoades and Wilmeth2009). Franken, Parcell, and Tonsor (Reference Franken, Parcell and Tonsor2011) determined that consumers were willing to pay the highest premium for a Kansas City strip steak with the attribute of grass-fed/lean, and that the attribute locally produced garnered a higher premium than nature friendly, low carbon footprint, and U.S. produced. Hanagriff, Rhoades, and Wilmeth (Reference Hanagriff, Rhoades and Wilmeth2009) found that 59% of participants indicated the attribute of locally grown in Texas as either moderately or always important when buying beef. Dobbs et al. (Reference Dobbs, Jensen, Leffew, English, Lambert and Clark2016) studied metro consumer WTP for steaks and ground beef produced in Tennessee and found that consumers would be willing to pay a premium of 54.39% for rib-eye beef steaks and 49.67% for 85% lean/15% fat ground beef produced in the state. Although Dobbs et al. (Reference Dobbs, Jensen, Leffew, English, Lambert and Clark2016) lends credence to metro Tennessee consumers’ premium for locally produced beef, this study provides a comprehensive look at overall (metro and nonmetro) Tennessee consumers’ WTP. Our study also provides valuable information on Tennessee consumers’ WTP for other attributes (e.g., certification in AMBP and BQA) in addition to Tennessee-produced beef.
3. Methods and Procedures
3.1. Choice Experiments
Previous literature states that choice experiments are a useful method for eliciting consumer preferences in accordance with the random utility theory (Adamowicz et al., Reference Adamowicz, Boxall, Williams and Louviere1998). Random utility theory states that if consumers are given the choice between two products with different attributes, they will choose to purchase the product maximizing their utility given their specific constraints (Loureiro and Umberger, Reference Loureiro and Umberger2007; McFadden, Reference McFadden and Zarembka1974). An online choice experiment using Qualtrics was employed to elicit consumer WTP for USDA Choice boneless rib-eye steaks and 85% lean/15% fat ground beef containing labels related to TCB.Footnote 1 In each choice set, it was assumed that consumers would choose the product that maximizes their utility given their budget.
Each choice experiment survey participant was required to be a Tennessee resident over the age of 18 and a purchaser of beef for their household. At the beginning of the survey, consumers were asked the following question, “What beef products do you purchase (select all that apply)?” The options available were “steak,” “ground beef,” and “neither.” If participants responded “steak,” they were assigned to the steak treatment and only saw choice sets relating to steak. If they responded “ground beef,” they were assigned to the ground beef treatment and only saw choice sets relating to ground beef. Consumers who chose both “ground beef” and “steak” were randomly assigned to either the steak or ground beef treatments. Consumers who chose neither option were not allowed to continue the survey. Qualtrics was hired to collect 408 completed usable surveys for the steak treatment and 408 completed usable surveys for the ground beef treatment.
Within the steak and ground beef treatments, participants were randomized into either the control treatment (CT) or the information treatment (IT). Participants in the IT were provided the definitions of the different beef attributes that appear in the Appendix. Results of the IT were compared with the CT to determine if the informed consumer had a different WTP for specific attributes compared with consumers who were not given the definitions. In all treatments, participants were given a cheap talk script prior to choice set completion following Tonsor and Shupp (Reference Tonsor and Shupp2011) to reduce hypothetical bias. Studies have shown that hypothetical bias can occur in hypothetical experimental settings as consumers tend to overstate the amount of money they are willing to pay when not faced with spending real money (Cummings and Taylor, Reference Cummings and Taylor1999; Tonsor and Shupp, Reference Tonsor and Shupp2011).
Table 1 shows the attribute and attribute levels for the choice sets. Price levels for the steaks ranged from $5.99/lb. to $11.99/lb., and the price levels for ground beef ranged from $1.99/lb. to $4.99/lb. The four price levels were chosen based on the prevailing USDA, Agricultural Marketing Service (2016) National Retail Report for beef, Southeast region average prices for USDA Choice boneless rib-eye steaks and for ground beef with 80%–89% fat content at the time the survey was launched. In addition to price, the other attributes were TCB; Master Quality Raised Beef (MQRB), which is a label indicating cattle producers completed AMBP and BQA programs; CAB; no hormones administered; and grass-fed.
Table 1. Attribute Descriptions and Levels Included in the Choice Experiments

Note: Price levels were based on the average weighted price for each beef product obtained from the National Retail Report for beef from the USDA, Agricultural Marketing Service at the time the survey was launched in September 2016.
Pretesting of the survey wording and content took place from April through August 2016 among 20 undergraduate and graduate students at the University of Tennessee. A sequential-stage approach similar to Scarpa, Campbell, and Hutchinson (Reference Scarpa, Campbell and Hutchinson2007) and Scarpa et al. (Reference Scarpa, Zanoli, Bruschi and Naspetti2013) was used to generate the choice set design. In the first stage, the choice set design was generated using an Ngene orthogonal design with interaction terms (ChoiceMetrics, 2016). For the Ngene orthogonal design, no prior information regarding the attribute coefficients was used in the programming of the design; thus, Ngene assumed the priors to be zero (ChoiceMetrics, 2016). A soft launch of the survey using 80 Tennessee consumers took place in the beginning of September 2016 using a Qualtrics panel. Participants answered the choice sets that were designed using the Ngene orthogonal design with interaction terms that assumed no priors. In the second stage, data from this soft launch were used to estimate a random parameter logit (RPL) model with interaction terms. The estimated coefficient estimates from the RPL model were then included as prior information in creating an Ngene efficient design with interactions terms (ChoiceMetrics, 2016). The specific efficient design was chosen based on having a minimized D-error, which indicates that the design was the most efficient given the number of choice sets and blocks (ChoiceMetrics, 2016). The full survey was then launched at the end of September 2016, and data were collected on 816 Tennessee consumers using a Qualtrics panel.
The survey design contained two blocks and 12 choice sets in each block for both the ground beef and the steak treatments. Each survey participant only saw 12 choice set questions to avoid fatigue effects (Savage and Waldman, Reference Savage and Waldman2008). The ordering of the choice sets was randomized to avoid ordering effects (Loureiro and Umberger, Reference Loureiro and Umberger2007). Participants were presented with choice sets allowing them to choose between two alternatives with different attributes, or they had the option to choose neither of the products. Figures 1 and 2 show examples of how the steak and ground beef choice sets were presented to consumers.
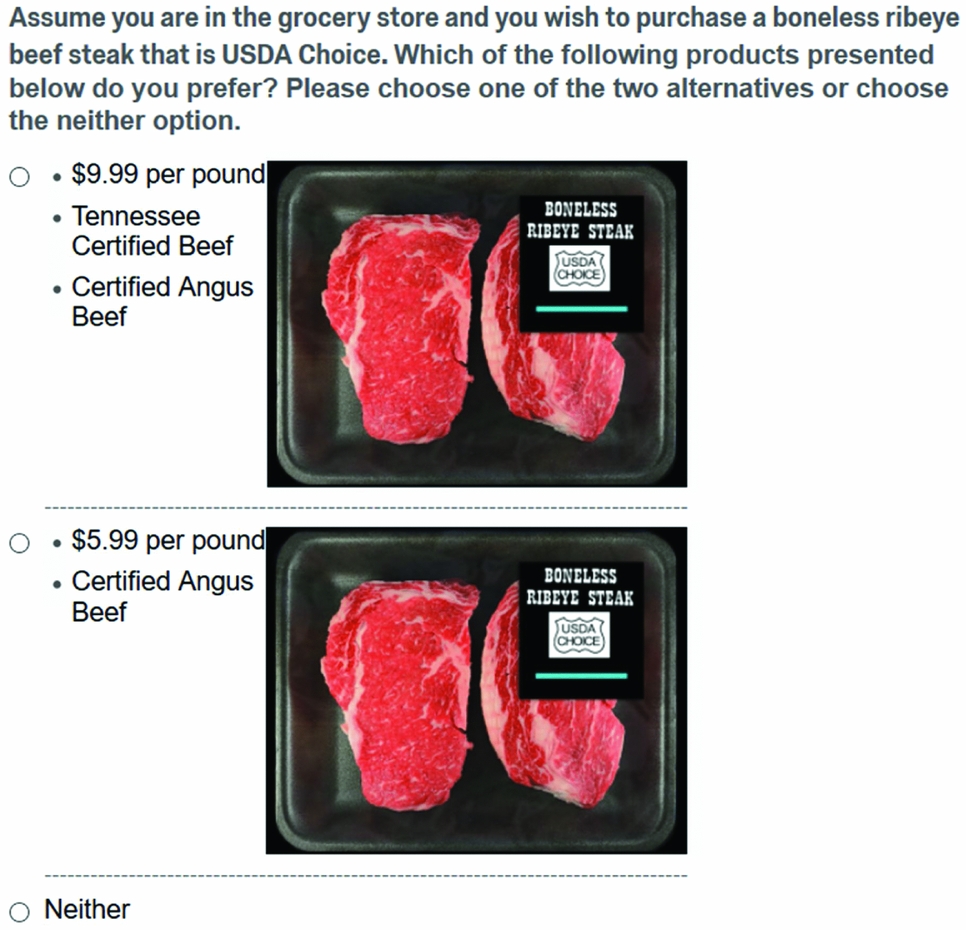
Figure 1. Example of Steak Choice Set
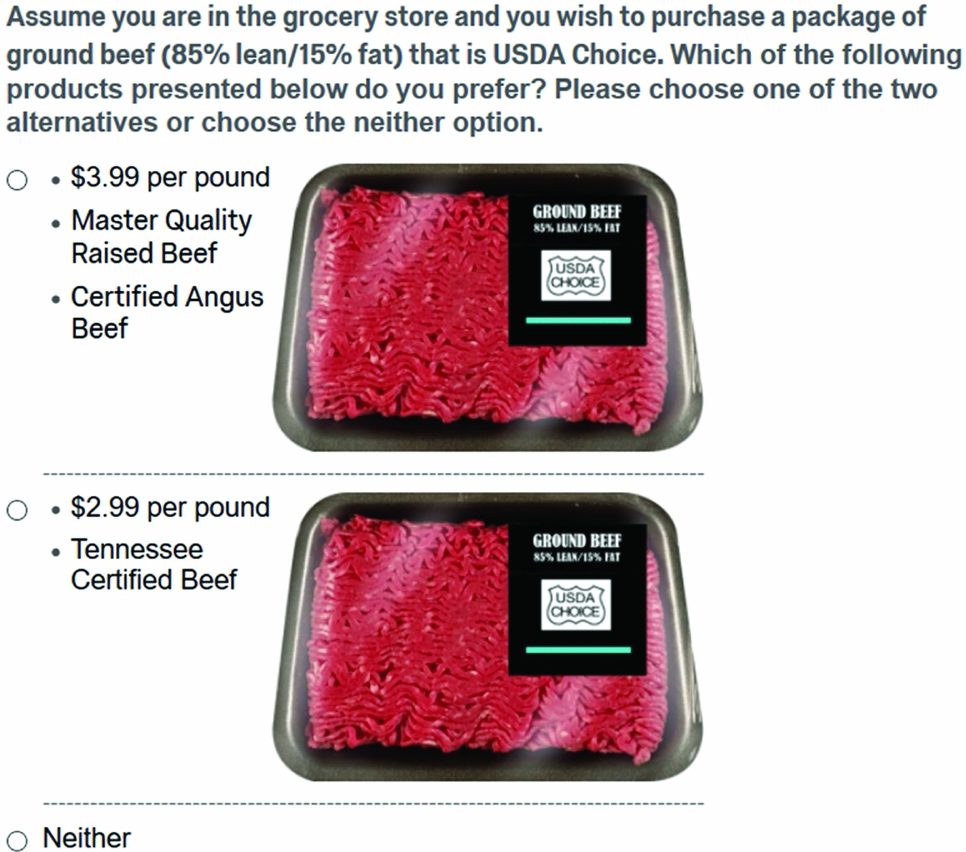
Figure 2. Example of Ground Beef Choice Set
3.2. Model Estimation
A linear random utility framework was used to determine the utility each participant received from each beef alternative j, within each choice scenario c. Each survey participant n (1,. . ., n) faced a total of c (c = 1,. . .,12) choice scenarios for USDA Choice boneless rib-eye beef steaks or USDA Choice 85% lean/15% fat ground beef. Following Train (Reference Train2003), the utility-maximizing derivation for each individual n for each of two beef alternatives j, in each choice scenario c can be represented by
 $$\begin{equation}
{U_{njc}} = \ {{\bm{\beta }}_n}{{\bm{X}}_{njc}} + \ {\varepsilon _{njc}},
\end{equation}$$
$$\begin{equation}
{U_{njc}} = \ {{\bm{\beta }}_n}{{\bm{X}}_{njc}} + \ {\varepsilon _{njc}},
\end{equation}$$
where Xnjc are the observed attribute variables that relate to alternative j and decision maker n for each choice scenario c; βn is a vector of coefficients of these variables for individual n, which represents the person's tastes; and εnjc is a random error term that is independent and identically distributed (iid) extreme value. The coefficients vary over individuals in the population with density f(β). The density, f(β), is a function of the parameters θ, which represent the mean and covariance for the β’s in the population when β is normally distributed (Revelt and Train, Reference Revelt and Train2000).
To analyze the choice set data, an RPL model was utilized. The RPL differs from the standard logit in three ways: it allows for random taste variation, it accounts for correlation in unobserved factors over time, and it permits unrestricted substitution patterns (Revelt and Train, Reference Revelt and Train1997; Train, Reference Train2003). The RPL allows for taste heterogeneity in preferences across consumers by specifying the attribute coefficients as random, which reflects the heterogeneity of individual consumers’ preferences. An RPL model is appropriate for this study considering there is likely unobserved heterogeneity present in Tennessee consumers’ preferences for steak and ground beef products carrying different attribute labels.
By incorporating the beef attributes to equation (1), the utility function can be specified as
 $$\begin{eqnarray}
&&{U_{njc}} = {\beta _0}Pric{e_{njc}} + {\beta _1}TC{B_{njc}} + {\beta _2}CA{B_{njc}} + {\beta _3}G{F_{njc}} + {\beta _4}MQR{B_{njc}} \nonumber\\
&&\quad +\, {\beta _5}N{H_{njc\ }}+ {\beta _6}TC{B_{njc}} \times CA{B_{njc}} + {\beta _7}TC{B_{njc}} \times G{F_{njc}} + {\beta _8}TC{B_{njc}} \nonumber\\
&&\quad\times\, MQR{B_{njc}} + {\beta _9}TC{B_{njc}} \times N{H_{njc}} + {\beta _{10}}NEITHE{R_{njc}} + {\varepsilon _{njc}},
\end{eqnarray}$$
$$\begin{eqnarray}
&&{U_{njc}} = {\beta _0}Pric{e_{njc}} + {\beta _1}TC{B_{njc}} + {\beta _2}CA{B_{njc}} + {\beta _3}G{F_{njc}} + {\beta _4}MQR{B_{njc}} \nonumber\\
&&\quad +\, {\beta _5}N{H_{njc\ }}+ {\beta _6}TC{B_{njc}} \times CA{B_{njc}} + {\beta _7}TC{B_{njc}} \times G{F_{njc}} + {\beta _8}TC{B_{njc}} \nonumber\\
&&\quad\times\, MQR{B_{njc}} + {\beta _9}TC{B_{njc}} \times N{H_{njc}} + {\beta _{10}}NEITHE{R_{njc}} + {\varepsilon _{njc}},
\end{eqnarray}$$
where Price represents the price of one beef alternative j, TCB represents the dummy variable equal to 1 if the beef alternative j was labeled as TCB and 0 if it was not, CAB represents the dummy variable equal to 1 if the beef alternative j was labeled as CAB and 0 otherwise, GF represents the dummy variable equal to 1 if the beef alternative j was labeled as grass-fed and 0 otherwise, NH represents the dummy variable equal to 1 if the beef alternative j was labeled as no hormones administered and 0 otherwise, and MQRB represents the dummy variable equal to 1 if the beef alternative j was labeled as MQRB and 0 otherwise. Equation (2) includes the interactions between TCB and each of the other possible attributes. An example of an interaction variable is TCB × CAB, which represents the dummy variable equal to 1 if the beef alternative j was labeled as both TCB and CAB and 0 if not. NEITHER is the dummy variable equal to 1 if the participant chose the neither option and 0 otherwise.
The parameter distributions were assumed to be independent normal distributions for the estimated model. The price coefficient was fixed across all individuals; thus, the WTP for each nonprice attribute has the same distribution as the attribute's coefficient. The RPL estimates were obtained using a simulated maximum likelihood employing 250 Halton draws. The software NLogit was used to estimate the RPL model and obtain estimated parameter coefficients (Econometric Software Inc., 2012). The code was designed for panel data, and it accounted for the correlation over choice tasks in unobserved utility arising when there are repeated choices by a given individual. The panel version of the RPL was used because each participant's choices make a panel of 12 choices for the steak and ground beef.
3.3. Willingness to Pay
WTP estimates for the noninteraction terms were calculated using the following equation:
 $$\begin{equation}
WTP_{noninteractions} = \frac{\beta _k}{ -\beta _0},
\end{equation}$$
$$\begin{equation}
WTP_{noninteractions} = \frac{\beta _k}{ -\beta _0},
\end{equation}$$
where βk is the specific attribute coefficient and k = 1,. . .,5, and β0 is the price coefficient. The variance of the WTP for the noninteraction coefficients was calculated following Daly, Hess, and de Jong (Reference Daly, Hess and de Jong2012):
 $$\begin{equation}
{\left( {\frac{{{\beta _1}}}{{{\beta _0}}}} \right)^2}\left( {\frac{{{\omega _{11}}}}{{\beta _1^2}} + \frac{{{\omega _{00}}}}{{\beta _0^2}} - 2\frac{{{\omega _{10}}}}{{{\beta _1}{\beta _0}}}} \right),
\end{equation}$$
$$\begin{equation}
{\left( {\frac{{{\beta _1}}}{{{\beta _0}}}} \right)^2}\left( {\frac{{{\omega _{11}}}}{{\beta _1^2}} + \frac{{{\omega _{00}}}}{{\beta _0^2}} - 2\frac{{{\omega _{10}}}}{{{\beta _1}{\beta _0}}}} \right),
\end{equation}$$
where β1 is the parameter of the attribute and β0 is the price parameter, respectively; ω11 is the variance of the parameter estimate; ω00 is the variance of the price; and ω10 is the covariance of the price and the specific attribute coefficient. The square root of equation (4) is the standard error of the noninteraction WTP and is used in the t-ratio test to determine the WTP estimate statistical significance. The 95% WTP estimate confidence intervals were also calculated by adding and subtracting the standard error multiplied by the 95% critical value of 1.96 from the WTP estimates.
WTP estimates for the interaction terms were calculated using the following equation:
 $$\begin{equation}
WT{P_{Interaction}} = \left( {{\beta _1} + {\beta _2} + {\beta _d}} \right)\ / - {\beta _0},
\end{equation}$$
$$\begin{equation}
WT{P_{Interaction}} = \left( {{\beta _1} + {\beta _2} + {\beta _d}} \right)\ / - {\beta _0},
\end{equation}$$
where β1 and β2 are the coefficients of attributes 1 and 2, respectively; βd is the coefficient of the interaction term of attributes 1 and 2; and β0 is the coefficient of the price. The WTP significance for the interaction terms was estimated using the Delta method and following Daly, Hess, and de Jong (Reference Daly, Hess and de Jong2012) and Syrengelas et al. (Reference Syrengelas, DeLong, Grebitus and Nayga2017). From Syrengelas et al. (Reference Syrengelas, DeLong, Grebitus and Nayga2017), the variance of the interaction WTP is the following:
 $$\begin{eqnarray}
&&{\left( { - \frac{1}{{{\beta _0}}}} \right)^2} \times \ \left[ {{\omega _{11}} + {\omega _{22}} + {\omega _{dd}} + 2 \times \left( {{\omega _{21}} + {\omega _{d1}} + {\omega _{d2}}} \right)} \right] + \left( { - \frac{1}{{{\beta _0}}}} \right) \nonumber\\
&&\quad\times \,
\left( {\frac{{{\beta _1} + {\beta _2} + {\beta _d}}}{{ - {\beta _0}^2}}} \right) \times \ \left[ {2 \times \left( {{\omega _{01}} + {\omega _{02}} + {\omega _{0d}}} \right)} \right] + {\left( {\frac{{{\beta _1} + {\beta _2} + {\beta _d}}}{{ - {\beta ^2}}}} \right)^2} \times \ {\omega _{00}},\nonumber\\
\end{eqnarray}$$
$$\begin{eqnarray}
&&{\left( { - \frac{1}{{{\beta _0}}}} \right)^2} \times \ \left[ {{\omega _{11}} + {\omega _{22}} + {\omega _{dd}} + 2 \times \left( {{\omega _{21}} + {\omega _{d1}} + {\omega _{d2}}} \right)} \right] + \left( { - \frac{1}{{{\beta _0}}}} \right) \nonumber\\
&&\quad\times \,
\left( {\frac{{{\beta _1} + {\beta _2} + {\beta _d}}}{{ - {\beta _0}^2}}} \right) \times \ \left[ {2 \times \left( {{\omega _{01}} + {\omega _{02}} + {\omega _{0d}}} \right)} \right] + {\left( {\frac{{{\beta _1} + {\beta _2} + {\beta _d}}}{{ - {\beta ^2}}}} \right)^2} \times \ {\omega _{00}},\nonumber\\
\end{eqnarray}$$
where β0 is the coefficient of the price; ω11 is the variance of attribute 1; ω22 is the variance of attribute 2; ωdd is the variance of the interaction coefficient of attributes 1 and 2; ω21 is the covariance of attributes 1 and 2; ωd1 is the covariance of the interaction term and attribute 1; ωd2 is the covariance of the interaction term and attribute 2; β1 and β2 are the coefficients of attributes 1 and 2, respectively; βd is the coefficient of the interaction term of attributes 1 and 2; ω01 is the covariance of price and attribute 1; ω02 is the covariance of price and attribute 2; ω0d is the covariance of the price and the interaction coefficient; and ω00 is the variance of price. The square root of equation (6) is the standard error of the interaction WTP and is used in the t-ratio test to determine the statistical significance of the interaction WTP. WTP confidence intervals were also calculated from the standard error as explained previously.
3.4. Estimating TCB Market Share
Following Tonsor and Shupp (Reference Tonsor and Shupp2011), the TCB market share for steak and ground beef was also examined. The Krinsky and Robb (Reference Krinsky and Robb1986) method was used to simulate 1,000 WTP estimates of TCB for each of the treatments. Next, the WTP distribution percentiles were created, which show the associated WTP value at each population percentile. This can be interpreted as providing an estimate of the percentage of the population that would pay a certain value for TCB across the WTP distribution range. The difference in WTP distributions between the CT and IT for TCB steak and ground beef was then tested using the Poe, Giraud, and Loomis (Reference Poe, Giraud and Loomis2005) complete combinatorial test.
4. Results and Discussion
4.1. Survey Participants’ Characteristics
Consumer demographics for the surveyed participants appear in Table 2. The t-tests were used to determine if the demographics for participants in the CT and IT were statistically different. Among the participants in the steak treatment, there was a higher percentage of female respondents in the CT than the IT (Table 2). For participants in the ground beef treatment, there were significant differences in race, education, and household size (Table 2). Therefore, results between treatments should be viewed with caution because differences in WTP could be attributed to the differences in these demographics. However, no differences were found for median age, household income, children under 12, farm background, type of region or roots, area of residence, or participants’ beliefs that the survey responses would be used to analyze the feasibility of a TCB program.
Table 2. Sample Demographics by Treatment and Product and Population Demographics for Tennessee
a Percent of respondents answering they live in a rural area compared with a city center or suburbia.
b Percentage of respondents who consider their roots to be rural compared with urban or suburban.
c Areas created based on the Tennessee “Three Grand Divisions” based on county of residence (Tennessee Secretary of State, 2016).
d Participant's belief that their answers will be used to analyze the feasibility of Tennessee Certified Beef, with 1 = “Not at All” to 6 = “Very Much.”
e Tennessee Department of Economic and Community Development (2016).
f U.S. Census Bureau (2016).
Note: Asterisks (***, **, *) denote statistically different means between the control treatment and the information treatment sample at the 1%, 5%, and 10% level, respectively.
When comparing the respondents’ demographics with those of Tennessee residents, Table 2 shows that participants’ average age, race, education, household income, household size, and residence in east, middle, and west Tennessee were very similar to the average Tennessee population. However, the percentage of female respondents in the sample was higher than the state's average. This discrepancy is expected as survey participants who did not purchase beef for their household were not permitted to continue with the survey, and women are typically the primary grocery shoppers for many households. However, results should be viewed with caution when considering male WTP for the different types of beef labeled with different attributes.
4.2. Random Parameters Logit Model Results
The RPL model results for the steak and ground beef treatments for both the CT and the IT are presented in Table 3.Footnote 2 For both the steak and ground beef treatments, an increase in price resulted in a negative and significant impact on consumer utility in both the CT and IT, which is expected. Consumers had significant and positive utility for all of the labels in all treatments. TCB and the no-growth-hormones-administered label increased consumer utility the most among all treatments. The signs on the interaction term coefficients were mixed; however, they are best compared once computed into WTP. Many of the standard deviation estimates were significant, which indicates the RPL model was appropriate because preference heterogeneity was present.
Table 3. Random Parameter Logit Results for Steak and Ground Beef by Treatment

Note: Asterisks (***, **, *) indicate significance at the 1%, 5%, and 10% level, respectively.
4.3. Willingness-to-Pay Results
WTP estimates and their 95% confidence intervals for all treatments are provided in Table 4.Footnote 3 Both uninformed and informed consumers indicated positive and significant WTP for all of the attributes and the interacted labels. In the steak treatment, consumers indicated the highest WTP for TCB in both treatments, with no hormones administered garnering the second-highest premium. Uninformed consumers were willing to pay an additional $2.42/lb. for TCB steak and $2.35/lb. for steak administered no hormones. Informed consumers indicated WTP of $2.89/lb. for TCB steak and $2.71/lb. for steak with no hormones administered. For the steak treatment, both the uninformed and informed consumers had the lowest WTP for grass-fed and CAB labels; however, they were still willing to pay a positive and significant premium for both. For the beef cattle farmer certification program, MQRB, consumers in the CT and IT were willing to pay a positive premium of $1.39/lb. and $1.67/lb., respectively, when the label appeared on steak.
Table 4. Willingness-to-Pay (WTP) Estimates ($/lb.) and Confidence Intervals for Steak and Ground Beef by Treatment

Notes: Asterisks (***, **, *) indicate significance at the 1%, 5%, and 10% level, respectively. The 95% confidence intervals calculated using the Delta method appear in parentheses below WTP estimates. WTP treatment difference Wald χ2 test statistics appear in parentheses below WTP difference.
In the steak treatment, interactions between TCB and the other attributes also garnered positive and significant premiums in both treatments. The uninformed consumer was willing to pay a positive premium of $4.37/lb. for steak labeled as both TCB and no hormones administered, whereas the informed consumer was willing to pay $3.28/lb. for these combined labels. In the steak treatment, the premium for the interaction of TCB and grass-fed was $3.56/lb. when consumers were given the definitions. The interaction between TCB and grass-fed garnered the second-highest premium across both the CT and IT for the steak treatment. Uninformed consumers were willing to pay $2.62/lb. more for steak with the combined label of TCB and MQRB. Meanwhile, informed consumers were willing to pay $1.05/lb. more for steak with the combined TCB and MQRB label compared with uniformed consumers’ WTP for this product. This was the largest increase in WTP moving from the CT to the IT among all labels in the steak treatment and was found to be statistically significant using a Wald χ2 test (Table 4). Therefore, this increase in WTP suggests that among all attributes, consumers may be least knowledgeable about the TCB and MQRB labels. It is likely that consumers are unaware that beef producers complete the AMBP and BQA certification programs and what these certification programs represent.
For the ground beef treatment, the highest WTP was found to be the no-hormones-administered label followed by TCB in both the CT and IT. Ground beef consumers placed the smallest WTP value on CAB in the CT at $0.41/lb. With respect to the beef cattle farmer certification program, MQRB, uninformed consumers were willing to pay a $0.65/lb. premium in the CT and a $0.95/lb. premium in the IT. There was a significant positive WTP for all of the interactions between TCB and the other attributes (Table 4). The highest WTP for all of the interactions was for TCB and no hormones administered ($2.41/lb. in the IT), followed by TCB and grass-fed ($1.98/lb. in the IT). The smallest interaction premium was between TCB and CAB ($1.29/lb. in the CT), followed by TCB and MQRB ($1.45/lb. in the CT). Also, the informed consumers indicated a higher WTP than the uninformed consumers in the case of each of the interactions for ground beef (Table 4). The largest increase in WTP with the interaction of TCB across information treatments was for the interaction with no hormones administered ($0.78/lb.), and the smallest was for TCB and grass-fed ($0.22/lb.). Indeed, the informed consumer was willing to pay significantly more for the interaction label TCB and no hormones administered than the uniformed consumer (Table 4). These results suggest that consumers most greatly value a combination of TCB with no hormones administered, especially when provided with information about these labels.
4.4. TCB Market Share
The results of calculating the TCB market share for the CT and IT appear for steak in Figure 3 and ground beef in Figure 4. Five percent of the population was willing to pay $3.80/lb. and $4.12/lb. more for TCB steak than an unlabeled steak in the CT and IT, respectively. At a premium of $1.04/lb. and $1.71/lb., 95% of the population would choose TCB over the no-label option in the CT and IT, respectively. Although the IT TCB WTP distribution was always at a higher price level than the CT TCB WTP distribution at all population percentiles, the Poe, Giraud, and Loomis (Reference Poe, Giraud and Loomis2005) complete combinatorial method did not find this distribution to be statistically different.
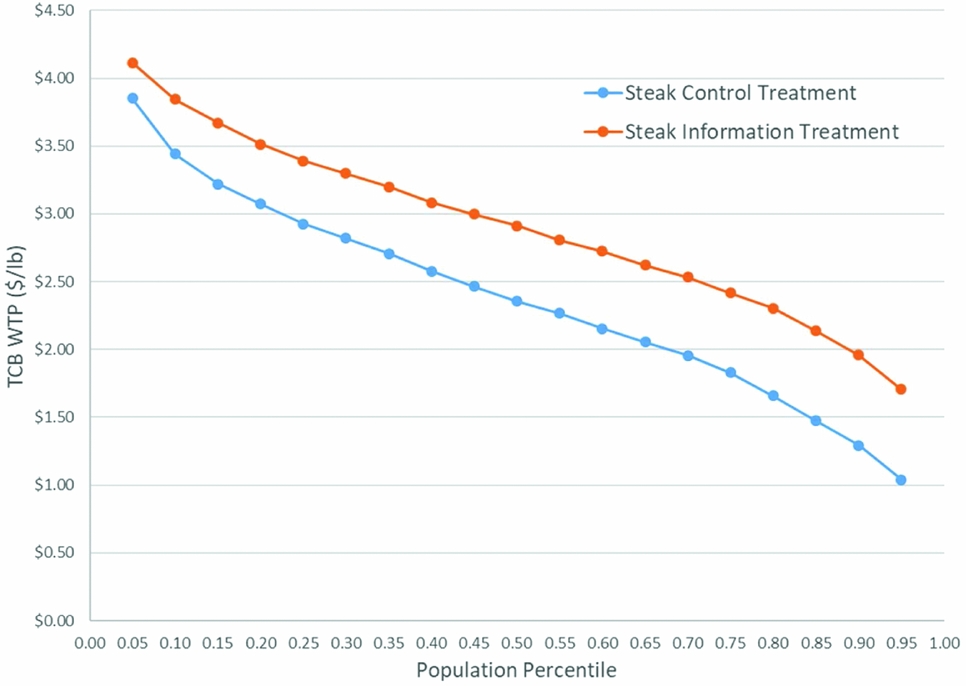
Figure 3. Willingness-to-Pay (WTP) Distributions for Tennessee Certified Beef (TCB) in the Steak Control and Information Treatments

Figure 4. Willingness-to-Pay (WTP) Distributions for Tennessee Certified Beef (TCB) in the Ground Beef Control and Information Treatments
For the ground beef treatment, 5% of the population was willing to pay $1.75/lb. and $2.23/lb. more for TCB ground beef than unlabeled ground beef in the CT and IT, respectively. At a premium of $0.52/lb. and $0.85/lb., 95% of the population would choose TCB ground beef over unlabeled ground beef in the CT and IT, respectively. Similar to the steak treatment, the Poe, Giraud, and Loomis (Reference Poe, Giraud and Loomis2005) complete combinatorial method did not find the IT and CT distributions to be statistically different; however, the IT WTP distribution was always at a higher price level than the CT WTP distribution at all population percentiles.
5. Conclusions
Tennessee currently does not have a state-certified beef labeling program. However, although many cattle producers are BQA and AMBP certified, consumers may not know this information. Therefore, the goal of this study was to determine if consumers were willing to pay more for beef products that were labeled as TCB, MQRB, and with other attributes that would likely appear with TCB and MQRB labels. Results from this study indicate Tennessee beef consumers would pay a premium for a TCB product. Furthermore, for steak, consumers placed the greatest premium on the TCB label. Although consumers would also pay a premium for beef raised by a Tennessee cattle farmer who is AMBP and BQA certified, these premiums were smaller than those from the TCB program. In the case of TCB and MQRB programs, information about the program increased the amount consumers would pay for these beef labels; however, information only significantly increased WTP for steak labeled as TCB and MQRB and ground beef labeled as TCB and no hormones administered. This indicates that there could be value to producers in providing definitions regarding the labels to consumers. For both steak and ground beef, a combination of TCB and the MQRB program also resulted in increased WTP, suggesting consumers would place additional value on beef being certified under these programs.
For both steak and ground beef, consumers indicated a substantial interest in the attribute no hormones administered. This attribute garnered the second-highest premium in reference to steak and the highest premium for ground beef regardless of whether the consumers were informed or uniformed regarding its USDA definition. These findings indicate consumers highly desire this attribute, and producers may want to evaluate the feasibility of including this in their production practices in order to capture additional value. If this is a production practice that producers already utilize, then they may want to consider labeling their beef as such in order to garner additional premiums.
In both treatments for both beef products, consumers placed high premiums on products carrying both the TCB and the grass-fed labels. This is of interest because when examining the attributes individually, grass-fed garnered some of the lowest premiums. One explanation for this could be that consumers who prefer locally raised beef from Tennessee also prefer grass-fed beef. If TCB is successful in becoming a state-certified labeling program, it is likely many producers would also be able to indicate that their beef is grass-fed because many beef cattle are raised on grass in Tennessee.
This research provides valuable information in evaluating the feasibility of finishing beef in-state for added value to Tennessee beef producers. Consumers were willing to pay a positive premium for TCB, CAB, grass-fed beef, MQRB, and beef that has had no hormones administered. Research findings also indicate promotion and advertising that provide the definitions of these attributes can help consumers make informed decisions and could result in additional premiums for attributes. Although this study provides valuable consumer information, additional beef cattle farmer research is needed to examine the feasibility of implementing these finishing and labeling programs. Research should examine if the premiums estimated in this study are sufficient to cover the additional production and management costs to attain these labeling standards. It is unknown what certification costs farmers may face to have their beef certified as TCB because this program does not currently exist. Producers would have to cover the certification costs with the premiums they receive from their beef to make it profitable to become certified to sell TCB. For example, if a producer sells 100 pounds of ground beef as TCB and receives a premium of $1.15/lb. (Table 4), then the producer would earn an additional $115 for being certified to sell TCB. As long as the certification cost was less than $115, the producer would benefit from being certified to sell TCB, assuming their other production costs stay constant. Currently, BQA costs $40 every 3 years for certification, and AMBP typically costs $50 to $150 every 3 years.Footnote 4 This research found that producers would gain premiums for their beef by conveying to consumers that they are BQA and AMBP certified.
Additional research could also evaluate why the TCB label increases consumer WTP for ground beef and steak. It is possible that part of this premium exists simply because consumers were provided with information regarding the origin of the cattle (e.g., Tennessee). As suggested by a reviewer, providing participants with information that most beef comes from cattle in Texas, Kansas, and Nebraska would help control for the origin impact on WTP and would result in WTP estimates entirely attributable to consumers’ desire for a TCB product. Future research should also evaluate actual graphic labels that could appear on products that are TCB and MQRB to determine if graphic labels compared with only text (e.g., how the attributes appeared in this choice experiment) would increase WTP for TCB and MQRB. For example, research has used shelf simulation in choice experiments to determine WTP for products carrying graphic labels that would actually appear on the products when presented to participants in a grocery store (e.g., Lewis et al., Reference Lewis, Grebitus, Colson and Hu2016a; Mueller Loose, Peschel, and Grebitus, Reference Mueller Loose, Peschel and Grebitus2013; Syrengelas et al., Reference Syrengelas, DeLong, Grebitus and Nayga2017). Additionally, to further evaluate the feasibility of a TCB program, research is also needed to determine Tennessee cattle producers’ willingness to supply a TCB program.
Appendix
Tennessee Certified Beef
This certification indicates the animal was born, raised, and harvested in Tennessee and graded U.S. Department of Agriculture (USDA) Choice or Prime.
Master Quality Raised Beef
This indicates that the beef purchased originated from cattle that were raised throughout their entire life span by farmers who are certified in the following two programs: (1) the Advanced Master Beef Producer (AMBP) program and (2) the Beef Quality Assurance (BQA) program.
AMBP is an educational program provided by the University of Tennessee designed to help cattle farmers improve cattle health management and cattle farm profitability. This program is open to any cattle farmers in the United States. The AMBP certification is given to producers who complete the program.
BQA is a nationally coordinated, state-implemented program that provides systematic information to U.S. beef producers and beef consumers of how common husbandry techniques can be coupled with accepted scientific knowledge to raise cattle under optimum management and environmental conditions. BQA guidelines are designed to make certain all beef consumers can take pride in what they purchase and can trust and have confidence in the entire beef industry.
Certified Angus Beef
USDA graders inspect black-hided cattle (typical of the Angus breed) and give them a grade. All beef considered for the brand must grade in the top two-thirds of Choice or Prime.
Grass-Fed
This indicates that the animal was fed only grass and forage.
No Hormones Administered
The term “no hormones administered” may be approved for use on the label of beef products if sufficient documentation is provided to the USDA by the beef producer showing no hormones have been used in raising the animals.


 Open access