


1. Introduction
Profit considerations strongly shape inventory levels in global agri-food value chains, where factors like seasonality, weather, and production conditions often disrupt supply-demand dynamics and drive price volatility (Tomek & Kaiser Reference Tomek and Kaiser2014). Market integration – how effectively changes in supply and demand transmit across regions or along the chain – plays a pivotal role (Fackler & Goodwin Reference Fackler, Goodwin, Fackler and Goodwin2001). This study focuses on interregional integration to show how domestic infrastructure policies can enhance the efficiency and sustainability of agri-food value chains.
Because of region-specific agroclimatic conditions, food frequently moves from production zones to distant consumers. Reliable price signals, facilitated by integrated markets, are essential to avoid resource misallocation (Alderman & Shively Reference Alderman and Shively1991). In perfectly competitive agricultural markets, prices should align across regions, differing only by trade costs (Hamulczuk, Reference Hamulczuk2020). This “law of one price” helps stabilize prices and boost welfare for all value-chain actors (Guasoni & Wong Reference Guasoni and Wong2020), and it is central to food security (Hertel & Baldos Reference Hertel and Baldos2016). Still, markets often deviate from theoretical expectations, resulting in uneven price transmission (Tomek & Kaiser Reference Tomek and Kaiser2014; Sexton, Reference Sexton2013).
Many factors influence market integration, including human behavior and infrastructure (Golettia & Babub Reference Golettia and Babub1994). Transportation networks are especially critical in developing economies, shaping commodity flows (Jones & Salazar Reference Jones and Salazar2021). Telecommunications infrastructure likewise underpins efficient communication, reducing inventory-related costs. However, poor road and communication facilities often increase transaction costs (Tomek & Kaiser Reference Tomek and Kaiser2014; Foster & Briceño-Garmendia Reference Foster and Briceño-Garmendia2010). Thus, improving transport and communications is a frequent recommendation to enhance market integration (Abdulai, Reference Abdulai2000; Adeoye et al., Reference Adeoye, Dontsop, Amao and Fajimi2013). Despite its recognized importance, how these infrastructures affect market integration for food commodities in Ghana remains insufficiently explored.
Agriculture plays a pivotal role in Ghana’s economy, providing livelihoods, and significantly contributing to the national GDP. Consequently, the efficiency of agri-food value chains – particularly at the raw agricultural produce stage – becomes crucial. Ghana’s agricultural landscape is characterized by small-scale farms that produce raw commodities, which largely enter the market unprocessed. Hence, assessing the market integration efficiency of these raw goods is fundamental to understanding the overall performance of Ghana’s agri-food value chain. It will allow the government to better target its policies geographically to mitigate the impact of any price shock on vulnerable regions.
This study focuses on 21 core agricultural commodities – maize, rice (local, white), rice (imported), millet, sorghum, cowpea, groundnut, soybean, cassava (tuber), cassava (gari), cassava (kokonte), yam, plantain, tomato, pepper (dried), pepper (fresh), onion, ginger, palm fruits, red palm oil, and chicken egg. These agricultural commodities underpin Ghana’s agri-food value chain, spanning the spectrum from pre-production and farming to post-harvest handling, processing, and marketing.Footnote 1 By identifying opportunities for improvement in this pivotal stage, we aim to elucidate potential pathways for enhancing efficiency across the entire value chain. To provide empirical insight into the integration of geographically diverse food markets in Ghana, our study pursues two interconnected goals: firstly, quantifying the regional market responses to price fluctuations elsewhere, and secondly, exploring how both transport and telecommunication infrastructures impact market integration.
This study uses a two-pronged approach. First, it measures the extent and type of market integration among Ghana’s inter-regional food markets, applying cointegration and autoregressive distributed lag models to capture inter-market linkages and the speed of price adjustments. These analyses refine our understanding of market resilience under potential shocks. Second, the study investigates how infrastructural factors – transportation logistics and telecommunication networks – shape market integration via a linear regression approach. By examining how changes in these infrastructures affect inter-regional connectedness, we gain insights into their impact on the sustainability and efficiency of Ghana’s agri-food value chains.
The results reveal that Price increases tend to be corrected faster than price declines, with yams adjusting quickest at about 0.713 months and millet taking the longest at about 10.103 months. Regionally, Greater Accra shows the shortest mean adjustment period (2.36 months), whereas the Upper West exhibits the longest (4.40 months). Commodity-specific transaction costs also vary: “Tomato (Cooking)” incurs the highest cost, potentially hindering market integration, while “Egg (Chicken)” incurs the lowest, fostering quicker market responses. The Eastern region has the highest average transaction cost, possibly slowing price adjustments, while the Upper East region has the lowest outbound cost. Furthermore, high-speed internet strongly bolsters market integration by reducing information asymmetry and enabling swifter adjustments. By contrast, transportation infrastructure has a nuanced effect: well-maintained trunk roads enhance integration, while secondary and tertiary roads can impede it. Lastly, factors like geographical distance and production variations further influence both the speed of market adjustments and the associated transaction costs.
Our findings provide valuable empirical evidence towards the understanding and transformation of agri-food value chains, highlighting the importance of telecommunication and transportation infrastructure, and identifying key areas for policy attention. It offers substantial implications for the future of agri-food value chains and the role of domestic policies in shaping them, contributing to the discussion around the efficiency, sustainability, and welfare implications of agri-food value chains.
The remainder of this paper is structured as follows: Section 2 reviews existing literature on Ghanaian food market characteristics and dynamics. Section 3 explains our methods for examining market integration and infrastructure effects. Section 4 describes data sources and offers descriptive statistics, while Section 5 details findings on adjustment periods, transaction costs, and integration determinants. Section 6 discusses policy implications for enhancing Ghana’s agri-food value chains, and Section 7 concludes.
2. Background information
2.1. Food markets, key actors, and commodity flow in Ghana
Ghana is an agrarian nation characterized by diverse agroecological zones defined by climate, vegetation, and soil types (MoFA, 2021). Until December 2018, Ghana comprised 10 administrative regions; after a referendum, this increased to 16 regions (GSS, 2021). Commodities like vegetables, grains, legumes, roots and tubers, and tree nuts are produced nationwide, with regional specializations based on ecological suitability ensuring food availability and offsetting seasonal production gaps.
Tomatoes, onions, and peppers constitute significant vegetable expenditures in Ghana, with tomatoes being the most consumed vegetable, approximately 440,000 tons annually (MoFA-IFPRI, 2020), accounting for 35.2% of vegetable expenses (Asselt, Masias & Kolavalli, Reference Asselt, Masias and Kolavalli2018). Ghana’s tomato supply system functions through distinct seasonal trade regimes. During the rainy season (June – December), Techiman, a key market in Ghana’s forest region, predominantly supplies fresh tomatoes. In the dry season (December – May), supply shifts primarily to Navrongo and imports from Po, Burkina Faso, feeding major urban markets in Tamale, Kumasi, and Accra (Amikuzuno, Reference Amikuzuno2011). Onions (19% of vegetable expenses) largely originate from Niger and Mali, supplemented by local production from Ghana’s Upper East Region and peri-urban Accra gardens. Peppers account for about 9.7% of vegetable expenditure.
Grains like maize, rice, millet, and sorghum serve as staple foods. Maize is particularly vital, functioning both as food and animal feed, with leading production in Ashanti, Eastern, and Bono regions. Rice cultivation primarily occurs in Volta, Northern, and Oti regions, while millet and sorghum production dominate in Upper East, Upper West, and Northern regions (MoFA, 2021), with millet chiefly grown for subsistence (Asungre et al., Reference Asungre, Akromah, Kena and Gangashetty2021). Major legumes, including cowpeas, soybeans, and groundnuts, provide critical protein nutrition, especially soybean, which supports both human consumption and animal feed sectors (Gage et al., Reference Gage, Bangnikon, Abeka-Afari, Hanif, Addaquay, Antwi and Hale2012). Legume production is centered in Upper West (cowpea), Northern (soybean), and Savannah regions (groundnut).
Staple root crops such as cassava, yams, and plantains contribute significantly to Ghanaian diets, with cassava ranking highest in production volumes, followed by yams and plantains. Leading regions include Eastern, Ashanti, and Central for cassava; Bono East, Northern, and Upper West for yams; and Ashanti, Ahafo, and Bono East for plantains (MoFA, 2021). Palm oil, the predominant oil consumed, is primarily produced in Western, Central, and Eastern regions (Ofosu-Budu & Sarpong Reference Ofosu-Budu, Sarpong, Ofosu-Budu and Sarpong2013).
Food commodity trade in Ghana follows a decentralized, informal pathway characterized by structured yet flexible networks (Robinson & Kolavalli Reference Robinson and Kolavalli2010). Smallholder farmers, who cultivate crops according to regional ecological suitability, initiate the supply chain (See Figure 1). Frontline assemblers aggregate farm produce at farm gates, preparing commodities for large-scale distribution. Subsequently, itinerant traders, often referred to as “market queens,” purchase surplus produce, engaging in spatial arbitrage by transporting goods to urban consumer markets. They frequently pre-finance farmers, ensuring product availability but occasionally raise concerns over pricing fairness. Itinerant wholesalers transport commodities over long distances, securing regular supplies for major urban markets.

Figure 1. Flow diagram of Ghana’s food commodity trade.
Once produce reaches urban centers, resident wholesalers redistribute commodities to smaller-scale traders. Retailers, including market vendors and street hawkers, ultimately sell to consumers in traditional markets. While this decentralized system efficiently ensures food availability nationwide, it presents challenges such as price volatility, logistical constraints for perishable goods, and power imbalances between traders and producers.
2.2. Market liberalization, efficiency, and integration
Nearly four decades have passed since most sub-Saharan African countries initiated economic reforms, privatizing key sectors and removing market controls. The underpinning principle was the expectation that free markets would efficiently allocate resources (Abdulai, Reference Abdulai2000). Market efficiency is closely tied to effective price transmission (Meyer, von Cramon-Taubadel & Cramon-Taubadel, Reference Meyer, von Cramon-Taubadel and Cramon-Taubadel2004; Mgale, Yunxian & Dimoso, Reference Mgale, Yunxian and Dimoso2021). Literature indicates that agricultural market liberalization improves global price transmission (Olipra, Reference Olipra2020).
Ghana, which operates a predominantly free-market economy, ideally should exhibit integrated markets providing accurate price signals to producers, marketers, and consumers. However, factors such as market power, inventory fluctuations, varying input costs, search costs (Alderman, Reference Alderman1993; Badiane & Shively Reference Badiane and Shively1998), adverse food publicity, perishability of products, public interventions (Alderman & Shively Reference Alderman and Shively1991; Mgale, Yunxian & Dimoso, Reference Mgale, Yunxian and Dimoso2021), and inadequate road infrastructure (Brenton, Portugal-Perez & Régolo, Reference Brenton, Portugal-Perez and Régolo2014; Varela, Aldaz-Carroll & Iacovone, Reference Varela, Aldaz-Carroll and Iacovone2013) can hinder market efficiency. Furthermore, liberalization and globalization have exposed Ghana to increased competition, including from neighboring countries (United Nations Industrial Development Organization [UNIDO]). To address these challenges and enhance competitiveness, Ghana’s government adopted the value chain approach through the Food and Agricultural Sector Development Policy II (FASDEP II), aligning with the national goal of agricultural modernization (Ministry of Food and Agriculture [MoFA]).
Global value chains extend beyond firm-specific innovations to encompass integrated, systemic linkages among multiple actors contributing value-added activities to a product (Reference Kaplinsky and MorrisKaplinsky & Morris). Developing countries often face value chain challenges, including poor stakeholder cooperation (Reference MauriceMaurice) and limited value addition (Kirimi et al., Reference Kirimi2011). Ghana, like many African nations, relies heavily on agricultural production and exports, with minimal processing, limited value addition, and weak forward and backward linkages for factor flow (). Consequently, a significant proportion of agricultural produce is consumed unprocessed. Efficient market integration is thus crucial for assessing agri-food value chain performance.
The literature on market integration broadly distinguishes between spatial and vertical integration (Mgale, Yunxian & Dimoso, Reference Mgale, Yunxian and Dimoso2021). Spatial integration examines how swiftly and accurately prices adjust across geographically distinct markets (Goletti, Ahmed & Farid, Reference Goletti, Ahmed and Farid1995), whereas vertical integration focuses on price alignment at different levels along the value chain (i.e., downstream-upstream). Some researchers examine domestic markets in relation to global markets (Baquedano & Liefert Reference Baquedano and Liefert2014; Ozturk, Reference Ozturk2020; Uri et al., Reference Uri, Chomo, Hoskin and Hyberg1993; Zakari, Ying & Song, Reference Zakari, Ying and Song2014; Zorya et al., Reference Zorya, von Cramon-Taubadel, Greb, Jamora, Mengel, Würriehausen, Gillson and Fouad2014), while others focus on integration across spatially separated domestic markets. Empirical studies span diverse commodities, either single-food markets (Golettia & Babub Reference Golettia and Babub1994; Acquah & Owusu Reference Acquah and Owusu2012; Tsiboe, Dixon & Wailes, Reference Tsiboe, Dixon and Wailes2016) or entire food groups (Ozturk, Reference Ozturk2020; Zakari, Ying & Song, Reference Zakari, Ying and Song2014). Historically, pairwise correlations served as the primary tool for assessing market integration (Abdulai, Reference Abdulai2000). However, more recent work has adopted robust econometric methodologies – most commonly co-integration, error correction models, and Granger causality tests – to provide deeper insights into how prices adjust and influence one another (Abdulai, Reference Abdulai2000; Mgale, Yunxian & Dimoso, Reference Mgale, Yunxian and Dimoso2021; Ozturk, Reference Ozturk2020; Zakari, Ying & Song, Reference Zakari, Ying and Song2014; Kabbiri et al., Reference Kabbiri, Dorac, Elepud and Xavier2016).
Kabbiri et al. (Reference Kabbiri, Dorac, Elepud and Xavier2016) provides a review of market integration from a global perspective using 65 articles from 1990 to 2014 which suggest that different country food markets such as dairy, lamb, fish, wheat, and corn show mixed results for market integration. The review indicates that though studies on market integration are numerous, several countries have not advanced in market integration research. Market integration has been studied for food markets such as dairy (Jumbe, Chalmers & Revoredo-Giha, Reference Jumbe, Chalmers and Revoredo-Giha2019; Roman & Kroupová Reference Roman and Kroupová2022), pork (Miller & Hayenga Reference Miller and Hayenga2001), eggs (Vijay, Reference Vijay2020), beef (Yusufadisyukur et al., Reference Yusufadisyukur, von Cramon-Taubadel, Suharno and Nurmalina2020), broilers (Awokuse & Bernard Reference Awokuse and Bernard2007), rice (Mgale, Yunxian & Dimoso, Reference Mgale, Yunxian and Dimoso2021; Tsiboe, Dixon & Wailes, Reference Tsiboe, Dixon and Wailes2016), cassava (Igbaifua & Adeniyi Reference Igbaifua and Adeniyi2020), grains (Zakari, Ying & Song, Reference Zakari, Ying and Song2014; Kidane, Reference Kidane2022) and vegetables (Adeoye et al., Reference Adeoye, Dontsop, Amao and Fajimi2013; Jordan & VanSickle Reference Jordan and VanSickle1995; Mohapatra, Reference Mohapatra2021) in both developed and developing economies. The results from these studies indicate that animal product markets have some lags in regional price transmission and therefore show limited or long-run integration (Roman & Kroupová Reference Roman and Kroupová2022; Yusufadisyukur et al., Reference Yusufadisyukur, von Cramon-Taubadel, Suharno and Nurmalina2020; Goodwin & Schroeder Reference Goodwin and Schroeder1990). Egg markets however showed a high degree of integration when studied for different regions in India (Vijay, Reference Vijay2020). Vegetable markets are shown to be well integrated (Adeoye et al., Reference Adeoye, Dontsop, Amao and Fajimi2013) except for tomatoes which showed long-run integration in Florida, US (Jordan & VanSickle Reference Jordan and VanSickle1995) and no integration at all in some regions in Punjab, India (Mohapatra, Reference Mohapatra2021).
The literature on market integration in Ghana over a decade ago has focused on markets for maize (Abdulai, Reference Abdulai2000), and plantain (Acquah & Owusu Reference Acquah and Owusu2012; Mensah-Bonsu, Agyeiwaa-Afrane & Kuwornu, Reference Mensah-Bonsu, Agyeiwaa-Afrane and Kuwornu2017), while more recent studies have focused on soybeans (Martey, Gatti & Goldsmith, Reference Martey, Gatti and Goldsmith2020). The studies revealed that price transmission, and thus market integration, was poor in Cassava markets while maize, soybean, and tomato markets are well integrated. This study contributes to the literature in two ways 1) it examines 21 commodities across 10 regions (making about 700 market pairs) to give evidence of the current spatial market integration situation in Ghana, and 2) it accounts for the role of road and telecommunication infrastructure in the market integration situation.
3. Methodology
3.1. Extent and nature of market integration
The literature on how to measure market integration is very large, but one key feature shared amongst most of the existing studies is that the behavior of arbitragers ensures that the price differential between integrated markets is no more than transaction costs (Goodwin & Schroeder Reference Goodwin and Schroeder1991). Generally, cointegration analysis (Engle & Granger Reference Engle and Granger1987; Granger, Reference Granger1981) has been the preferred method used to assess the level of integration amongst alternative markets. In its simplest form, the main idea is that if the price series (P t ) from two markets are integrated of the same order and there exists a linear combination β”’P t which is stationary (i.e., I(0)), then they are cointegrated with cointegrating vector β which describes their long-run equilibrium relationship (Engle & Granger Reference Engle and Granger1987). The null hypothesis of interest under this simple framework is that there is no cointegration and it can be evaluated using two test statistics referred to as the Eigen value and Trace tests (Johansen, Reference Johansen1991; Johansen, Reference Johansen1988). Rejecting no cointegration implies that in the long run, the two prices move together.
Cointegration is a long-run concept and as such it sheds limited light on the price adjustment dynamics in the short run which are typically of interest to policymakers. For these price adjustment dynamics, the starting point is the Granger Representation Theorem which states that conditional on being cointegrated, the relationship between two markets can be represented in an error correction model (ECM) of the form
 $$\Delta P_{it}=\alpha _{i}+{\it ECT}_{i}e_{t-1}+\Sigma _{m}\gamma _{im }P_{it-m}+\Sigma _{m}\gamma _{jm}P_{jt-m}+u_{it}, \qquad (i=1,2), \qquad (i\neq j)$$
where P
it
(i = 1, 2) are integrated of order 1 with cointegrating vector β and error term e
t
. The key assumption for the ECM is that the deviations from the long-run equilibrium (e
t − 1) are corrected linearly via the error correction parameters, ECT
i
. Thus, rejecting the null hypothesis of ECT
i
= 0 in both markets indicate no long-run relationship between the two markets. Usually, −1 < ECT
i
< 0, implying that P
i
will fall (rise) in each period to correct ECT
i
× 100% of any positive (negative) deviation from the equilibrium condition defined by the cointegrating vector β.Footnote
2
If a smooth exponential error correction process is assumed without any further disruptions from the long-run equilibrium, then the average period of adjustment between the two markets within a certain range (r) of their long-run relationship after a disruption at time t can be computed as ${\sum _{i}\left(\rm ln\left[1-r\right]/\rm ln\left[\left(1+{\it ECT}_{i}\right)\right]\right) \over 2}$
.Footnote
3
${\sum _{i}\left(\rm ln\left[1-r\right]/\rm ln\left[\left(1+{\it ECT}_{i}\right)\right]\right) \over 2}$
.Footnote
3
Several studies reveal asymmetries (‘stickiness’ of prices) between integrated markets (Abdulai, Reference Abdulai2000; Bailey & Brorsen Reference Bailey and Brorsen1989; Cramon-Taubadel & Loy Reference Cramon-Taubadel and Loy1996; Godby et al., Reference Godby, Lintner, Stengos and Wandschneider2000; Goodwin & Piggott Reference Goodwin and Piggott2001; Mohanty, Peterson & Kruse, Reference Mohanty, Peterson and Kruse1995; Punyawadee, Reference Punyawadee1991; von Cramon-Taubadel & Loy Reference von Cramon-Taubadel and Loy1999; Wondemu, Reference Wondemu2015), which are classified into three categories: transmission magnitude, transmission speed, and a combination of both magnitude and speed of transmission (Meyer, von Cramon-Taubadel & Cramon-Taubadel, Reference Meyer, von Cramon-Taubadel and Cramon-Taubadel2004). These asymmetries can be detected in cases of market power, political intervention, non-competitive markets, asymmetry in information, adjustment costs, and price reporting (Meyer, von Cramon-Taubadel & Cramon-Taubadel, Reference Meyer, von Cramon-Taubadel and Cramon-Taubadel2004; Bailey & Brorsen Reference Bailey and Brorsen1989). To account for potential asymmetric relationships, the ECM can be modified into an Asymmetric Error Correction Model (AECM) (Granger & Lee Reference Granger and Lee1989). Nonlinear alternatives such as the Threshold Vector Error Correction Model (TVECM) (Balke & Fomby Reference Balke and Fomby1997) and Smooth Transition Vector Error Correction Model (Kripfganz & Schneider Reference Kripfganz and Schneider2023) are employed to account for non-linearities in market relationships due to factors like bans, mandates, transaction and adjustment costs, rigidities, market power, or risk. Furthermore, when price pairs are stationary or not integrated of the same order, which is rare, other models like Threshold Autoregressive Distributed Lag Model (TARDL), Asymmetric Autoregressive Distributed Lag Model (AARDL), Linear Autoregressive Distributed Lag Model (ARDL), or Vector Auto Regression (VAR) can be used to assess market integration. These models provide the capability to disentangle the long-run relationship from the short-run dynamics, much like ECM, AECM, and TVECM do.
The specific empirical framework employed by the study to assess the extent and nature of inter-regional food market integration in Ghana is shown in Figure 2. After optimally selecting the lags via the Akaike information criterion and assigning the price index for each regional market pair, the formal investigation begins by testing for stationarity. We exhaustively employed six conventionally used unit root test statistics (Dickey & Fuller Reference Dickey and Fuller1981; Dickey & Fuller Reference Dickey and Fuller1979; Elliott, Rothenberg & Stock, Reference Elliott, Rothenberg and Stock1996; Kwiatkowski et al., Reference Kwiatkowski, Phillips, Schmidt and Shin1992; Phillips & Perron Reference Phillips and Perron1988; Schmidt & Phillips Reference Schmidt and Phillips1992; Zivot & Andrews Reference Zivot and Andrews1992), with constant and/or time trend where the option is applicable, to minimize the risk of assigning the wrong order of integration to each price series. For pairs integrated of the same order, the null hypothesis of no cointegration is tested against the alternative hypothesis of one cointegrating vector (Johansen, Reference Johansen1991; Johansen, Reference Johansen1988). If no cointegration is rejected, we test for threshold cointegration and the number of implied regimes using recommended test statistics (Hansen & Seo Reference Hansen and Seo2002). If threshold effects are found, a TVECM is specified to estimate the speed of adjustment and the long run cointegrating relationship. If no threshold effects are found, an ECM or its corresponding AECM is estimated. In the case where a pair is characterized by a stationary series, we estimate the best of (a) a two or one TARDL, (b) AARDL, (c) ARDL, or (d) VAR.
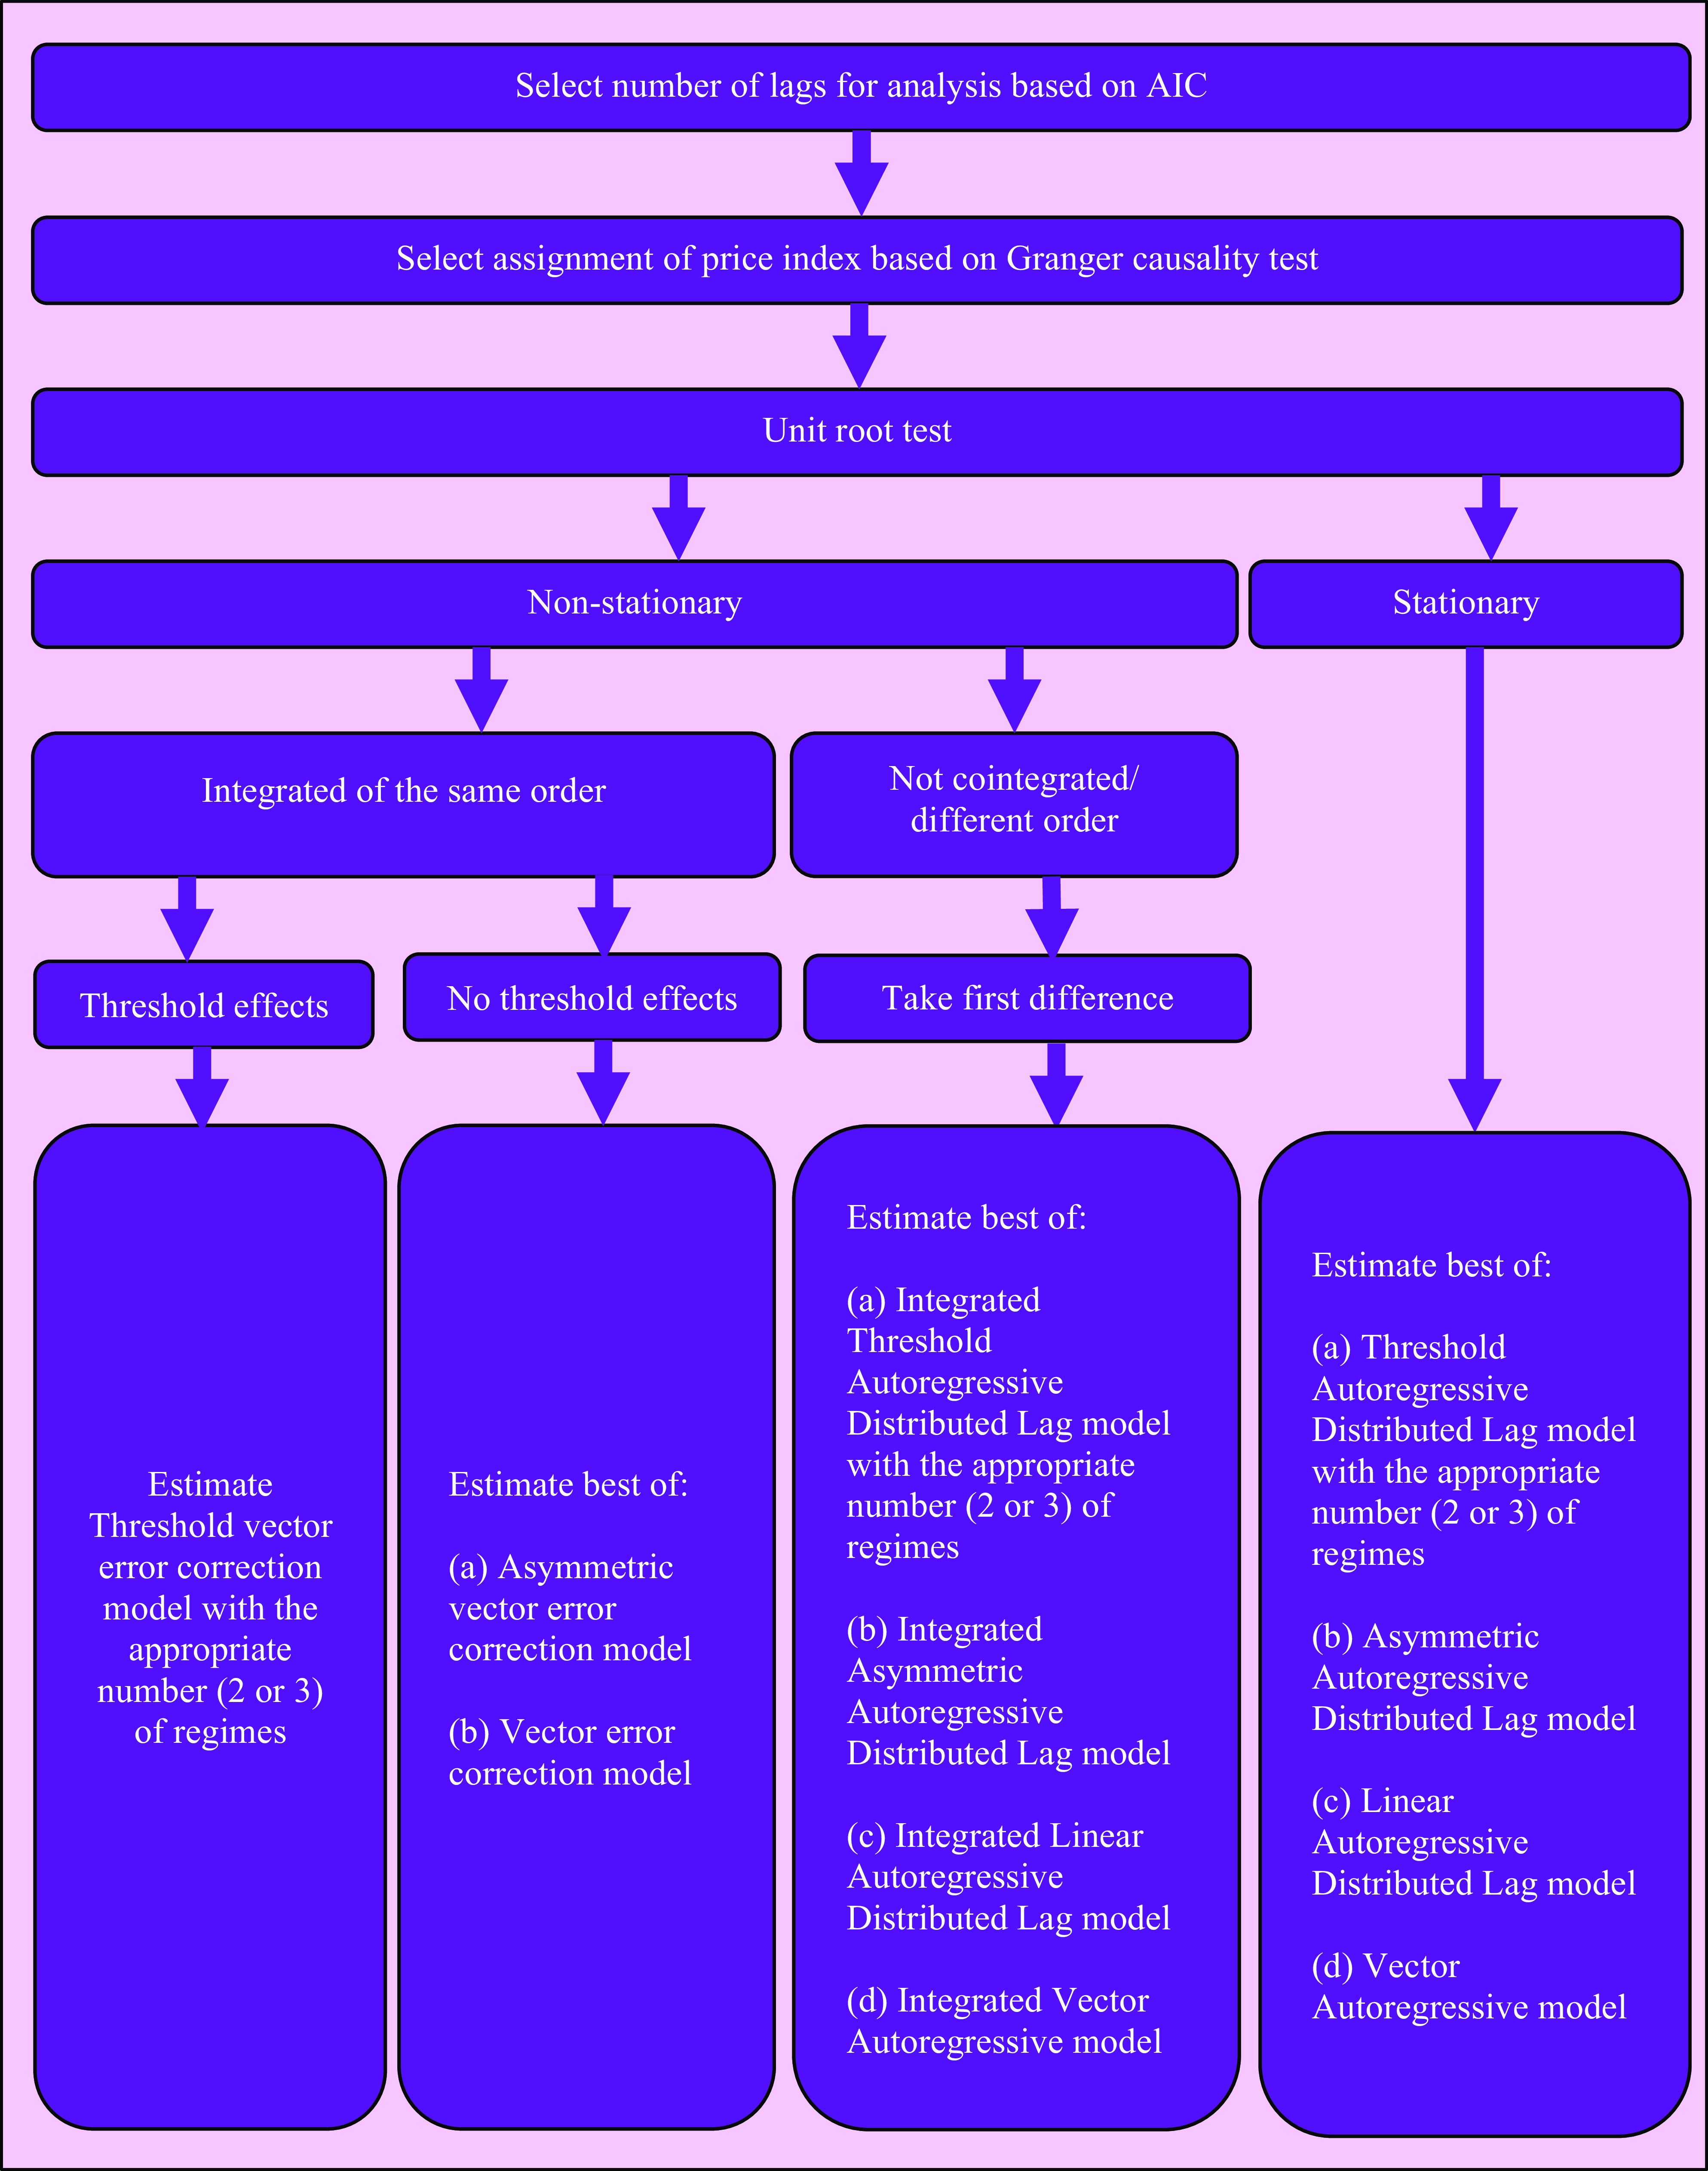
Figure 2. Empirical framework for analyzing market integration.
For the case where a pair is not integrated of the same order or non-stationary but not cointegrated, we estimate the best of an integrated TARDL, AARDL, ARDL, or VAR. For these cases, we select between threshold (TARDL and AARDL) and linear (ARDL and VAR) models using recommended test statistics (Hansen, Reference Hansen1999). For the TARDL and AARDL, we used the lags of the first differenced prices as transition variables, where for the case of the AARDL, the threshold is the first difference of value of zero. In addition to evaluating long-run Granger causality and symmetry of response, we use the parameters from the respective models to compute the average period of adjustment between the two markets within a certain range (r) of their long-run relationship after a disruption at time t using described formulas and assumptions in Note S1.
This comprehensive empirical framework offers an exhaustive and robust mechanism for analyzing market integration in Ghana, accounting for both linear and non-linear market dynamics. With these diverse statistical tests and models, the study offers insightful findings on market integration, price transmission mechanisms, and the speed and nature of market adjustments. This can in turn inform policy recommendations for the development of more efficient food markets in the country.
3.2. Effects of infrastructure on market integration
The extent and nature of inter-regional food market integration lay the groundwork for a model that estimates the impact of transportation and communication infrastructure. This model is represented as follows:
 $${\it M}_{{\it ijsk}}=\beta _{0}+{\boldsymbol \beta} _{{Rk}}{\boldsymbol R}_{{ij}}+\beta _{{Tk}}{\boldsymbol T}_{{ij}}+\beta _{{Dk}}{\rm D}_{{ij}}+\beta _{{Pk}}P_{{ijs}}+{\boldsymbol \beta} _{{Ck}}{\boldsymbol C}_{{s}}+{\boldsymbol \beta}_{{Lk}}{\boldsymbol L}_{{ij}}+\varepsilon _{{ijsk}},\qquad {\rm k}=1,2,3$$
Where M ijk denotes the k th measure of market integration (correlation coefficients, trace statistics, transportation cost, and average adjustment lengths) between food markets i and j for commodity s.Footnote 4 The vector R ij captures four variables related to road infrastructure, encompassing the shortest possible road route between two markets. These variables are: (1) Transit Time – reduced transit time usually signifies superior transportation infrastructure, thereby potentially enabling faster market integration due to more efficient arbitrage; (2) Travel Distance – particularly when gauged via the shortest possible road route, travel distance can significantly affect transportation costs, thereby influencing trade ease; (3) Paved Road Surface – paved roads typically allow for safer, more efficient goods transport compared to unpaved roads. Hence, a greater proportion of paved roads on the shortest route between markets might enhance market integration; (4) compositional variables capturing proportion route that is classified as trunk, primary, secondary, or tertiary.
The vector T ij represents telecommunication infrastructure, gauged by the average internet speed for a market pair. Given the heavy reliance of modern markets on telecommunication for transmitting crucial data like prices and quantities, faster internet speeds can reduce information asymmetry, enable quicker responses to market fluctuations, and thus foster market integration. The variable D ij signifies the straight-line or “as-the-crow-flies“ distance between markets. Although actual trade routes might deviate from this path, it offers a measure of geographical separation that can impact transportation costs and hence market integration. The variable P ijs denotes the production variability between two markets (i and j) for commodity s, which could sway the goods flow and market integration level. Markets with complementary production patterns (one market having surplus production while the other has a deficit) might achieve higher integration levels due to inherent trade and arbitrage motivations. We also include commodity ( C s ) and region ( L ij ) fixed effects
Finally, εijk represents the error term. We are not entirely certain whether it embodies the properties of a classical regression model. Consequently, we estimate standard errors using 1000 bootstrap replications of our sample.
4. Data
4.1. Data sources
The study utilizes monthly data on the price of 21 commodities from January 2010 through December 2019 spanning the formerFootnote 5 10 regions of Ghana. The sample length is limited to 2010–2019 to avoid any confounding effects of the COVID-19 pandemic (WHO, 2020) and the Russia-Ukraine war which began in February 2022 (Aljazeera). The prices are constructed from retail and wholesale prices from three sources: the Ministry of Food and Agriculture (MOFA), Ghana Statistical Service (GSS), and ESOKO.Footnote 6 For a given commodity and location, the wholesale price from MOFA was used to initialize the series since the MOFA wholesale price database had the largest number of observations. Missing data from the initialized series was extrapolated based on data from wholesale price from ESOKO, wholesale price from GSS, retail price from MOFA, retail price from ESOKO, and retail price from GSS, in that order. The extrapolation in each case for a given time (t) is taken as the previous price in the initialized series times the growth rate for time t of the respective series used for the extrapolation. Prices still missing after this step were replaced with the average of the previous and subsequent time period’s price.
In addition to the price series, we also spatially aggregated variables for transit time and duration, proportion of roads that are highways, district road density, internet speed, and proportion of roads that are highways were calculated given road network data from OpenStreetMap.Footnote 7 For internet speed, we first created a gridded heat map of average download and upload speed by geographically weighting known average download and upload speed from cell tower data from OpenCelliD.Footnote 8 , Footnote 9 We then calculated the measure of internet speed in Megabits per second (Mbps) as the average grid value of our interpolated grid within the district for 2016 and 2017.
4.2. Descriptive statistics
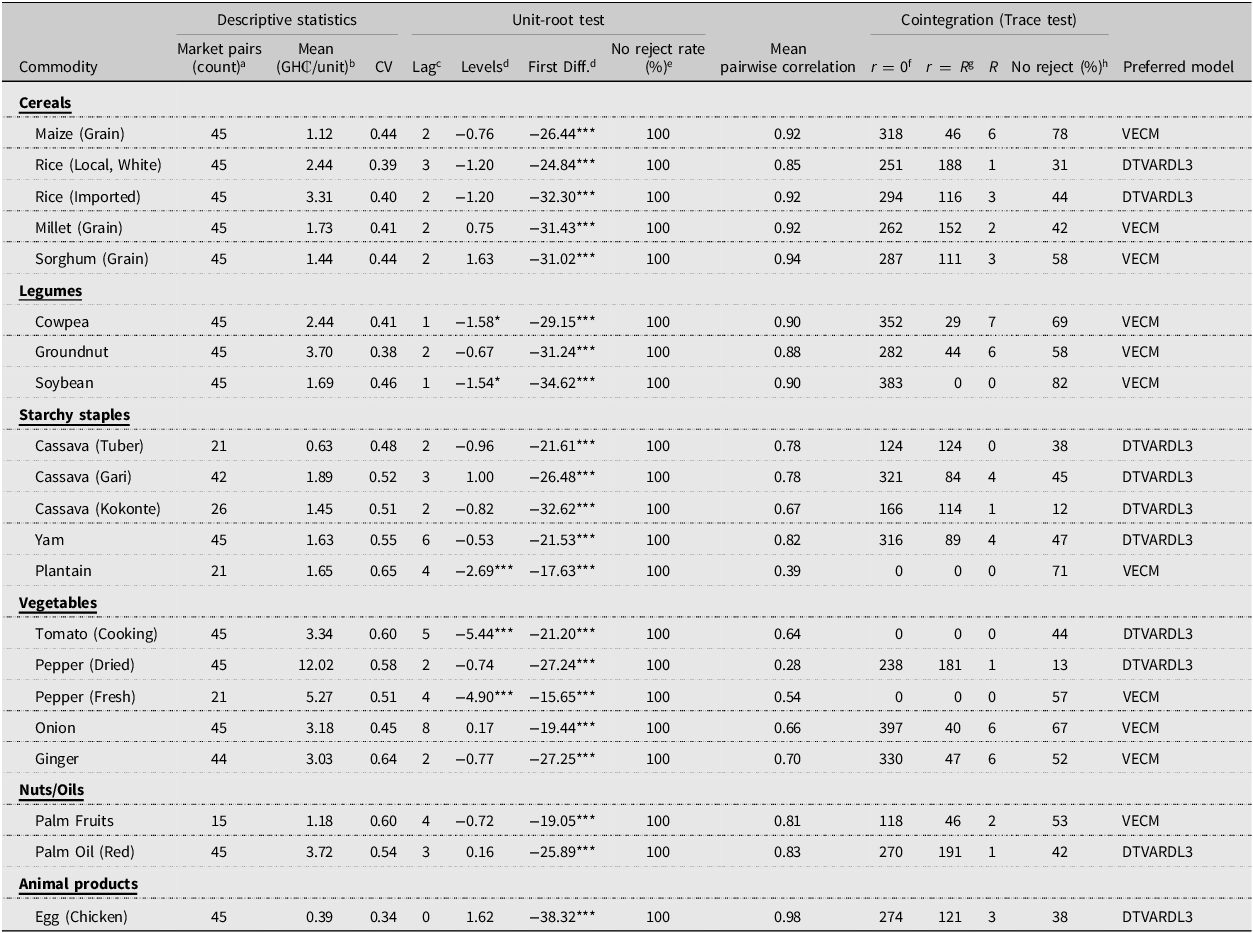
Figures S1 to S5 shows the trends of the natural logarithm of the nominal price of the commodities modeled in Ghanaian regional markets from January 2010 to December 2019. With similar patterns, the plot shows that the prices of all the commodities are upward trending over time with considerable fluctuations. Descriptive statistics and key market integration tests of the unlogged price series are presented in Table 1. On average, vegetables have a relatively higher average price as compared to the other commodity categories. Among the commodities studied, dried and fresh pepper have a higher average price of GH₵12.02 and GH₵5.27 per unit respectively.Footnote 10 , Footnote 11 Meanwhile, egg (chicken) has the lowest average price of GH₵0.39 per unit. With a coefficient of variation (cv) of 0.65, the average price of plantain has the highest variability while the average price of egg has the lowest variability with a cv of 0.34. According to the pairwise correlations, market prices for each commodity are tightly interrelated, with correlation values verging on unity, except for both fresh and dried pepper. Yet, it is crucial to note that correlation does not always denote cointegration.
Table 1. Panel descriptive, unit-root, and cointegration for regional monthly food prices in Ghana from Jan/2010 to Dec/2019
Significance levels: * p < 0.10, ** p < 0.05, *** p < 0.01.
The mean mid-rate interbank FX rate between the Ghana cedi (GH₵) and the US Dollar ($) for December 2019 was 5.54 GH₵/$ as reported by the Bank of Ghana.
aRegions include Ashanti, Brong Ahafo, Central, Eastern, Greater Accra, Northern, Upper East, Upper West, Volta, and Western.
bAll commodities units are in kg, except for Palm (red oil) and Chicken (eggs) where the units are litters and singles, respectively.
cLag length selection for unit root test is based on Akaike Information Criterion.
dNull hypothesis of panel root process via Levin-Lin-Chu test.
ePercentage of regions for which the null hypothesis of region-specific root process via Augmented Dickey-Fuller test for the respective commodity was not rejected.
fThe null hypothesis of no cointegration (r = 0) is tested via the Johansen test.
gThe null hypothesis of R cointegration vector (r = R) is tested via the Johansen test.
hIndicates the percentage of regional pairs for which cointegration was not rejected.
The Augmented Dickey-Fuller test was employed to examine if the commodity prices carry unit roots, with the results listed in Table 1. The analysis reveals that average prices possess a unit root at levels, rendering them nonstationary, with exceptions for plantain, cooking tomato, and fresh pepper at a 1% significance level and cowpea and soybean at a 10% significance level. However, at the 1% significance level, all commodity prices lack a unit root in the first differences, making them stationary. The cointegration test, specifically the Johansen test, suggests a strong long-term association between the prices of commodities like maize, millet, sorghum, cowpea, groundnut, soybean, plantain, onion, ginger, and palm fruits, where cointegration was not rejected for most regional pairs. However, for other commodities, namely local white rice, imported rice, all types of cassava, yam, cooking tomato, dried pepper, palm oil, and chicken eggs, the long-term link between their prices was less pronounced, with the null hypothesis of R cointegration vector (r = R) being accepted in some instances.
Table 2 shows the summary statistics to model the determinants of market integration. As a key influence, internet speed, on average, clocks in at 55.08 Mbps, indicating the critical role of digital connectivity in market integration. The mean travel distance between two markets stands at 415.63 km, with the average transit time via the most direct route, approximately 344 minutes. Interestingly, roughly 63 percent of these short routes are paved, a detail that further influences travel times. The composition of these routes is also noted, with trunk roads constituting 3 percent, primary roads 2 percent, secondary roads 2 percent, and tertiary roads making up 24 percent.
Table 2. Factors influencing food market integration in Ghana from Jan/2010 to Dec/2019
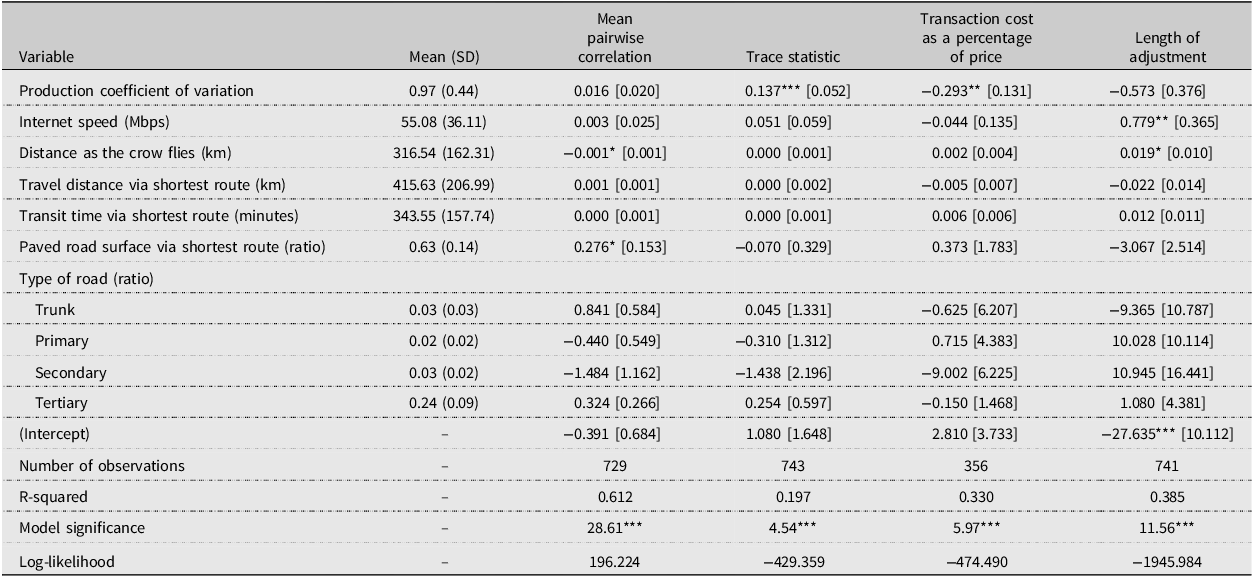
Significance levels: * p < 0.10, ** p < 0.05, *** p < 0.01.
5. Results
In relation to the framework shown in Figure 2, Figure S6 shows the prevalence of the diverse models discussed above by commodities. Based on the one with the highest occurrence, the preferred models used in the study, as illustrated in Table 1, are the Vector Error Correction Model (VECM) and the Three Regime Integrated Threshold Autoregressive Distributed Lag Model (DTVARDL3). They were chosen based on their suitability for the respective commodity categories. For instance, maize, millet, sorghum, cowpea, groundnut, soybean, plantain, onion, ginger, and palm fruits were evaluated using the VECM due to the respective series having unit roots with linear cointegration effects. In contrast, DTVARDL3 was deemed suitable for commodities like local white rice, imported rice, cassava (all forms), yam, cooking tomato, dried pepper, palm oil, and chicken eggs, since these price series did not typically show consistent cointegration effects despite having a unit root. This distribution of models allows the study to cater to the unique characteristics of each commodity. Given the results from VECM and DTVARDL3, we employed equations outlined in Appendix Note S1 to assess the extent and nature of market integration. The summary of the key parameters from the DTVARDL3 and VECM used in this assessment are shown in Tables S1 and S2, respectively.
5.1. Adjustment period length of Ghanaian food markets
Figure 3 offers valuable insights into the dynamics of market integration for various commodities, as indicated by the adjustment period length for each commodity to return to its long-run equilibrium following a deviation. The general trend we find is that deviations associated with a price increase are corrected faster than those associated with a price decline. Abdulai (Reference Abdulai2000) found similar results for the Ghanaian maize market. This indicates that traders will respond quicker to price shocks that increase their margins compared with prices that decrease margins. The exceptions to this are Cassava (Tuber), Cassava (Kokonte), and Egg (Chicken). Nonetheless, the adjustment period length varies by commodity. Focusing on the overall period of adjustment at which 50% of a deviation from equilibrium is corrected, we find that the quickest adjustment is observed for Yam, which takes only about 0.713 months, indicating a highly integrated market with rapid price adjustments to market shocks. This result is in line with (Abunyuwah, Reference Abunyuwah2020) who also studied Yam regional markets integration in Ghana. On the other hand, Millet (Grain) has the slowest adjustment speed, taking around 10.103 months for half of the deviation from the equilibrium to be restored. This could imply that the market for Millet is relatively less integrated or that information flows more slowly in this market, thereby resulting in slower price adjustments. The millet market dynamics could also be a contributing factor as produced mainly in the Upper East, Upper West and Northern Regions as a subsistence crop and also characterized by low production (MoFA, 2021; Asungre et al., Reference Asungre, Akromah, Kena and Gangashetty2021).
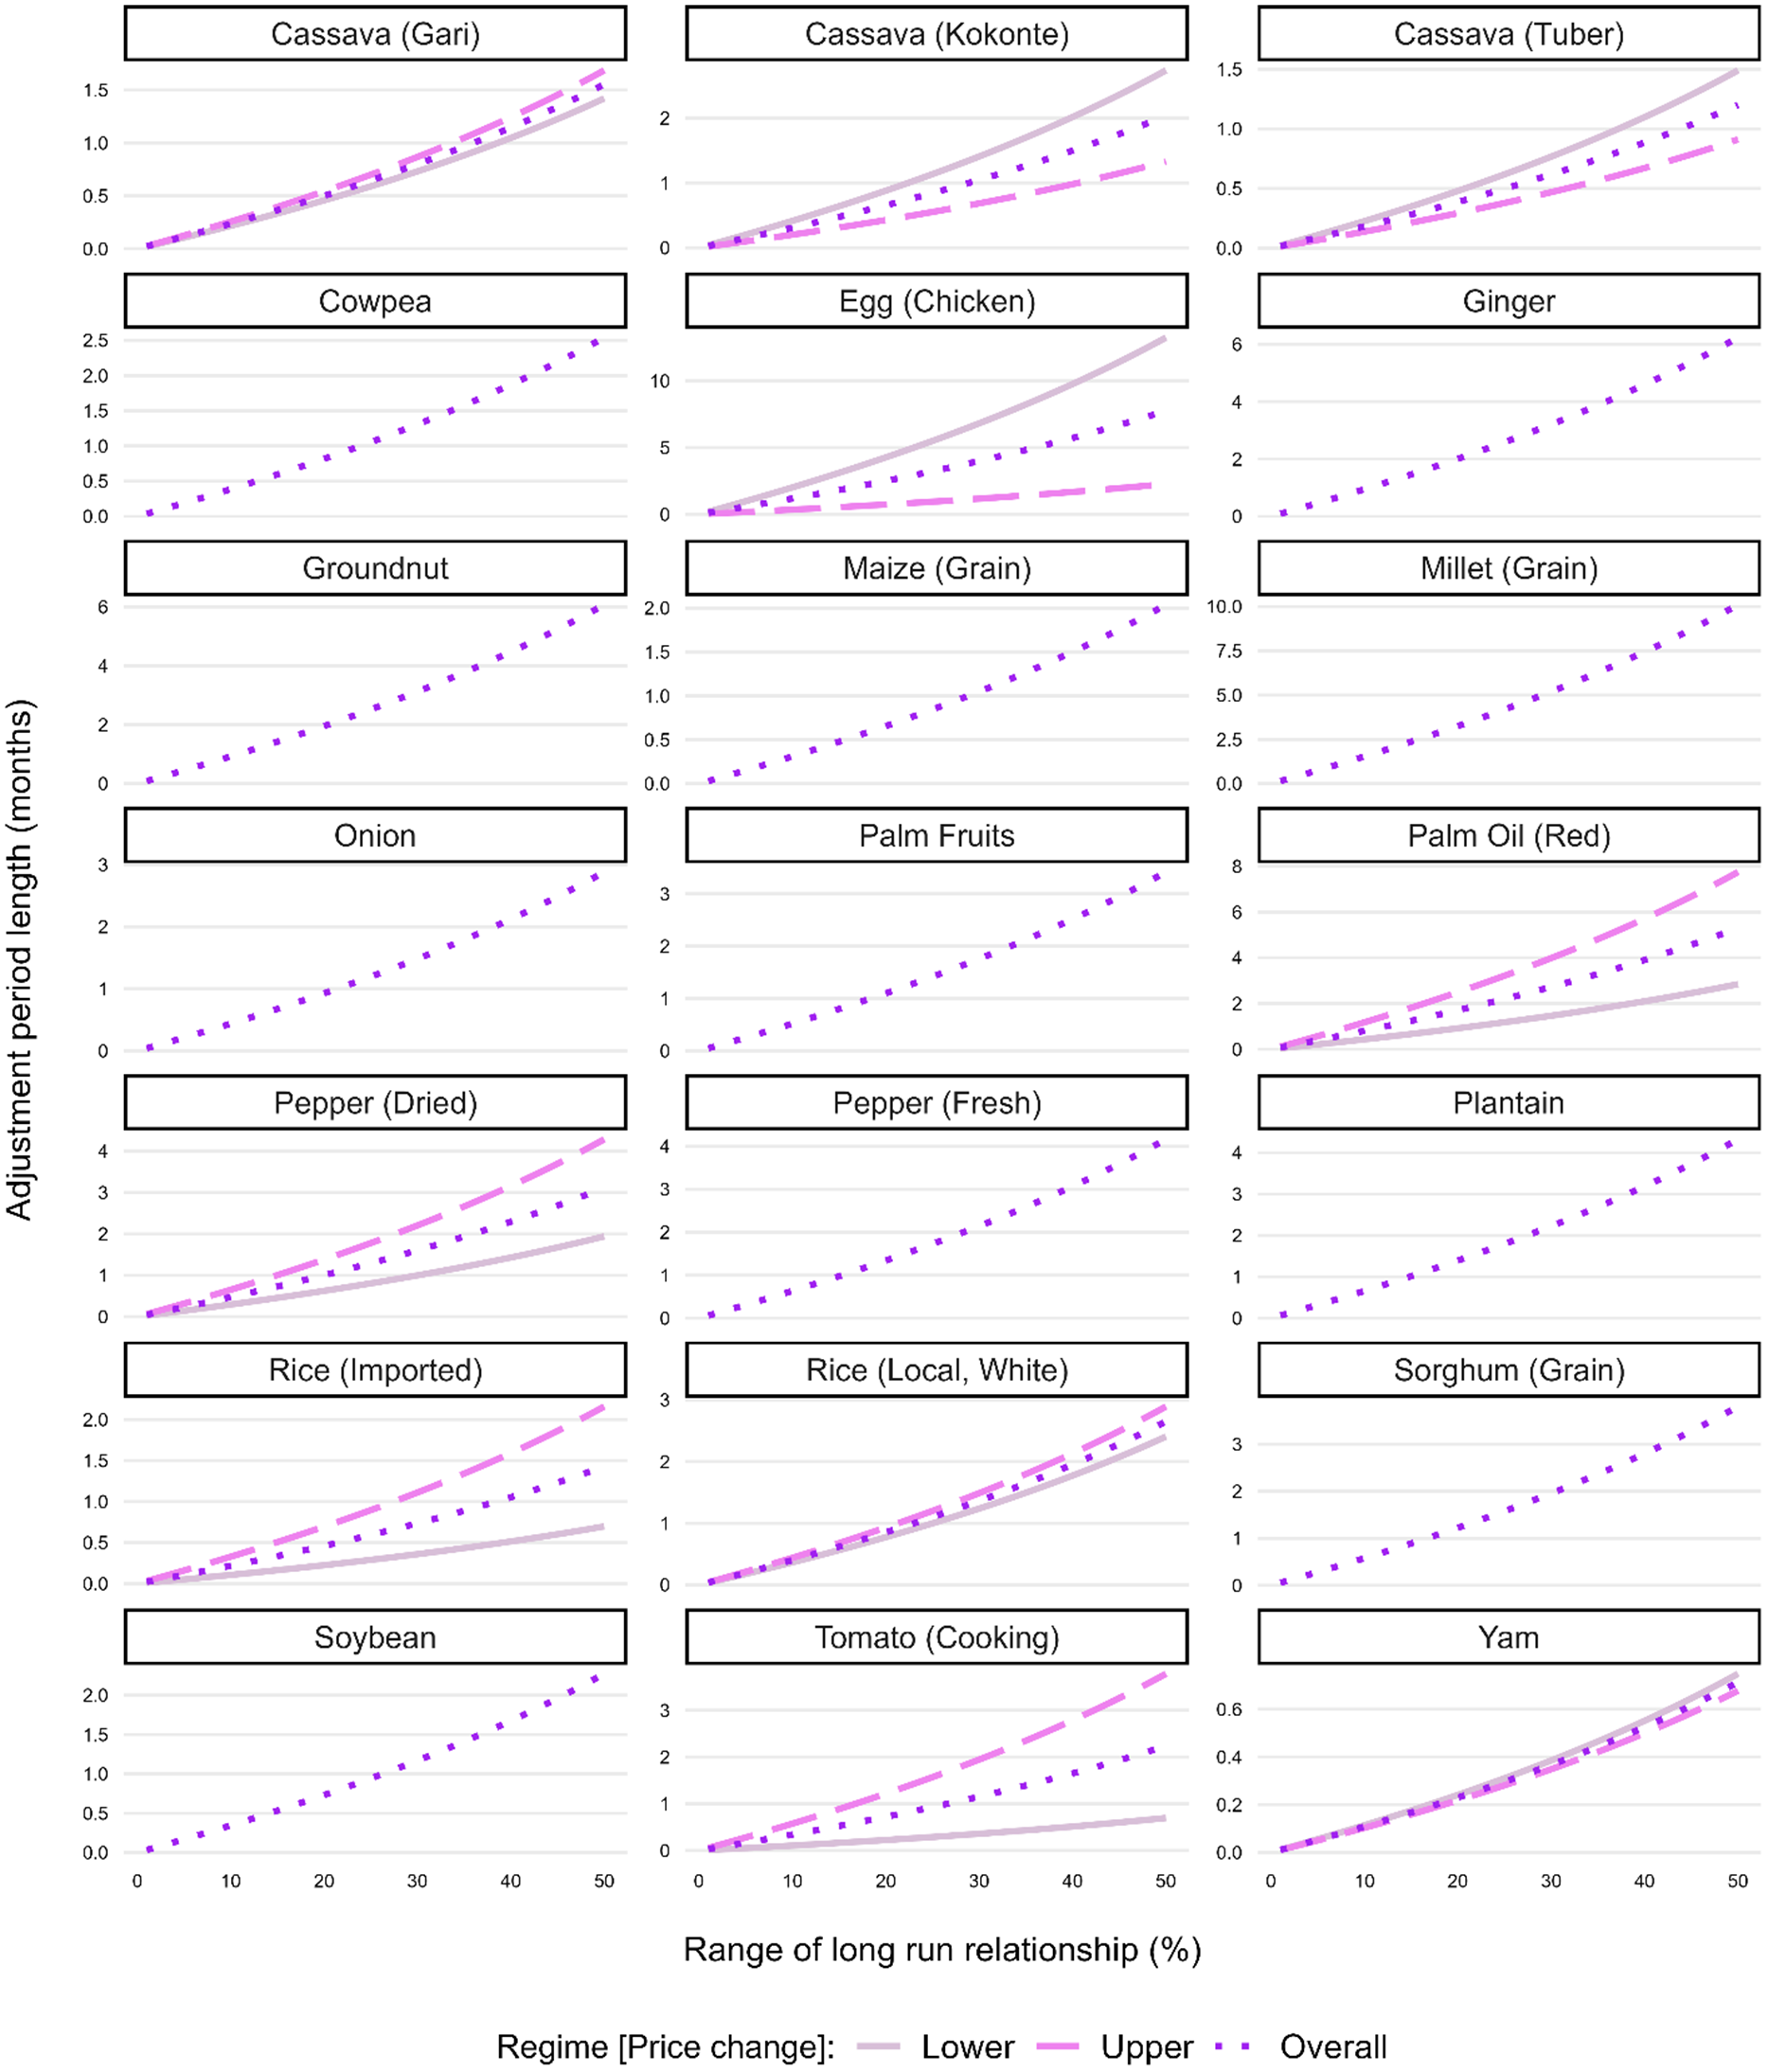
Figure 3. Commodity price adjustment period length in Ghana from Jan/2010 to Dec/2019. Notes: Values were estimated by applying a Three Regime Integrated Threshold Autoregressive Distributed Lag Models to monthly regional prices from Jan/2010 to Dec/2019.
Notably, commodities such as Egg (Chicken), Ginger, and Groundnut take considerably longer to adjust, with respective times of 7.764, 6.230, and 6.072 months. The egg markets have however shown a high degree of integration when studied for different regions in India (Vijay, Reference Vijay2020). This could suggest certain market factors or characteristics unique to these commodities, potentially including supply chain complexities, less predictable demand, or slower information dissemination. In contrast, commodities like Cassava (Tuber), Rice (Imported), and Cowpea demonstrate relatively faster adjustment speeds, highlighting more efficient markets.
Table 3 provides an intriguing analysis of market integration across different regions of Ghana regardless of the commodity traded. It quantifies the duration (in months) for 50% of a deviation from long-run equilibrium to be restored, differentiating between outbound, inbound, and the mean of both transmissions. It offers an understanding of the asymmetry in market adjustments and its implications for price dynamics in each region. Notably, some regions exhibit varying speeds of adjustment for outbound and inbound transmissions. For instance, in the Eastern region, the outbound adjustment period is faster (1.81 months) compared to the inbound (2.78 months), possibly indicating quicker responsiveness to price changes for goods leaving the region than for those coming in. The mean adjustment period of 2.16 months reflects this difference. The Northern and Central regions show longer adjustment periods, particularly for outbound transmissions, taking 4.84 and 5.66 months respectively. The delay in price adjustments suggests these regions might be less integrated, with slower information dissemination or logistical challenges impacting the speed at which these markets respond to changes. In contrast, the Upper East region displays relatively quicker market adjustments for both outbound and inbound transmissions, with a mean of 2.52 months. This suggests a more integrated market, where information flows quickly, leading to faster price adjustments. In some regions like Volta, Western, Ashanti, and Brong-Ahafo, some transmissions are reported as instantaneous (less than a month). This may indicate a highly efficient market, but it could also be a result of the specific commodities traded, local market conditions, or data limitations.
Table 3. Influential regions for food markets in Ghana from Jan/2010 to Dec/2019
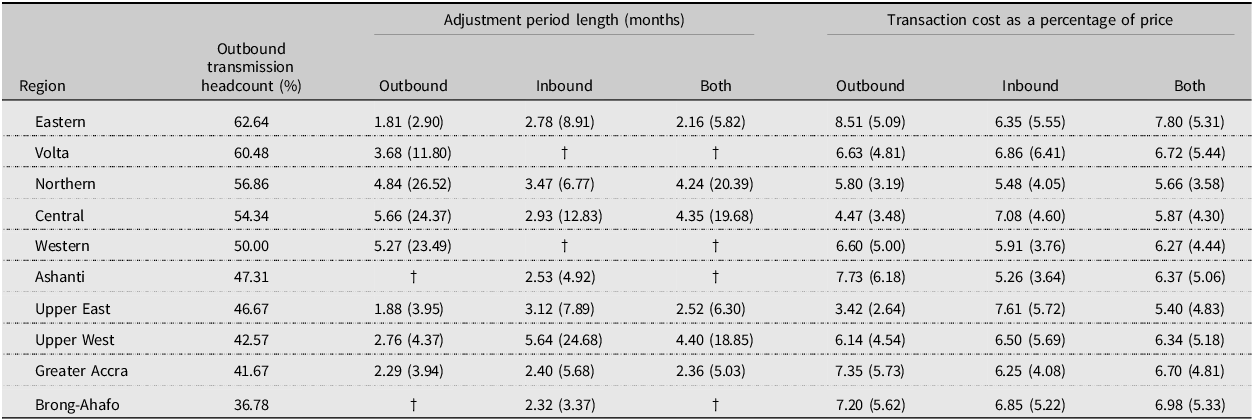
Values were estimated by applying Vector Error Correction Models and Three Regime Integrated Threshold Autoregressive Distributed Lag Models to monthly regional prices from Jan/2010 to Dec/2019. †indicates transmissions that are less than one month [i.e., instantaneous].
Based on Table 3, the region with the lowest mean transmission speed, and therefore likely the most influential region, is Greater Accra, with a mean adjustment period of 2.36 months. This suggests that Greater Accra is a highly integrated and influential region in terms of food market dynamics in Ghana. Fast adjustment periods usually indicate efficient information flow and quicker response to price deviations, which are characteristics of influential markets. On the other hand, the region with the highest mean transmission speed, suggesting it is the least influential region, is the Upper West, with a mean adjustment period of 4.40 months. Longer adjustment periods imply slower market responses to price changes, suggesting lower levels of market integration and influence.
5.2. Transaction cost in Ghanaian food markets
Figure 4 provides detailed insights into commodity-specific transaction costs in Ghana, encompassing costs associated with transportation, search, storage before sales, and presales preparations, which are crucial factors influencing the market integration and the flow of goods. The highest transaction cost is associated with “Tomato (Cooking)” at 13.483% of the underlying price, suggesting that this commodity requires substantial resources in terms of transportation, storage, and preparation before sale. Such high costs could potentially slow down-market responses to price changes and affect market integration for this product. On the other hand, “Egg (Chicken)” has the lowest transaction cost at 1.965% of the underlying price. Lower transaction costs often facilitate quicker market responses to price changes and promote better market integration (Mukim, Singh & Kanakaraj, Reference Mukim, Singh and Kanakaraj2009). This might indicate efficient distribution systems for eggs, less need for storage, or fewer preparation steps before sale. Commodities like cassava (in its various forms) and yam show relatively high transaction costs, suggesting logistical complexities or significant presales preparation. In contrast, both imported and local rice have relatively lower transaction costs. Interestingly, imported rice exhibits lower transaction costs than local white rice. This may be due to established international supply chains, although it is important to remember this does not account for potential tariffs or import taxes.
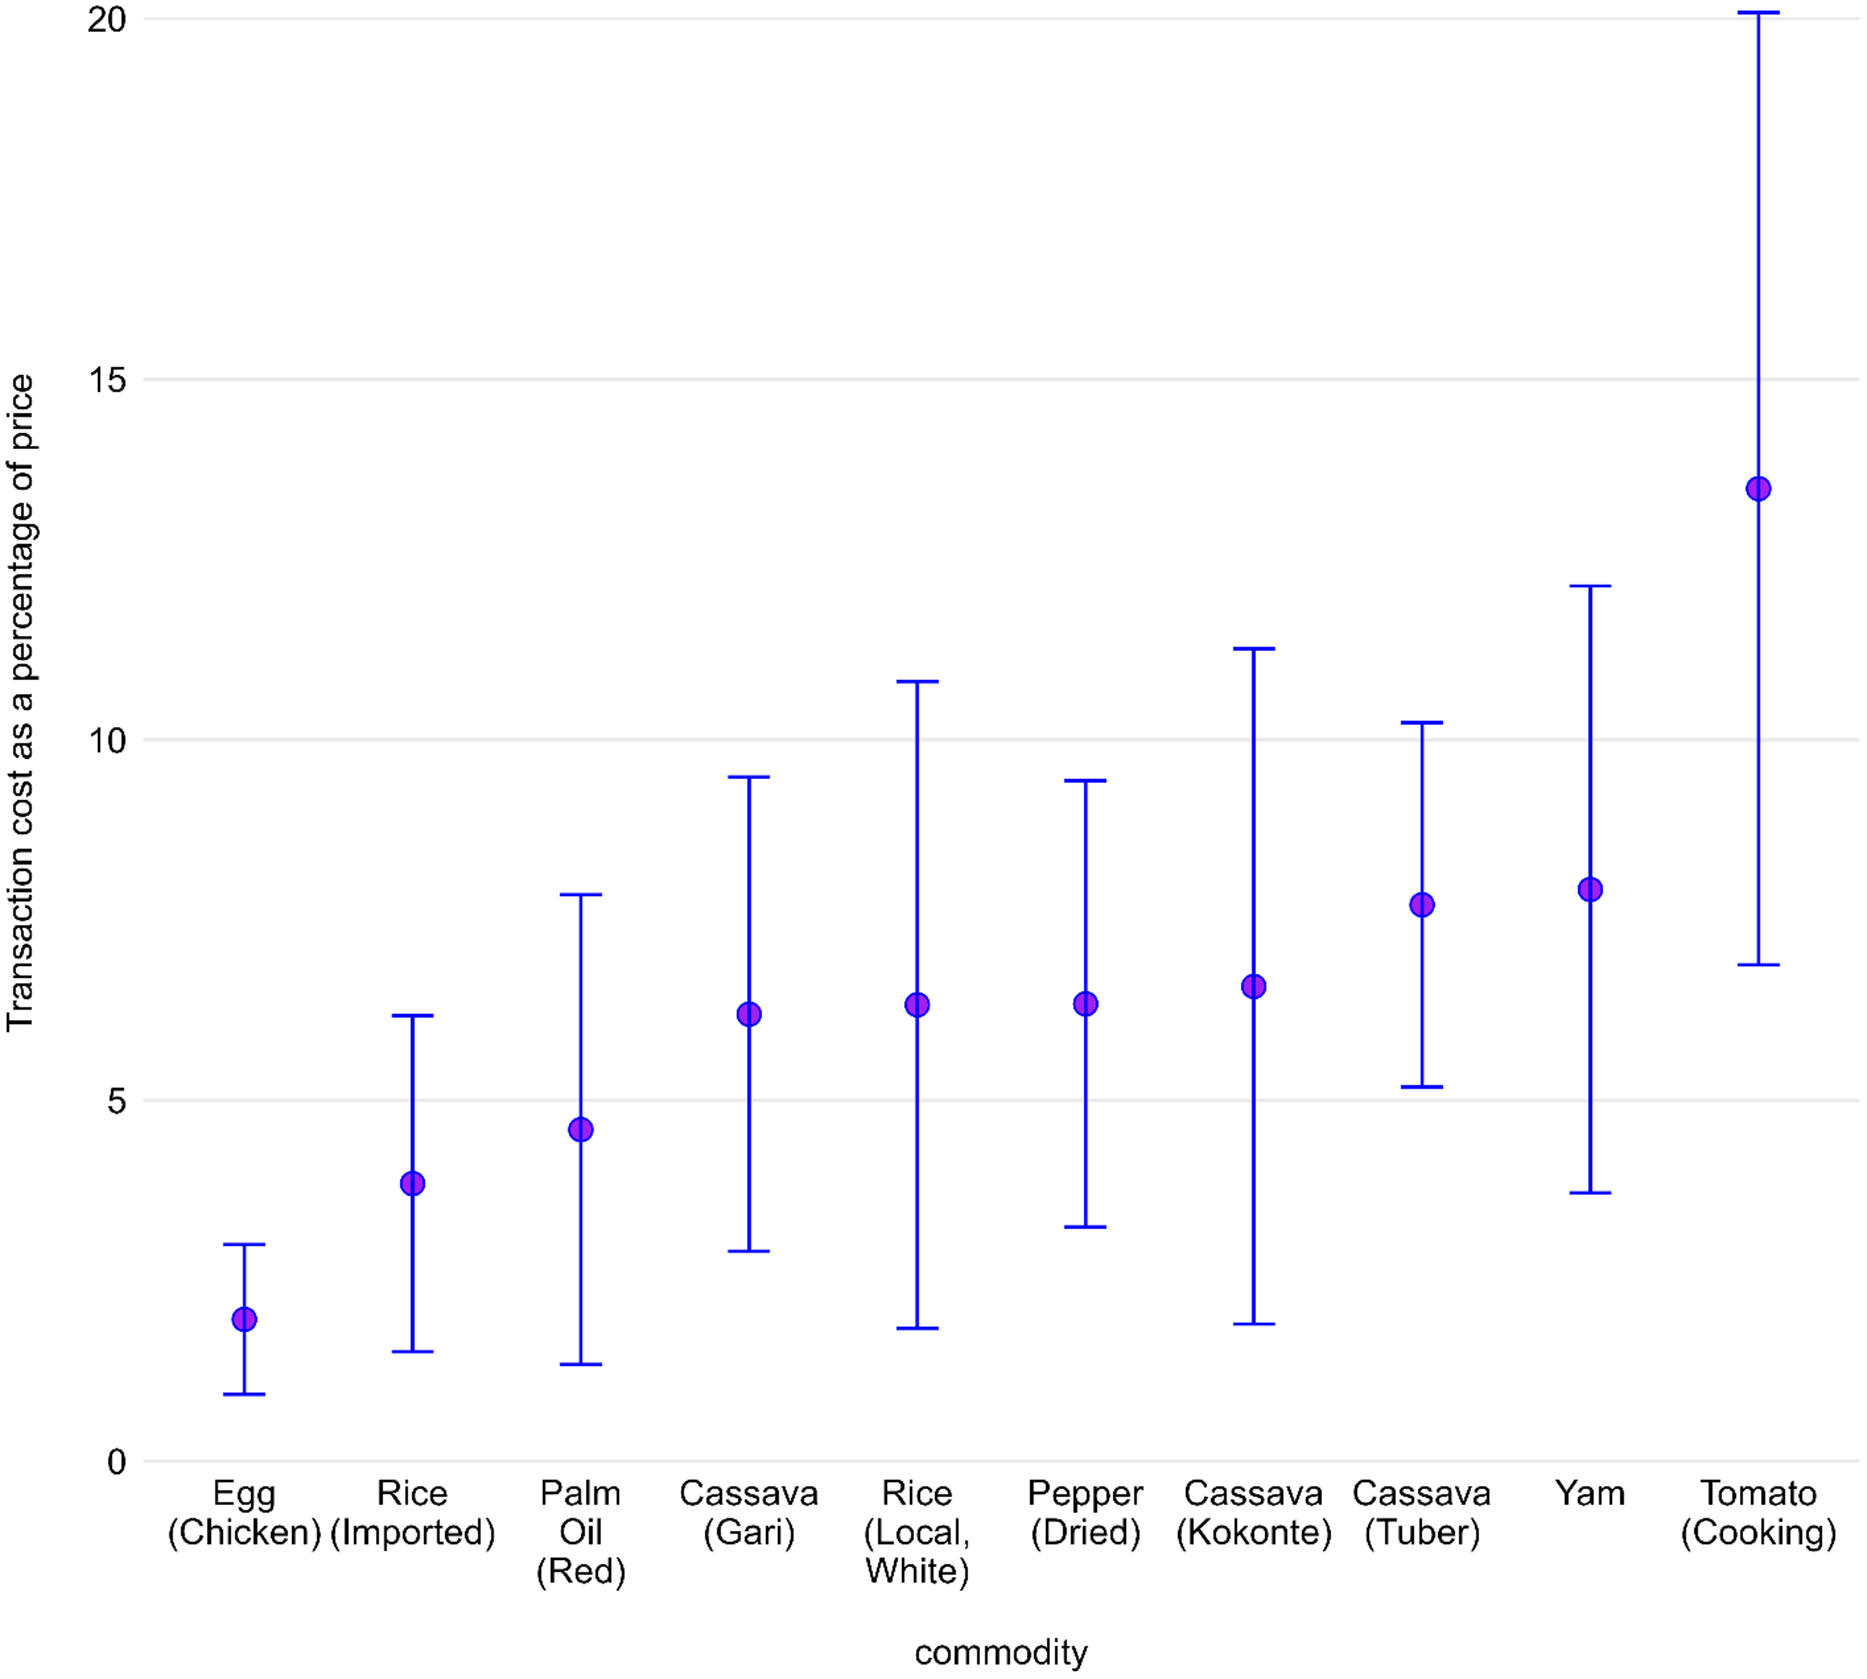
Figure 4. Commodity specific transaction cost in Ghana from Jan/2010 to Dec/2019. Notes: Values were estimated by applying a Three Regime Integrated Threshold Autoregressive Distributed Lag Models to monthly regional prices from Jan/2010 to Dec/2019.
Table 3 provides a comprehensive overview of the transaction costs as a percentage of price in different regions of Ghana for outbound, inbound, and both types, regardless of the commodity traded. The Eastern region, with an average transaction cost of 7.80% of the price, seems to have the highest cost for both inbound and outbound transactions. These relatively high costs could affect the speed and extent of market integration in this region, as they may lead to slower market responses to price changes. Conversely, the Upper East region records the lowest transaction cost for outbound goods at 3.42%, potentially indicating more efficient logistics or less need for storage and preparation before sale. However, it also has the highest transaction cost for inbound goods at 7.61%, which might be attributed to factors such as inefficiencies in transportation or higher costs related to storage or pre-sales preparation for these products. Interestingly, all regions exhibit a varying degree of transaction costs between inbound and outbound goods, suggesting a nuanced landscape of costs associated with the flow of goods. For instance, the Central region shows a significant difference between the outbound (4.47%) and inbound (7.08%) transaction costs, possibly implying different logistical challenges or cost factors at play for incoming versus outgoing goods.
From Table 3, the region with the lowest transaction cost for trading agricultural produce is the Upper East region, with an outbound transaction cost of 3.42% of the price. This indicates that it is relatively cheaper to sell goods from the Upper East region to other regions, thereby suggesting the highest opportunity cost if these trade opportunities are missed. In other words, failing to trade agricultural products from the Upper East region would result in the highest potential revenue loss given the relatively low transaction costs. Conversely, the Eastern region, with an average transaction cost of 7.80% for both inbound and outbound goods, has the highest transaction costs. This implies that it is relatively more expensive to trade goods to and from the Eastern region. Therefore, this region would have the lowest opportunity cost associated with not trading agricultural produce, as the potential revenue might not outweigh the high transaction costs involved.
5.3. Determinants of Ghanaian food market integration
Table 2 presents a multivariate analysis of various factors influencing food market integration in Ghana. These factors include the production coefficient of variation, internet speed, distance between markets, travel distance via the shortest route, transit time via the shortest route, the condition of the road surface, and type of road (trunk, primary, secondary, tertiary). The table provides insights into four aspects of market integration: pairwise correlation, trace statistic, transaction cost as a percentage of price, and the length of adjustment. We leverage the estimated associations for a given determinant across all four measures to ascertain its overall association with regional market integration in Ghana.
Our findings reveal that higher internet speed, which serves as our surrogate for telecommunication infrastructure, notably bolsters regional market integration in Ghana. This is demonstrated by its positive correlation with both pairwise correlation and the trace statistic, coupled with its negative relationship with transaction cost. Considering the significant dependency of contemporary markets on telecommunication for disseminating essential data such as prices and quantities, the provision of faster internet speeds can effectively diminish information asymmetry. This allows for more rapid responses to market variations and thus nurtures a more integrated market. By facilitating immediate access to crucial market information, enhanced internet speed empowers stakeholders to make informed decisions promptly, thus creating a more efficient and integrated market environment.
In contrast to telecommunication infrastructure, our proxies for transportation infrastructure – including factors such as travel distance via the shortest route, transit time via the shortest route, the quality of the road surface, and the type of road – demonstrate a complex relationship with regional market integration in Ghana, with both positive and negative associations evident. From Table 2, the quality of the road surface on the shortest route between markets exerts a positive influence on the pairwise correlation, suggesting that improved infrastructural facilities, like well-paved roads, can enhance market integration. This factor also shows a negative relationship with the length of adjustment, implying that better roads can aid in immediate market responses. However, the quality of the road surface seems to reduce the trace statistics and increase the transaction cost at the same time, both of which signify a negative effect on market integration, however, not significant. Furthermore, the impact of the type of road on market integration appears to be multifaceted. Increased trunk and primary roads promote market integration as seen by their positive association with pairwise correlation and the trace statistic, and negative association with transaction cost. However, while increased trunk roads increase the length of adjustment, increased primary roads reduce the length of adjustment. Lastly, increased secondary and tertiary roads show a noticeable negative impact on both the pairwise correlation and the trace statistic, and a positive impact on the length of adjustment, underscoring their negative impact on integration. In summary, these results underscore the intricate and nuanced role that transportation infrastructure plays in shaping market integration in Ghana.
In terms of the non-infrastructural covariates, we find that the production coefficient of variation significantly influences the trace statistics and the transaction cost as a percentage of price. The sign of the associated coefficients suggests that differences in production levels between the two markets can potentially impact the degree of market integration, resulting in less substantial transaction costs. Furthermore, the distance between markets (“as the crow flies”) significantly influences the length of adjustment. This implies that the geographical distance between markets can impact how quickly they adjust to changes.
6. Policy implications
Our study offers important policy insights into the intricacies of agri-food value chains in Ghana, particularly highlighting the significance of transaction costs and market integration influenced by various factors such as telecommunication and transportation infrastructure. Firstly, the positive impact of robust telecommunication infrastructure, represented by internet speed, on market integration emphasizes the importance of policies promoting digital connectivity. Recent socioeconomic events like COVID-19 have reiterated the criticality of real-time information flow in maintaining resilient agri-food value chains (Uddin, Reference Uddin2017). By investing in high-speed internet, policymakers can diminish information asymmetry, enable swift market responses, and ensure consistent food availability, which aligns with the UN Sustainable Development Goals of Zero Hunger and Industry, Innovation, and Infrastructure. On the other hand, our research uncovers a complex relationship between transportation infrastructure and market integration. While the quality of roads and the existence of primary and trunk roads enhance integration, secondary and tertiary roads show the opposite effect. Policymakers should consider these nuances when planning infrastructural developments, particularly in a bid to foster sustainable agri-food value chains. Efficient transportation reduces food waste during transit (Garcia-Herrero et al., Reference Garcia-Herrero, Hoehn, Margallo, Laso, Bala, Batlle-Bayer, Fullana, Vazquez-Rowe, Gonzalez, Durá, Sarabia, Abajas, Amo-Setien, Quiñones, Irabien and Aldaco2018), improves food safety (Orjuela Castro, Casilimas G & Herrera Ramirez, Reference Orjuela Castro, Casilimas G and Herrera Ramirez2015), and contributes to fairer wage distribution by cutting unnecessary costs, thereby directly impacting consumer nutrition, employment, and wage-related outcomes.
The varied transaction costs across different regions of Ghana also necessitate region-specific agricultural and food policies to improve the efficiency of agri-food value chains. Policies that consider the distinct challenges and advantages in each region will enhance market integration and promote fair trade practices within the agri-food value chain. Finally, understanding the effects of the production coefficient of variation and geographical distance on market integration and transaction costs underscores the need for strategic planning of production locations and marketplaces. This has significant implications for developing sustainable, resilient agri-food value chains, potentially mitigating the impact of adverse events such as the Russia-Ukraine War on the agri-food sector. By illuminating these aspects, our study offers valuable insights for policymakers aiming to reshape agri-food value chains, helping strike a balance between efficiency, sustainability, and socio-economic well-being.
The results point to two important policy implications regarding infrastructure in the agri-food sector. First, it confirms the importance of telecommunication and transportation infrastructure in the integration of spatially separated markets. The nuances of the results indicate that well-functioning markets can be achieved through the development of trunk and primary roads. However, secondary and tertiary roads may not be linked with the integration of geographically separated markets. Second, our findings also point to the importance of promoting digital connectivity for enhancing market integration. Policies geared towards enhancing telecommunication could contribute positively to the integration of markets in Ghana. Such policies will enhance broader government efforts in price stabilization.
7. Conclusion
This study investigates the role of market integration in agri-food value chains, which is essential in transmitting changes in supply and demand within or across regions. The research concentrates on Ghana, where agriculture significantly impacts the economy, livelihoods, and national GDP. It is critical to assess the agri-food value chains’ efficiency, particularly at the raw agricultural produce stage, as Ghana’s landscape is dominated by small-scale farms producing raw commodities. By focusing on 21 central agricultural commodities across ten regions in Ghana from 2010 to 2019, the study aims to spotlight methods for improving efficiency across the entire value chain. This is accomplished by identifying potential areas for growth. The research employs a dual-pronged methodological approach. First, we quantify market integration within Ghana’s inter-regional food markets using statistical methodologies, such as cointegration and autoregressive distributed lag models. Next, we evaluate the influence of transportation and telecommunication infrastructures on market integration, recognizing the critical role of efficient logistics and rapid market information dissemination.
The findings indicate that traders are quicker to correct price deviations caused by increases than declines, suggesting a prompter response to profit-increasing shocks. The study highlights differing degrees of market integration among commodities; Yam, for example, showed swift price adjustment, indicating a well-integrated market, whereas Millet took significantly longer, suggesting a less integrated market. A region-specific analysis uncovered a common asymmetry in market adjustments, with some regions showing faster adjustments for outbound transmissions than inbound. Notably, the Greater Accra region demonstrated the fastest average adjustment time, indicating a high level of market integration and influence on the country’s food market dynamics.
The research also probes into transaction costs, such as transportation, search, storage, and pre-sales preparation costs. We found that certain commodities, like “Tomato (Cooking),” incurred the highest transaction costs, potentially impacting market integration and price change responsiveness. Conversely, commodities like “Egg (Chicken)” exhibited the lowest transaction costs, suggesting efficient distribution systems and potentially superior market integration. These transaction cost profiles varied across regions, with the Eastern region displaying the highest average costs for both inbound and outbound transactions, while the Upper East region displayed the lowest costs for outbound goods.
A key revelation was the instrumental role of robust digital infrastructure in fostering market integration, underscoring the need for policies enhancing digital connectivity, particularly in response to disruptive socioeconomic events. Such measures would not only encourage efficient information flow but also contribute to the resilience and sustainability of agri-food value chains, aligning with the UN Sustainable Development Goals of Zero Hunger and Industry, Innovation, and Infrastructure. Interestingly, the study also uncovered the complexities in the relationship between transportation infrastructure and market integration. While primary and trunk roads seem to support market integration, secondary and tertiary roads demonstrated the opposite effect, calling for a more nuanced policy approach towards infrastructure developments.
Our study, however, has certain limitations, primarily related to data availability and quality. As the analysis relied on publicly available data to construct regional-level price series, discrepancies in data quality across sources may have impacted the results. The short length of our 9-year analysis window is relatively limited in forecasting a long-term market integration story. Also, the variable accuracy and completeness of the telecommunication data retrieved from OpenCelliD can limit the study’s reliability, as it potentially introduces errors and biases, especially for less developed areas with sparse data coverage. In a similar vein, the transportation infrastructure variables, derived from OpenStreetMap, are subject to certain limitations due to their user-generated nature and geographical biases. Our final limitation lies in the study’s inability to establish clear causal relationships due to the nature of the data.
Despite these constraints, the study provides invaluable insights for policymakers, aiding in refining Ghana’s agri-food value chains and balancing efficiency, sustainability, and socio-economic prosperity. Future research should strive to extend these findings by exploring potential causal relationships and providing a more nuanced understanding of the trade-offs between various policy decisions within this intricate system.
Acknowledgements
The authors are grateful for the price data sourced from Ghana’s Ministry of Food and Agriculture, GSS, and ESOKO.
Financial support
Authors have no funding source to declare
Data availability statement
Data will be available on request
Competing interests
Authors declare no competing interests.


 Open access