


1. Introduction
Tall fescue (Schedonorus arundinaceus (Schreb.) Dumort.) is a hardy, temperate, perennial grass that grows mainly through the spring (late February or early March to May) with additional growth occurring in fall (September to November) (Roberts et al., Reference Roberts, Lacefield, Ball, Bates, Fribourg, Hannaway and West2009). Having two growing seasons and ability to grow under adverse weather conditions makes it a desirable forage species for cattle and hay production (Moser and Hoveland, Reference Moser, Hoveland, Moser, Buxton and Casler1996). Tall fescue is the primary pasture and hay forage on more than 35 million acres, commonly referred to as the Fescue Belt,Footnote 1 which supports 40% of cow-calf operations in the United States (U.S. Department of Agriculture, National Agricultural Statistics Service 2018).
Despite its wide adaption, challenges presented by tall fescue are that it is dormant during the winter, and during the summer it can cause fescue toxicosis in cattle, lowering conception rates and weight gains (Looper et al., Reference Looper, Reiter, Williamson, Sales, Hallford and Rosenkrans2010). This creates challenges in managing grazing during the summer and winter for Fescue Belt cow-calf producers. Producer reliance on spring- and fall-calving seasons exacerbates this challenge (Caldwell et al., Reference Caldwell, Coffey, Jennings, Philipp, Young, Tucker and Hubbell2013; Campbell et al., Reference Campbell, Backus, Dixon, Carlisle and Waller2013). Spring calving typically begins in January and ends in mid-March, with cows nursing a calf and being rebred in late spring–early summer. Fall calving starts around mid-September and ends in mid-November, with cows nursing a calf and being rebred during the winter. Thus, the times when cows require their highest nutritional intake to produce milk for young calves and maintain body condition for rebreeding coincide with the times when tall fescue forage growth diminishes (Caldwell et al., Reference Caldwell, Coffey, Jennings, Philipp, Young, Tucker and Hubbell2013; Campbell et al., Reference Campbell, Backus, Dixon, Carlisle and Waller2013).
Strategies producers could use to contend with diminished seasonal tall fescue growth include providing cattle with supplemental feed and reducing stocking rates (Kallenbach, Reference Kallenbach2015). A common supplemental feeding practice is to transport forage, such as harvested hay, to cattle in pastures. Short (Reference Short2001) reported that livestock operations in the Fescue Belt fed more harvested forage than operations in other regions. Estimates of annual supplemental feed costs in the Fescue Belt during winter can account for more than half of the annual cow-calf production costs (Gillespie et al., Reference Gillespie, Kim and Paudel2007; Henry et al., Reference Henry, Boyer, Griffith, Larson, Smith and Lewis2016; Short, Reference Short2001).
Producers could also diversify planted forages to extend grazing days into the winter and summer months. The Fescue Belt’s growing conditions are favorable to producing a diverse forage species mix of cool- and warm-season grasses (Kallenbach, Reference Kallenbach2015; Mullenix and Rouquette, Reference Mullenix and Rouquette2018). In this region, producers can plant cool-season annuals such as winter wheat (Triticum aestivum L.) in September or early October with growth of these varieties extending from November to May (Hoveland et al., Reference Hoveland, Hardin, Worley and Worley1991). Total gains and average daily gain for cattle grazing annual cool-season forages in the winter have been found to exceed average daily gains of cattle grazed on tall fescue over the same time period (Hoveland et al., Reference Hoveland, Hardin, Worley and Worley1991; Lomas, Moyer, and Kilgore, Reference Lomas, Moyer and Kilgore1999). Warm-season grasses, on the other hand, grow from late May through midsummer with fall dormancy starting in early October (Moore et al., Reference Moore, White, Hintz, Patrick and Brummer2004). Several species are suitable for this region, including native perennials such as switchgrass (Panicum virgatum L.), big bluestem (Andropogon gerardi Vitman), indian grass (Sorghastrum nutans L.), and eastern gama grass (Tripsacum dactyloides); nonnative perennials like Bermuda grass (Cynodon dactylon (L.) Pers.); and annual grasses such as crabgrass (Digitaria sanguinalis (L.) Scop.). Research shows that steers grazing warm-season grasses have positive gains and net returns (Backus et al., Reference Backus, Waller, Bates, Harper, Saxton, McIntosh, Birckhead and Keyser2017; Burns and Fisher, Reference Burns and Fisher2013; Lowe et al., 2015; Reference Lowe, Boyer, Griffith, Waller, Bates, Keyser, Larson and Holcomb2016; McFarlane, Boyer, and Mulliniks, Reference McFarlane, Boyer and Mulliniks2018).
Incorporating other cool- and warm-season forages and grazing management practices into a tall fescue, cow-calf grazing system can also improve pasture conditions by reducing overgrazing and extending grazing days (Byrnes et al., Reference Byrnes, Eastburn, Tate and Roche2018; Muir et al., Reference Muir, Pitman and Foster2011; Stanley et al., Reference Stanley, Rowntree, Beed, DeLonge and Hamm2018). The diversification of forage for grazing systems allows producers to rest tall fescue pasture while grazing other forages. Reducing overgrazing can reduce runoff and erosion leading to improvements in water quality and soil health (Byrnes et al., Reference Byrnes, Eastburn, Tate and Roche2018; Muir et al., Reference Muir, Pitman and Foster2011). Rest periods also provide producers an opportunity to stockpile tall fescue forage growth during the fall for winter grazing, effectively extending grazing days and reducing fed hay costs (Ward et al., Reference Ward, Vestal, Doye and Lalman2008).
Despite these advantages, there are several additional costs associated with cool- and warm-season grazing systems. These systems may require producers to adopt rotational stocking, which includes additional costs such as fencing, water points, labor, managerial, chemical, and forage expenses (Gillespie et al., Reference Gillespie, Kim and Paudel2007; Gillespie, Kim, and Paudel, Reference Gillespie, Kim and Paudel2007; Johnson et al., Reference Johnson, Doye, Lalman, Peel, Raper and Chung2010; Pruitt et al., Reference Pruitt, Gillespie, Nehring and Qushim2012). For cool- and warm-season grazing systems to be profitable, the reduction in hay costs must be greater than the costs of using these forages and practices. To our knowledge, no study has investigated how using cool- and warm-season grazing systems affects the number of days producers feed hay to cattle in the Fescue Belt conditional on the pasture management practices producers use and how these amounts varied across seasons. Ward et al. (Reference Ward, Vestal, Doye and Lalman2008) investigated the factors affecting the likelihood of Oklahoma cattle producers feeding hay more than 60 days in a year. They found, among other factors, that herd size and producer education level were positively correlated with hay season length extending past 60 days but did not consider the impact of production practices on hay season length.
The objective of this research was to determine how forage mixtures, pasture management, and grazing management practices influence the number of days hay was fed to cattle by season. Investigating the relationship between the amount of hay required for supplemental cattle feeding and producer forage and pasture management practices will increase understanding of the benefits and costs associated with these practices in the Fescue Belt. It could also help cattle producers in this region identify the likely effects of forage and pasture management practices on their operation’s cost of production or profitability. Although the applicability of what are essentially statewide average effects for a single production year cannot be expected to uniformly hold across individual operations, this information can provide a valuable starting point.
2. Data
Data were collected from a survey of Tennessee beef cattle producers in 2018. A list frame of 7,513 beef cattle producers who had participated in the Tennessee Agricultural Enhancement Program (TEAP) was obtained from the Tennessee Department of Agriculture. TEAP is a state-sponsored program that provides producers a partial-cost reimbursement for implementing improved management practices. After removing duplicate records and incorrect contact information, 5,831 producers were identified and included in the survey list frame. The survey was administered using the online survey service provided by Qualtrics. The survey followed Dillman, Smyth, and Melani’s (Reference Dillman, Smyth and Melani2007) survey total design method. Individuals identified with an e-mail address received the survey on March 2, 2018. A reminder e-mail was sent 2 weeks following initial delivery. Individuals without an e-mail address received a postcard inviting them to participate in the survey via a web link included on the postcard. People not responding to the survey were contacted once by trained enumerators via telephone. The response rate was 23.8% with 1,405 responses from the online survey and 367 responses from the phone survey.
The survey instrument was divided into five sections. The first section included questions on livestock numbers, farm size, grazing management, and the use of cool-season annuals and warm-season grasses. Producers who grazed cattle on pastures planted in warm-season grasses completed the second sections, which contained questions on the species used, the perceived effects of warm-season grasses on their beef cattle operation, and their concerns about planting and managing warm-season grasses. Producers who did not graze cattle on warm-season grass pastures completed the third section, which contained questions asking participants about their willingness to establish warm-season pastures. The fourth section included questions on supplemental cattle feeding practices, the impacts of drought on their operation, and the use of hay and corn silage. In this section, respondents were asked to indicate the number of days they fed hay to cattle during each of the four seasons—that is, January through March (WINTER), April through June (SPRING), July through September (SUMMER), and October through December (FALL). The number of days on feed for each season was provided in response to an open question and recorded as a discrete count ranging from 0 to 90 days for WINTER, 0 to 91 days for SPRING, and 0 to 92 days for SUMMER and FALL. The final section focused on producer demographics. Descriptions of dependent and independent variables used in this analysis are provided in Table 1.
Table 1. Variable names and definitions of the dependent and independent variables

3. Economic implications
The effects of forage varieties and pasture management practices on days feeding hay are likely to vary across seasons. For example, using a cool-season annual may reduce the number of days cattle are fed hay during the winter, but it might not affect the number of days cattle are fed hay during the summer. To determine the economically optimal forage mix and pasture management practices to use, a producer would need to compare the cost combination of forages and practices to the reduction of days feeding hay during a certain season or month.
Producers could estimate the production and opportunity costs of converting tall fescue pasture to another forage, including the costs of fence material and labor costs, using enterprise budgets. However, determining potential changes in the producers’ annual cost of fed hay is more complicated because of seasonal variation in prices attributable to regional differences in supply and demand and the nutritional quality of hay (Blank, Orloff, Putnam, Reference Blank, Orloff and Putnam2001; Hopper, Peterson, and Burton, Reference Hopper, Peterson and Burton2004; McCullock, Davidson, Robb, Reference McCullock, Davidson and Robb2014). The USDA Agricultural Marketing Service (2018) collects daily hay price data from sales across the United States. There is no Tennessee market where data are collected, but monthly hay price data from 2008 to 2018 from a nearby market (Harrisonburg, Virginia) are shown in Figure 1. Hay prices increase in January and peak in April. Regional hay demand peaks during the winter months, and supply or inventories are depleted by April, which likely explains this pattern. Therefore, the economically optimal decision may not be the forages and practices that reduce the total number of days feeding hay, but rather the forages and practices that reduce the number of days feeding hay during an expensive hay feeding season such as the winter.
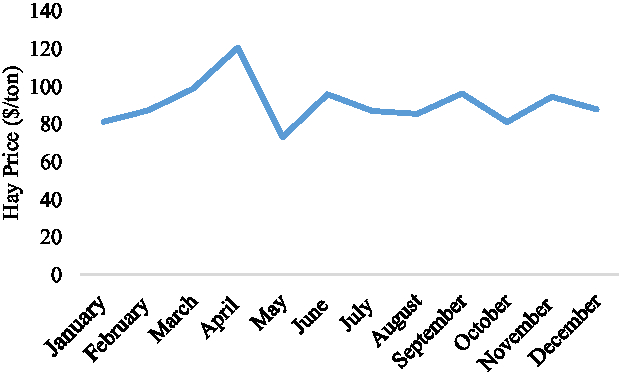
Figure 1. Average hay monthly prices for good quality hay sold in Harrisonburg, Virginia, from 2008 to 2018.
4. Empirical model and estimation
Several models were estimated to determine the association between the number of days respondents fed hay during each season and the forage mixtures and management practices used by respondents. Because responses were count data bound from 0 to 92, models were estimated for each season using count regression methods (Greene, Reference Greene2011). The Poisson distribution is commonly used to estimate models where the dependent variable is a positive integer. This model is estimated as
 $$f(Hay_i^s|{{\bf{X}}_i}) = {{\exp \left( { - {\mu _i}} \right)\mu _i^{Hay_i^s}} \over {Hay_i^s!}},$$
where $Hay_i^s$
is the number of days cattle were on hay for producer i in season s (s = WINTER, SPRING, SUMMER, or FALL); X
i
is a vector of farm and farmer characteristics, including forage mixes and pasture management practices; and μi
is the mean equation, which is
$Hay_i^s$
is the number of days cattle were on hay for producer i in season s (s = WINTER, SPRING, SUMMER, or FALL); X
i
is a vector of farm and farmer characteristics, including forage mixes and pasture management practices; and μi
is the mean equation, which is $\ln {\mu _i} = {\bf{X}}_i^\prime {{{{\bf}{\beta} }}^S}$
where the β
S is a vector of parameters to be estimated. Modeling count data with the Poisson model is somewhat restricted because the mean and variance are assumed to be equal (Greene, Reference Greene2011). However, this assumption is violated in many empirical applications (Bekkerman, Goodwin, and Piggott, Reference Bekkerman, Goodwin and Piggott2008; Cameron and Trivedi, Reference Cameron and Trivedi2005; Durham, Pardoe, and Vega-H, Reference Durham, Pardoe and Vega-H2005; Uematsu and Mishra, Reference Uematsu and Mishra2011). The negative binomial distribution has the attractive feature of allowing the mean and variance functions of the response variables to be independent. The variance function of the negative binomial introduces a dispersion parameter, relaxing the strong mean-variance equality assumption maintained by the Poisson (Greene, Reference Greene2011). The negative binomial function is
$\ln {\mu _i} = {\bf{X}}_i^\prime {{{{\bf}{\beta} }}^S}$
where the β
S is a vector of parameters to be estimated. Modeling count data with the Poisson model is somewhat restricted because the mean and variance are assumed to be equal (Greene, Reference Greene2011). However, this assumption is violated in many empirical applications (Bekkerman, Goodwin, and Piggott, Reference Bekkerman, Goodwin and Piggott2008; Cameron and Trivedi, Reference Cameron and Trivedi2005; Durham, Pardoe, and Vega-H, Reference Durham, Pardoe and Vega-H2005; Uematsu and Mishra, Reference Uematsu and Mishra2011). The negative binomial distribution has the attractive feature of allowing the mean and variance functions of the response variables to be independent. The variance function of the negative binomial introduces a dispersion parameter, relaxing the strong mean-variance equality assumption maintained by the Poisson (Greene, Reference Greene2011). The negative binomial function is $f(Hay_i^s|{{\bf{X}}_i},{\tau _i}) = {\displaystyle{{{\exp \left( { - {\mu _i}{\tau _i}} \right){{({\mu _i}{\tau _i})}^{Hay_i^s}}} \over {Hay_i^s!}}}},$
where In ${\mu _i}{\tau _i} = {\bf{X}}_i^\prime {{\bf{\beta}}^S} + \varepsilon _i^s$
, and
${\mu _i}{\tau _i} = {\bf{X}}_i^\prime {{\bf{\beta}}^S} + \varepsilon _i^s$
, and $\varepsilon _i^s$
is the unobserved heterogeneity term.
$\varepsilon _i^s$
is the unobserved heterogeneity term.
The models are estimated using maximum likelihood assuming the number of days fed on hay (a count variable) is distributed as a Poisson and negative binomial. The likelihood ratio test was used to determine whether the variance differed from the mean. The null hypothesis is that the negative binomial dispersion parameter is not different from zero. Rejection of the null hypothesis indicates the negative binomial distribution is preferred over the Poisson distribution.
When the number of zero counts dominates the distribution of the outcome variable, Poisson or negative binomial specifications could underpredict the zero counts (Greene, Reference Greene2011). In this case, zero-inflated specifications of the Poisson or negative binomial models are preferred (Greene, Reference Greene2011). The zero counts are estimated as a (0,1) binary variable with the logistic function. The nonzero counts are estimated using the Poisson if the mean and variance function are identical or the negative binomial of the data are overdispersed. The Poisson (or negative binomial) probability mass functions (pmf’s) and the logistic cumulative density functions enter multiplicatively into a single log likelihood function. The parameters explaining the series’ zero pattern (through the logistic function) and the counts (through the Poisson or negative binomial pmf’s) are jointly estimated by maximizing a log likelihood function. See Greene (Reference Greene2011) and Cameron and Trivedi (Reference Cameron and Trivedi1998) for details.
In this application, the producers not feeding cattle with hay during a given season entered the data as zeros. Some producers may have reported zero days on hay because of limited access to hay or other constraints. Other producers may have reported zero days on hay for economic or managerial reasons. The logit equation models this response pattern. The nonzero count portion of the model (Poisson or negative binomial, depending on the likelihood ratio test) determines which factors affect the number of days that producers fed cattle hay. Depending on the outcome of the likelihood ratio test, we then compared a zero-inflated count model to its counterpart. We used Vuong’s test (Greene, Reference Greene2011) to discern which specification—zero inflated (or not), Poisson (or negative binomial)—was appropriate for each of the seasonal days-on-hay models.
Estimated parameters for these models are typically presented as incidence rate ratios (IRRs) (Bekkerman, Goodwin, and Piggott, Reference Bekkerman, Goodwin and Piggott2008; Durham, Pardoe, and Vega-H, Reference Durham, Pardoe and Vega-H2005; Uematsu and Mishra, Reference Uematsu and Mishra2011). Interpreting the count coefficients as IRRs facilitates interpretation of the independent variables’ relationships with the counts in common units. We also report the count model results as IRRs following Greene (Reference Greene2011). These IRRs indicate the percentage change in the number of days feeding hay from a unit change in a continuous variable, holding other variables constant. IRRs for binary variables are interpreted relative to the zero value, given that all other variables are held constant. This percentage change is calculated by subtracting 1 from the IRR and multiplying the result by 100. For example, a stocking rate parameter of 1.18 would be interpreted to mean that a one-unit increase in the animal units per acre grazed increases days on hay by 18%. Similarly, a rotational stocking parameter of 0.78 would be interpreted to mean that the use of rotational stocking is associated with a 22% decrease in days on hay.
Marginal effects were calculated for the parameter estimates from the count models (Cameron and Trivedi, Reference Cameron and Trivedi2005). Marginal effects were calculated by taking the first derivative of the mean equation with respect to a specific covariate xi,j , which is expressed as
 $${{(dE[Hay_i^s|{{\bf{X}}_i}])} \over {d{x_{i,j}}}} = \beta _j^Sexp{\mkern 1mu} (\overline {\bf{X}} _i^\prime {\beta ^S})$$
where $\overline {\bf X}_i^\prime $
is the mean value for all independent variables. Marginal effects for each covariate used in this analysis are provided. The marginal effects were interpreted as the effect a one-unit change in an independent variable has on the number of days on hay,
$\overline {\bf X}_i^\prime $
is the mean value for all independent variables. Marginal effects for each covariate used in this analysis are provided. The marginal effects were interpreted as the effect a one-unit change in an independent variable has on the number of days on hay,
 $${\widehat {HAY}^s} = exp (\overline {\bf{X}} _i^\prime {\bf{\beta} ^S}).$$
The delta method was used to estimate the standard errors of the marginal effects.
$${\widehat {HAY}^s} = exp (\overline {\bf{X}} _i^\prime {\bf{\beta} ^S}).$$
The delta method was used to estimate the standard errors of the marginal effects.
5. Variable hypotheses
Table 2 shows the expected signs of the parameters for the count model. Respondents indicated the number of livestock they grazed in 2017, by age and sex. These head were converted into total animal units and divided by the total acres grazed in 2017 to calculate the stocking rate (STOCK) for 2017. Studies show that marginal net returns from increased stocking rate increase at a diminishing rate up to a point after which they decline (Kaitibie et al., Reference Kaitibie, Epplin, Brorsen, Horn, Krenzer and Paisley2003). Overstocking pastures reduces the amount of forage available per animal, and gains decrease and/or feed costs increase, resulting in lower per-animal returns. It is anticipated that higher stocking rate will be linearly correlated with greater numbers of days on hay across all seasons. We asked producers if they rotated their cattle between pastures or paddocks at least once during the summer in 2017 (ROTATE). This is different from rotational grazing, which requires producers to divide pastures and cycle cattle through paddocks based on forage growth and availability on a regular basis (Briske et al., Reference Briske, Derner, Brown, Fuhlendorf, Teague, Havstad, Gillen, Ash and Willms2008; Hawkins, Reference Hawkins2017). We asked if they rotate cattle once in the summer and not on a regular basis. Survey data have indicated that rotational grazing extends grazing days by allowing producers to rest pasture and stockpile forage for future grazing (Gillespie et al., Reference Gillespie, Kim and Paudel2007; Gillespie, Kim, and Paudel, Reference Gillespie, Kim and Paudel2007; Ward et al., Reference Ward, Vestal, Doye and Lalman2008), but grazing studies show little evidence of benefits from rotational grazing (Briske et al., Reference Briske, Derner, Brown, Fuhlendorf, Teague, Havstad, Gillen, Ash and Willms2008; Hawkins, Reference Hawkins2017). The variable in the study is not the same as rotational grazing but is rotating cattle to a summer pasture to decrease days on hay.
Table 2. Expected signs of the parameter estimates for the count model by season
Producers were asked to indicate whether they grazed cattle in 2017 on any of a number of different predefined forage combinations. These forage combinations were selected based on recommendations from extension specialists and possible forage combinations available to Tennessee producers. Responses to this question were used to create three categorical variables. Cattle grazing only cool-season perennial grasses, such as tall fescues (CSG), would be expected to have little need to be fed hay during SPRING and FALL as cool-season perennial grasses are at peak growth during these times. However, these producers would be expected to be more reliant on hay during the WINTER and SUMMER seasons, because cool-season grasses have insufficient growth during these periods. The CSG variable was deleted from the regressions to avoid multicollinearity and served as the base case for the other two categorical variables. Producers who have diversified their cool-season perennial by interseeding a cool-season annual (DIVC) are expected to feed fewer days of hay during the WINTER, SPRING, and FALL seasons than producers who are only grazing a perennial cool-season grass. No hypothesis is offered for SUMMER, because interseeding a cool-season annual will not address concerns over the dormancy of cool-season perennials during the summer months. Producers who have diversified their cool-season perennials with a warm-season grass (DIVW) are expected to feed fewer days of hay in the SPRING, SUMMER, and FALL seasons but will likely have more days on hay in the WINTER, relative to producers who graze cattle on cool-season perennials only.
Use of any one of the pasture management practices—applying fertilizer or lime (FERT), spraying to control weeds (WEED), soil testing (TEST), and renovating or converting pastures when necessary (REDO)—is expected to decrease the days on hay across all seasons. All of these practices are recommended by University of Tennessee Extension to improve forage production. Fertilizer applications are recommended during the fall or spring, and soil testing is recommended at least once every 3 to 5 years. Depending on the type of weeds the producer is trying to control, application could occur nearly year-round. However, most weeds in this region are controlled with fall and spring applications. Studies have shown that soil fertility and weed management improve pasture health and forage growth, extending grazing days (Gillespie et al., Reference Gillespie, Kim and Paudel2007; Ramsey et al., Reference Ramsey, Doye, Ward, McGrann, Falconer and Bevers2005; Ward et al., Reference Ward, Vestal, Doye and Lalman2008). Producers who cut hay in 2017 (CUT) are hypothesized to feed hay more days than producers who did not cut hay. Managing pasture for hay production would likely decrease the number of days of grazing and increase the number of days of feeding hay.
Ward et al. (Reference Ward, Vestal, Doye and Lalman2008) found that producers less dependent on cattle for their total household income were less likely to adopt practices to limit days feeding hay. A producer with a high nonfarm income might have more discretionary income to spend on feeding hay and less concern with the farm being profitable. Thus, cattle producers for whom farm income constitutes a greater share of their total household (INC) are expected to be less reliant on supplemental hay feeding, all else being equal. Finally, it is unclear whether or how producer age (AGE) affects days on hay, in part because it is difficult to foresee whether feeding more days on hay implies an increased or decreased physical burden. Ward et al. (Reference Ward, Vestal, Doye and Lalman2008) found age did not affect the length of hay feeding.
6. Results
6.1. Summary statistics
The mean number of days respondents fed hay to cattle during the WINTER was 82, and 85% of the respondents reported feeding cattle hay for 80 or more days during the WINTER (Figure 2). For SPRING, the average days feeding hay dropped to 11, and 94% of the respondents fed hay for fewer than 30 days (Figure 2). Roughly half of the respondents fed cattle hay for 10 days or less during the SPRING. The extensive reliance of Tennessee cattle producers on hay during the WINTER and much reduced reliance during SPRING were not surprising given that tall fescue is dormant during WINTER and at its most productive during SPRING. However, given the diminished growth and high potential for toxicity of tall fescue during the SUMMER, it is somewhat surprising that the average number of days cattle were fed hay during the SUMMER was only 2, and that more than 90% of the respondents fed cattle hay 10 days or less during the SUMMER (Figure 2). However, voluntary summer grasses, such as crabgrass and common Bermuda grass, are common in Tennessee pastures and can provide valuable nutritional supplement during this period. Grazing these annuals might explain why producer reliance on hay for supplemental feed in the SUMMER is as low as it is. Finally, the mean number of days cattle were on hay during the FALL was 48, with 71% of the respondents indicating they fed hay between 20 and 70 days during this period (Figure 2).
Figure 2. Distribution of response to number of days on hay by Tennessee producers in 2017 by season.
Table 3 provides summary statistics for the independent variables. The average stocking rate (STOCK) was 0.69 animal units per acre grazed, which is roughly equivalent to 1.5 cow-calf pairs per acre, which matches the University of Tennessee Extension recommendation for stocking rate. More than three-quarters (77%) of the respondents rotated cattle between pastures or paddocks during the 2017 summer (ROTATE).
Table 3. Summary statistics of independent variables
Only 21% of the respondents exclusively grazed cool-season perennial forage in 2017 (CSG). A majority (55%) used a cool-season perennial forage interseeded with a cool-season annual (DIVC), and nearly a quarter (24%) grazed a mixture of cool- and warm-season perennial forages in 2017 (DIVW). The data suggest that a majority of producers are using multiple forage species throughout the year to extend grazing. Most producers were concerned about extending grazing or reducing the number of days feeding hay during the winter months by using winter annuals.
The majority of respondents applied some form of fertilizer or lime to their pasture (85%) and sprayed herbicide on their pastures to manage weeds (80%). Pastures were soil tested (TEST) by 62% of the respondents in 2017. More than a third (38%) of the respondents have either completely renovated or converted a pasture during the last 10 years (REDO). Most (87%) of the respondents cut hay in 2017 (CUT). The average age (AGE) of the respondents was 57 years, which is similar to the average Tennessee cattle producers’ age reported in the 2012 Census of Agriculture (USDA-NASS, 2014). The mean percentage of total household income from farming (INC) was between 20% and 40%. Thus, respondents mostly relied on off-farm income in 2017.
6.2. Model selection
Because the majority of the responses for days on hay in the WINTER were above 85 days, we subtracted the days on hay indicated by the producer from the total number of days possible to feed hay (90 days). This gave total number of days not feeding hay. We converted this variable for estimation purposes. This resulted in more observations near the lower limit. Results of the likelihood ratio and Vuong tests are shown in Table 4. The negative binomial was preferred over the Poisson for all seasons. Thus, the variance of days on hay was greater than the mean days on hay for all seasons. The zero-inflated specification was statistically a better-fitting model for days on hay in SPRING, SUMMER, and FALL, as well as the days not feeding hay in WINTER. This result is not surprising given the large number of zero responses for these seasons.
Table 4. Results of the likelihood ratio test comparing Poisson and negative binomial regressions and the Vuong test comparing zero-inflated with count model by season
6.3. Parameter estimates
Table 5 shows the IRRs for the negative binomial and the parameters for the logit model for the best-fitting model by season. Table 6 provides the marginal effects for the count model by season. The difference is explained by the reweighting of the zero responses with the zero-inflated models. Because we converted the WINTER dependent variable to days not feeding hay, the logit model indicated the probability of a producer reporting feeding hay. As stocking rate increased, the likelihood of feeding hay increased. If a producer grazed a mixture of cool- and warm-season forages (DIVW) and took a soil test (TEST), the likelihood of a producer reporting feeding hay decreased, relative to those who exclusively grazed cool-season perennial grass and did not soil test. Finally, a producer that cut hay in 2017 increased the likelihood of feeding hay during the WINTER months.
Table 5. Estimated incidence rate ratios for the count model and parameters for the logit model by season
Note: Single, double, and triple asterisks (*, **, ***) represent significance at the 10%, 5%, and 1% level, respectively.
Table 6. Estimated marginal effects for the count model by season
Note: Single, double, and triple asterisks (*, **, ***) represent significance at the 10%, 5%, and 1% level, respectively.
a Total change in days on hay was only calculated for significant marginal effects at the 10%, 5%, and 1% level. “-” means the factor did not significantly affect days on hay.
For the SPRING, higher stocking rate (STOCK) decreased the likelihood of a producer reporting zero days on hay, but grazing a cool- and warm-season forage mixture (DIVW) and testing soil (TEST) increased the likelihood of a producer reporting zero days on hay (Table 5). An increased in the stocking rate (STOCK) of one animal unit per acre increases the number of days on hay during the SPRING by 3.5 days (17.5%), which was expected. Producers who grazed a cool-season perennial grass interseeded with a cool-season annual (DIVC) reported 4.5 fewer days on hay (22.5% reduction) than those grazing a cool-season perennial grass. Finally, the application of herbicides to control weeds (WEED) was associated with a reduction in the number of days on hay of 2.9 days (14.5%) during the SPRING, relative to those who did not control weeds.
In the SUMMER, most producers indicated zero days on hay; thus many of the factors considered were insignificant. Producers reporting a diversified pasture mixture of cool-season perennial and annual grasses (DIVC) reported 12.3 fewer days on hay (or 43.9%) than those who relied solely on cool-season perennial pasture. Interestingly, grazing a cool- and warm-season forage mixture (DIVW) did not significantly affect the number of days on hay relative to those who only grazed cool-season perennial grass.
Producers who rotated cattle among pasture or paddocks during the summer (ROTATE) were more likely to report zero days on hay during the FALL. Increasing the stocking rate (STOCK) by one animal unit per acre increased days on hay in the FALL by 3.0 days (6.4%), which was similar to the finding for the SPRING season. The spring and fall seasons are when most calves are born and cows are starting to rebreed (Henry et al., Reference Henry, Boyer, Griffith, Larson, Smith and Lewis2016). Thus, stocking rate would likely be highest during these periods. An implication of this finding is that pregnancy checking and culling open cows could help reduce the stocking rate in peak times and, thus, help reduce days on hay. That is, identifying open cows through pregnancy testing and culling those animals could reduce the stocking rate and reduce the number of days on hay. Rotating cattle between pastures during the summer, applying herbicide, and soil testing decreased the number of days on hay by 5.4 days (11.4%), 3.5 days (7.4%), and 2.8 days (6.0%), respectively.
Economically optimal forage mixes and pasture management practices depend on the costs of the mixes and practices, their effects on the ability to reduce need for supplemental hay feeding, and hay prices. To select optimal mixes and practices, producers will need to compare the costs of these practices to their effects on the costs of supplemental hay feeding. A producer would need to consider their capabilities and operation to determine if these practices were of a lower cost than feeding hay.
7. Conclusions
This study determined how various forage mixtures and pasture and grazing management practices were correlated with the number of days hay was fed to cattle by season. Data were collected from a survey of Tennessee cattle producers in 2018. Models were estimated and tested to find the most appropriate method to explain these results. To our knowledge, this study extends the literature by examining practices that could reduce hay costs.
The distribution of days of feeding hay by producers varies by month, and factors such as forage mixtures, pasture management, and grazing management can affect days feeding hay or, conversely, days grazing. The majority of respondents indicated they graze cattle on a diverse pasture mixture of cool- and warm-season perennial grasses along with cool-season annual grasses. Most producers are also managing fertility and weeds in their pastures. Having a mixture of cool- and warm-season forages decreased days on hay in the winter, while a mixture of cool-season perennial and annual grasses reduced days that cattle were on hay in the spring and summer.
The timing of how these forages and practices affect days on hay is notable as a topic of future research. For example, having mixtures of cool- and warm-season grasses, which grow from the spring to fall months, reduced the number of days on hay in the winter months, and having a diversified forage of cool-season perennials and annual grasses reduced the days on hay during the summer, which is when these forages are not growing. In both cases, days on hay were decreased in months when forage production was slowest, suggesting producers with diversified pasture forages are stockpiling forages to extend grazing days past the forage growth cycle. Conversely, spraying for weeds, which would likely occur in the spring and fall, appears to reduce the number of days on hay in those months.
Although this research is unique, it is not without limitations. We recognize these data were gathered from a survey during one production year. Results could vary across years given variability in climate and environmental factors from year to year. Many further relevant research topics could be explored with these data. For example, which factors affect the adoption and frequency of rotational grazing? These data could also be used to extend previous studies by Ward et al. (Reference Ward, Vestal, Doye and Lalman2008) and Pruitt et al. (Reference Pruitt, Gillespie, Nehring and Qushim2012) by examining factors that affect producers’ adoption of a bundle of practices.
Financial support
This project was supported by Agriculture and Food Research Initiative Competitive Grant No. 2015-68007-23212 from the USDA National Institute of Food and Agriculture. This research is also supported by USDA, Cooperative State Research, Education, and Extension Service through Tennessee Hatch Project TEN00442.


 Open access