


1. Introduction
Conservation agriculture, defined as an application of agricultural practices to improve production while concurrently protecting and enhancing the land resources on which production depends, is promoted globally to combat the challenges of feeding the growing and more demanding world population (Dumanski et al., Reference Dumanski, Peiretti, Benites, McGarry and Pieri2006; Pittelkow et al., Reference Pittelkow, Liang, Linquist, van Groenigen, Lee, Lundy, van Gestel, Six, Venterea and van Kessel2014). Conservation agriculture practices help reduce the impact of agriculture on the environment, contribute to improved soil health, increase soil carbon sequestration, and reduce greenhouse gas emissions (Wade, Claassen, and Wallander, Reference Wade, Claassen and Wallander2015). Farmers’ decisions to adopt conservation agriculture practices have economic and environmental implications and sometimes involve large investments (e.g., customized equipment for planting) and time commitment (e.g., participating in programs such as the Conservation Stewardship Program) (Dessart, Barreiro-Hurlé, and Bavel, Reference Dessart, Barreiro-Hurlé and van Bavel2019). Because many conservation practices provide synergistic environmental and economic benefits both on and beyond farms, many governments provide financial incentives for producers to adopt these practices, particularly in intensive agricultural production areas. However, these policies can become controversial either due to the potential costs or due to the questions about cost-effectiveness. An improved understanding of the factors that influence farmers’ conservation practice adoption decision is of paramount importance to refine policies and programs to scale up the adoption of these practices in intensive agricultural production areas in a cost-efficient way.
Available evidence on the use of conservation agriculture practices from the U.S. suggests that environmental benefits are very strong; however, the potential of economic benefits vary based on factors that include farmers’ management style, farm location, farm characteristics, crops grown, weather, and soil type (Altieri, Reference Altieri1999; Claassen, Duquette, and Smith, Reference Claassen, Duquette and Smith2018; Crookston et al., Reference Crookston, Kurle, Copeland, Ford and Lueschen1991; Davis et al., Reference Davis, Hill, Chase, Johanns and Liebman2012; Delgado et al., Reference Delgado, Dillon, Sparks and Essah2007; Datu Research, 2014; Fausti, Reference Fausti2015; Fuglie, Reference Fuglie1999; Holland, Reference Holland2004; Jolly, Edwards, and Erbach, Reference Jolly, Edwards and Erbach1983; Kaspar and Singer, Reference Kaspar and Singer2011; NRCS, 2019a; Temple et al., Reference Temple, Friedman, Samson, Ferris, Scow and Klonsky1994; Wu and Babcock, Reference Wu and Babcock1998; Zentner et al., Reference Zentner, McConkey, Campbell, Dyck and Selles1996; CTIC, 2017). Previous studies link variation in adoption behavior in conservation agriculture practices to a large number of observable proxies for on-farm benefits and adoption costs, including farm characteristics; climate conditions, profitability, individual traits such as age, education, environmental awareness, and farm-level characteristics such as farm size, type of land tenure, and trust in information source (Bergtold et al., Reference Bergtold, Ramsey, Maddy and Williams2017; Delgado et al., Reference Delgado, Dillon, Sparks and Essah2007; Litchenberg, Reference Litchenberg2001; Prokopy et al., Reference Prokopy, Floress, Klotthor-Weinkauf and Baumgart-Getz2008; Reference Prokopy, Floress, Arbuckle, Church, Eanes, Gao, Gramig, Ranjan and Singh2019; Ranjan et al., Reference Ranjan, Church, Floress and Prokopy2019; Soule, Tegene, and Wiebe, Reference Soule, Tegene and Wiebe2000; Wu and Babcock, Reference Wu and Babcock1998). Studies have also shown that farmers in proximity to each other exhibit similar patterns of adoption behavior toward new technologies/practices for several reasons that include a reduction in learning costs through the sharing of information about the real costs, benefits, and risks of adoption (Dessart, Barreiro-Hurlé, and van Bavel, Reference Dessart, Barreiro-Hurlé and van Bavel2019). Quantifying this effect can help improve our understanding of what influences the adoption and could play a role in improving federal and local conservation program design. However, studies examining the role of spatially mediated peer effects in the adoption of conservation agriculture practices in the U.S. are lacking. Additionally, ignoring spatially mediated peer effects in adoption behavior may bias the estimation of parameters of interest (Case, Reference Case1992).
In this paper, we analyze the role of spatially mediated peer effects in farmers’ adoption decisions for conservation agriculture practices and examine whether the influence of spatial peer effects varies between conservation practices. To identify spatial effects, we use location-specific survey data on the adoption of conservation tillage, cover crops, and diverse crop rotation, collected from eastern South Dakota during the spring of 2018. Eastern South Dakota has corn and soybean as dominant crop production systems. The federal renewable fuel policy has prompted the construction of several ethanol refineries in the study region and further cemented the dominance of the corn–soybean production system. Federal agencies such as the United States Department of Agriculture’s Natural Resource Conservation Service (USDA-NRCS) recommends joint adoption of conservation practices to ensure adopters receive the most long-term economic and environmental benefits.
Scaling up the adoption of conservation practices in regions with intense and less diversified crop production systems is important to ensure the long-term sustainability of agriculture and the environment. Understanding of the role of spatial peer effects in farmers’ adoption decisions and how its influence varies between practices will provide insights for policy makers to prioritize between programs and policies that target either individual households or neighborhood networks to effectively induce behavioral changes. For example, if spatially mediated peer effects improve adoption, local conservation efforts could focus on demonstration on working farms as opposed to research plots or federal subsidy programs and encourage conservation research on farmers’ fields by compensating producers who assist with conservation research and education.
Methodologically, we estimate how the likelihood of adopting a conservation practice changes depending on the percentage of adopters of that conservation practice within a farmers’ spatially mediated peer network while controlling for spatial heterogeneity (spatial fixed effects) and potential correlation between a farmers’ adoption decisions on conservation tillage, diverse crop rotation, and cover crops. We define farmers’ peer network at two different levels: (i) neighbors in a 15-mile radius and (ii) neighbors in a 30-mile radius. We control for spatial heterogeneity by including agricultural statistics district (also known as cropping districts) dummies that group together counties based on geography, climate, and cropping systems.
The study finds that spatially mediated peer effects are important in the adoption of conservation tillage and diverse crop rotation. However, the marginal effects of spatial peer effects are not substantial in the adoption of conservation tillage and diverse crop rotation. Our findings suggest that leveraging spatial peer effects will be important to scale up the adoption of conservation tillage and diverse crop rotation in the U.S. The non-significance of peer effects in the adoption of cover crops suggests that policy makers will have to rely on other measures/programs to scale up the adoption of cover crops. Results from the study also suggest the importance of accounting for spatially mediated peer effects in the analysis of adoption decisions to avoid biased estimates for other control variables.
Our work contributes to the existing literature on spatial effects and technology adoption by disentangling spatially mediated peer effects from spatial heterogeneity (Bell et al., Reference Bell, Hayes, Pembleton and Waters2014; Bollinger and Gillingham, Reference Bollinger and Gillingham2012; Conley and Udry, Reference Conley and Udry2010; Foster and Rosenzweig, Reference Foster and Rosenzweig1995; Genius et al., Reference Genius, Koundouri, Nauges and Tzouvelekas2014; Muller and Rode, Reference Muller and Rode2013; Sampson and Perry, Reference Sampson and Perry2019). To the best of our knowledge, no previous study has empirically examined the role of spatially mediated peer effects in the adoption of conservation agriculture practices in the U.S. One limitation of the study is that due to the lack of data, the empirical model used in the study does not include farm-level variables on soil conditions and crop mix. Although we include crop district dummies to capture spatial heterogeneity effects related to geography, climate, and cropping practices, addressing this limitation will strengthen the analysis in future research.
2. Conservation Agriculture Practices in the U.S.
Conservation agriculture practices promote soil health, defined as the continued capacity of a soil to function as a vital, living ecosystem that sustains plants, animals, and humans, by way of minimizing soil disturbance, and maximizing soil cover and biodiversity (NRCS, 2019b). Conservation tillage, a generic term implying all tillage methods that reduce runoff and soil erosion in comparison with plow-based tillage, is known to increase soil carbon sequestration (Lal and Kimble, Reference Lal and Kimble1997). There is strong evidence on the environmental benefits of conservation tillage in the U.S. that includes the protection of soils from erosion and compaction, conservation of soil moisture, improvement in soil structure and stability, and increased presence of soil biota that help to combat pests and diseases (Claassen, Duquette, and Smith, Reference Claassen, Duquette and Smith2018; Fuglie, Reference Fuglie1999; Holland, Reference Holland2004). The economic benefits from conservation tillage include a reduction in production costs through reduced use of machinery, fuel, and labor. However, evidence of the economic benefits is mixed and varies based on crop mix, crop yields, commodity prices, fuel prices, labor availability, and labor costs (Bewick et al., Reference Bewick, Young, Alldredge and Young2008; Fuglie, Reference Fuglie1999; Jolly, Edwards, and Erbach, Reference Jolly, Edwards and Erbach1983; Juergens et al., Reference Juergens, Young, Schillinger and Hinman2004; Osei et al., Reference Osei, Moriasi, Steiner, Starks and Saleh2012; Varner, Epplin, and Stricklan, Reference Varner, Epplin and Stricklan2011; Zentner et al., Reference Zentner, McConkey, Campbell, Dyck and Selles1996). Technological innovations such as genetically engineered crops that are resistant to herbicides and the increased availability of weedicides for post-emergent weed control reduced the producer’s reliance on tillage for weed control. Meanwhile, innovations in the farm machinery sector such as planters that can cut through crop residue made planting in residue-covered fields easier.
Cover crops are grasses, legumes, and other forbs that are planted for erosion control, improving soil structure, moisture, and nutrient content, increasing beneficial soil biota, suppressing weeds, providing habitat for beneficial predatory insects, facilitating crop pollinators, providing wildlife habitat, and as forage for farm animals (NRCS, 2019a). Due to the long-term environmental benefits of cover crops, they are becoming an integral part of soil health management systems among U.S. producers (CTIC, 2017; Delgado et al., Reference Delgado, Dillon, Sparks and Essah2007; Kaspar and Singer, Reference Kaspar and Singer2011). Further, cover crops are promoted in the U.S. to address water quality issues in the intensive agricultural production areas (Bergtold et al., Reference Bergtold, Ramsey, Maddy and Williams2017; Singer, Nusser, and Alf, Reference Singer, Nusser and Alf2007). Economic benefits of growing cover crops include energy savings both by adding nitrogen to the soil and making more soil nutrients available, thereby reducing the need to apply fertilizer; yield increases for the following cash crop; and forage for livestock for producers with integrated livestock systems (Bergtold et al., Reference Bergtold, Ramsey, Maddy and Williams2017; CTIC, 2017; Kaspar and Singer, Reference Kaspar and Singer2011). However, profitability from the use of cover crops depends on factors that are under the control of producers such as current production system, selection of cover crops, establishment and termination strategies, and factors that are not under the control of producers such as soil type, weather, etc. (Bergtold et al., Reference Bergtold, Ramsey, Maddy and Williams2017). Because of the risks associated with the profitability, cost-share and subsidy programs are available at the federal and state levels to incentivize the adoption of cover crops among U.S. farmers.
Diverse crop rotation refers to growing three or more crops in a rotation, particularly among row crop producers. Careful selection of a crop rotation system offers the possibility of reducing the trade-off between farm profitability and environmental impact by internal nutrient recycling, maintaining the long-term productivity of the land, and by breaking weed and disease cycles (Gebermedhin and Schwab, Reference Gebermedhin and Schwab1998). Evidence on the environmental benefits of diverse crop rotation includes a reduction in soil erosion, improvement in soil fertility, promotion of ecosystem services and ecosystem health, and improved air and water quality (Altieri, Reference Altieri1999; Datu Research, 2014; Davis et al., Reference Davis, Hill, Chase, Johanns and Liebman2012; Ikerd, Reference Ikerd1991; Fausti, Reference Fausti2015; Fausti et al., Reference Fausti, Tia, Lundgren, Li, Keating and Catangui2012). Available evidence from agricultural experiment station research shows that diverse crop rotation has the potential to provide substantial economic returns to producers, particularly in areas affected by herbicide-resistant giant ragweed infestations in the midwestern U.S. (Golpen et al., Reference Golpen, Coulter, Sheaffer, Becker, Breitenbach, Behnken and Gunsolus2018). The total energy use in 3- or 4-year rotations (1.41 and 1.50 BTU, respectively) is substantially lower than the typical 2-year rotation of corn and soybean (3.53 BTU) (Johanns, Chase, and Liebman, Reference Johanns, Chase and Liebman2012). Although not conclusive, there is some evidence on the yield-enhancing effect of crop rotations (Mulik, Reference Mulik2015). Despite these economic and environmental benefits, a combination of technological innovations in agriculture such as the introduction of genetically modified crops, federal agricultural policies including commodity support programs focusing mainly on five crops (corn, soybean, wheat, rice, and cotton) and crop insurance and market assistance programs focusing on limited commodities, biofuel policies supporting the production of a limited number of crops, and high market prices for select commodities have contributed to a steep decline in the prevalence of diverse crop production systems particularly during the last two decades (Benbrook, Reference Benbrook2012; Brookes and Barfoot, Reference Brookes and Barfoot2013; EPA 2018; Fausti, Reference Fausti2015; Fausti et al., Reference Fausti, Tia, Lundgren, Li, Keating and Catangui2012).
As per a recent USDA study, conservation tillage was used in 67% of the wheat area in 2017, 65% of the corn area in 2016, and 70% of the soybean area in 2012. The adoption of conservation tillage varies by region, with a higher rate of adoption in drier and warmer regions which include Northern Great Plains, Prairie Gateway, and the South (Claassen et al., Reference Claassen, Bowman, McFadden, Smith and Wallander2018). Only about 4% of U.S. farmers adopted cover crops on some portion of their fields in 2010–2011, and only about 1.7% adopted cover crops on cropland (Wade, Claassen, and Wallander, Reference Wade, Claassen and Wallander2015). Due to financial incentives, cover crops acres in the U.S. increased 50% from 10.3 million acres in 2012 to 15.4 million acres in 2017. Across the 12 states of the U.S. Corn Belt, about 70% of the planted crop area is under corn–soybean rotations, leaving only 30% for diverse crop rotation (Mulik, Reference Mulik2015).
As per the 2017 NRCS cropping system inventory for South Dakota, 45% of crop area is under no-till, followed by 22% in mulch tillage, 17% in reduced tillage, and 16% in conventional till (NRCS, 2017). Between 2012 and 2017, there was an 89% increase in planted acres under cover crops; from 149,383 acres in 2012 to 281,649 acres in 2017 (LaRose and Meyers, Reference LaRose and Meyers2017). As per the 2017 Census of Agriculture data, harvested crop acreage of corn and soybean in South Dakota increased 13%, from 57% in 2002 to 70% in 2017 (NASS, 2017).
3. Empirical Framework
Regional variations in adoption rates of conservation practices suggest the importance of spatial effects, independent of social, economic, and institutional factors in farmers’ adoption decisions. Spatial effects can be conceptualized as two types of impacts that influence farmers’ adoption decisions through different processes. The first type of spatial effect relates to geographic factors such as soil, climate, and topography. The observed distributional pattern of farmers’ adoption decisions can be explained partially by the variations in these factors. We define these exogenous/contextual characteristics commonly shared by individuals within a group as spatial heterogeneity (Sampson and Perry, Reference Sampson and Perry2019). In the case of spatial heterogeneity, the relationship between the spatial factor and a farmer’s adoption decision is constant for a particular spatial factor (e.g., cropping district), but varies between spatial factors (e.g., between cropping districts). There is substantial variation among the adoption rates of conservation practices within South Dakota (see Figure 1). For example, the adoption of no-till and crop diversity is the highest in the central part of the state while the heaviest use of cover crops is in the central and northeastern part of the state (NRCS, 2017). Figure 1 shows that the adoption of conservation practices was observed as higher in northern areas than in the south, and higher in districts located on the west side than on the east side.

Figure 1. Crop-district wise adoption of conservation practices in eastern South Dakota.
The other type of spatial effects refers to the impact of neighbors’ adoption decisions on farmers’ adoption decisions. Farmers may observe and learn from their neighbors about technologies and practices through social interactions that are strongly conditioned by the geographic distance between individuals (Bollinger and Gillingham, Reference Bollinger and Gillingham2012; Festinger, Schachter, and Back, Reference Festinger, Schachter and Back1950; Gonzalez, Hidalgo, and Barabasi, Reference Gonzalez, Hidalgo and Barabasi2008; Haynes, Reference Haynes1974; Muller and Rode, Reference Muller and Rode2013; Sampson and Perry, Reference Sampson and Perry2019). Therefore, the diffusion of information, ideas, and technology may occur within a certain geographic distance. We define this type of spatial effects as spatially mediated peer effects or peer effects in short. Farmers’ decisions to adopt knowledge-intensive conservation agriculture practices are primarily driven by economic motives (Dessart, Barreiro-Hurlé, and Bavel, Reference Dessart, Barreiro-Hurlé and van Bavel2019). The economic success/profitability of a specific practice will depend greatly on factors that are under the control of farmers in a specific production context. A decrease in the learning costs associated with switching to the new practice will likely increase the profitability of the practice and thus the likelihood of adoption of the practice.
In this paper, we focus on the spatially mediated peer effects on farmers’ adoption decisions. Previous work has observed regional variations in the adoption of conservation practices in the U.S. and within South Dakota (NRCS, 2017; Wade, Claassen, and Wallander, Reference Wade, Claassen and Wallander2015). Hence, we control for spatial heterogeneity to avoid biased peer effect estimates. We include agricultural statistics district (ASD)/cropping district dummies to capture spatial heterogeneity effects related to geography, climate, and cropping practices. Cropping districts are defined groupings of counties in each state, by geography (soil type, terrain, and elevation), climate (mean temperature, annual precipitation, and length of the growing season), and cropping practices (crops grown and use of irrigation).
Defining a peer group is a major challenge in studies focusing on spatial effects (Sampson and Perry, Reference Sampson and Perry2019). In sparsely populated rural areas, we expect that the peer effects may not emerge at the same level of geography as it would be in an urban or more populated setting. In this study, we use two different peer-group definitions: (i) neighbors in a 15-mile radius and (ii) neighbors in a 30-mile radius. The 15-mile radius more or less corresponds to the average school district boundary in South Dakota. Given the large farm sizes in South Dakota, the inclusion of a smaller geographic boundary (less than 15 miles) will not provide us enough information to generate a meaningful variable that captures spatial peer effects. Additionally, sample data may not give good representative statistics for the peer effects if the size of the neighborhood is much reduced. The inclusion of a larger boundary (e.g., 50-mile radius) will conceptually capture at least part of the effects (if any) of the crop district dummies. As mentioned earlier, the focus of this study is to isolate the effect of spatial peer effects after controlling for spatial heterogeneity and other confounding factors, hence selecting a larger geographical boundary for defining the peer group may not be effective, conceptually. To test the sensitivity of peer effects to the specification of peer-group definition, we have conducted analyses using a 50-mile radius to define the peer group and the results are presented in Table S2.
To compute the measurement of spatially mediated peer effects, we first create a radius of a given distance (15, 30, and 50 miles, respectively) for each farmer. Within the radius for each farmer, we then count the total number of adopters. If the focal farmer is not an adopter, then the number of adopters is the number of neighboring adopters. If the focal farmer is an adopter, the number of neighboring adopters is calculated by subtracting 1 from the number of adopters. The adoption rate is then calculated by dividing the number of neighboring adopters by the number of neighboring farmers.
Although peers’ adoption in previous years might be influential in a focal farmer’s adoption decision, some studies use contemporaneous adoption by peers to capture the peer effects. Manski (Reference Manski1993)’s discussion of the contemporaneous effects through peer influence pointed out that although it would be more realistic to assume the lag in the transmission of the effects, the dynamic process may have a “unique stable temporal equilibrium of the form.” Brock and Durlauf (Reference Brock and Durlauf2002) and Durlauf (Reference Durlauf, Vernon Henderson and Thisse2004) have a detailed discussion of the contemporaneous effects as one form of neighborhood effects by which individual behaviors are influenced by interaction with peers. Previous studies on peer effects on a wide range of social behaviors have used similar approaches. Gaviria and Raphael (Reference Gaviria and Raphael2001)’s analysis of school-based peer effects used the proportion of students in the school engaged in the defined activity after excluding the individual. Baerenklau (Reference Baerenklau2005) used the number of members in the defined peer group as the measure of peer-group influence to examine whether a producer will consider adopting an anaerobic digester. More recently, Cowley and Brorsen (Reference Cowley and Wade Brorsen2018) used the number of in-state neighbors as the measure of peer group influence on the adoption of anaerobic digesters. We used a distance-based approach to define who would be included in the peer group of the focal farmer. We consider this is part of the geographic network of the focal farmer. This also addresses the identification problem raised by Manski (Reference Manski1993).
3.1. Empirical Model
Suppose there are $N$
farmers in the region and consider that farmer
$N$
farmers in the region and consider that farmer $i$
will adopt a conservation practice if the expected utility of adoption which includes stochastic monetary profit exceeds the utility of non-adoption. The stochastic monetary profit depends on factors such as costs of production, yield, market price, government subsidies, weather effects, and farm and farmer characteristics. As mentioned earlier, the derived utility from adopting a conservation practice will also depend on the learning costs associated with adopting the new practice.
$i$
will adopt a conservation practice if the expected utility of adoption which includes stochastic monetary profit exceeds the utility of non-adoption. The stochastic monetary profit depends on factors such as costs of production, yield, market price, government subsidies, weather effects, and farm and farmer characteristics. As mentioned earlier, the derived utility from adopting a conservation practice will also depend on the learning costs associated with adopting the new practice.
Let Y i = 1 denote the decision of producer i to adopt a conservation practice and let Y i = 0 denote the decision to not adopt the conservation practice. Let the perceived profit associated with adoption decisions be denoted by π i Yi . The relative net profit from adopting the practice is defined as:
 $$\Delta {\pi _i}\, = \,{\pi _i}^1 - {\pi _i}^0$$
Let U i Yi denote the utility for producer i from decision Y i . Adoption occurs when
 $$E\left( {U\left\{ {1,{\pi _i}^1,L{C_i}\left[ {{I^1}\left( {{a_j}} \right)} \right],X} \right\}}\right){\rm{ }} \gt E\left[ {U\left( {0,{\pi _i}^0,X} \right)} \right],$$
where LC i is the learning cost associated with adopting the practice which depends on conservation practice-specific information available from the neighboring farmers’ adoption decisions I 1 (a j ) and X, a vector of observable covariates.
The producer’s utility function U(Y i , π i Yi ; X) is unknown to us, and the deterministic part of the utility function is V(Y i , π i Yi ; X). So the inequality in equation (2) can be written as:
 $$V\left\{ {1,\pi _i^1,L{C_i}\left[ {{I^1}({a_j})} \right],X} \right\} + {U_1} > V\left( {0,\pi _i^0,X} \right) + {U_0}$$
where U 1 and U 0 are independent and identically distributed random disturbances with zero means and unit variances.
Equation (3) implies that a reduction in the learning costs (spatially mediated peer effects) will increase the expected utility of adopting a conservation practice. We expect that as the percentage of adopters in the neighborhood increases it might lead to a reduction in the learning costs associated with the practice and thus the adoption costs. However, due to the idiosyncrasies associated with various conservation practices described earlier, the role of learning costs might vary between practices.
The conceptual model described above can be represented as the following latent equation:
 $$Y_i^* = \;\beta '{X_i} + \alpha '{l_i} + \emptyset {Y_j} + { \in _i}$$
where $Y_i^*$
is the latent variable,
$Y_i^*$
is the latent variable, ${X_i}$
is the observable farm and farmer characteristics,
${X_i}$
is the observable farm and farmer characteristics, $\;{l_i}$
is the location-specific controls to account for spatial heterogeneity, and
$\;{l_i}$
is the location-specific controls to account for spatial heterogeneity, and ${Y_j}$
captures spatially mediated peer effects expressed by the percentage of adopters in the defined peer group (a proxy for the reduction in learning costs).
${Y_j}$
captures spatially mediated peer effects expressed by the percentage of adopters in the defined peer group (a proxy for the reduction in learning costs).
However, we observe only the binary outcome ${Y_{i\;}}$
(whether farmer i has adopted the practice or not) and equation (4) can be empirically estimated as equation (5) using a univariate probit model that uses maximum likelihood estimation:
${Y_{i\;}}$
(whether farmer i has adopted the practice or not) and equation (4) can be empirically estimated as equation (5) using a univariate probit model that uses maximum likelihood estimation:
 $${Y_{i{\rm{\;}}}}={\rm{\;}}\beta '{X_i} + \alpha {\rm{'}}{l_i} + \emptyset {Y_j} + { \in _i}$$
where $\alpha$
and
$\alpha$
and $\emptyset $
are parameters to be estimated.
$\emptyset $
are parameters to be estimated.
In our study, we are focusing on three different conservation practices: conservation tillage, diverse crop rotation, and cover crops. Previous studies have shown that farmers’ adoption decisions on conservation agricultural practices could be correlated (Arbuckle and Roesch-McNally, Reference Arbuckle and Roesch-McNally2015). This implies error terms across the three independent adoption equations are correlated. So equation (5) becomes the M-equation multivariate probit model where M = 3:
 $$Y_{im}^*=\;\beta _m'{X_{im}} + \alpha '{l_i} + \emptyset {Y_{jm}} + { \in _{im\;}},\;\;\;\;\;m = CT,CC,{\rm{\;\;and\;\;}}DCR$$
where $Y_{im}^*$
is the latent variable,
$Y_{im}^*$
is the latent variable,
 $${Y_{im}}=1\;if\;Y_{im}^* \gt 0\;{\rm{and\;}}0{\rm{\;otherwise}},$$
where ${Y_{im}}$
is the observed outcome.
${Y_{im}}$
is the observed outcome. ${ \in _{im\;}}$
,
${ \in _{im\;}}$
, $m$
=
$m$
= $\;CT,CC,{\rm{\;and}}\;DCR$
are error terms distributed as multivariate normal, each with a mean of zero, and variance–covariance matrix V, where V has values of 1 on the leading diagonal and correlations
$\;CT,CC,{\rm{\;and}}\;DCR$
are error terms distributed as multivariate normal, each with a mean of zero, and variance–covariance matrix V, where V has values of 1 on the leading diagonal and correlations ${\rho _{jk\;}} = \;{\rho _{kj\;}}$
as off-diagonal elements. Following equation (7), we estimate equation (8) below:
${\rho _{jk\;}} = \;{\rho _{kj\;}}$
as off-diagonal elements. Following equation (7), we estimate equation (8) below:
 $${Y_{im\;}}=\beta _m'{X_{im}} + {\alpha ^{'{l_i}}} + \emptyset {Y_{jm}} + \;{ \in _{im}}$$
The log-likelihood function for a sample of N independent observations when M = 3 is given by,
 $$L = \mathop \sum \limits_{i = 1}^N {W_i}log{\emptyset _3}\left( {{\mu _i};\;\Omega } \right)$$
where ${W_i}$
is an optional weight for observations and
${W_i}$
is an optional weight for observations and ${\emptyset _3}$
is the trivariate standard normal distribution with arguments
${\emptyset _3}$
is the trivariate standard normal distribution with arguments ${\mu _i}$
and
${\mu _i}$
and $\Omega $
(Cappellari and Jenkins, Reference Cappellari and Jenkins2003). Equation (9) is estimated using Geweke–Hajivassiliou–Keane (GHK) smooth recursive conditioning simulator where trivariate normal distribution function is expressed as the product of sequentially conditioned univariate normal distribution functions.
$\Omega $
(Cappellari and Jenkins, Reference Cappellari and Jenkins2003). Equation (9) is estimated using Geweke–Hajivassiliou–Keane (GHK) smooth recursive conditioning simulator where trivariate normal distribution function is expressed as the product of sequentially conditioned univariate normal distribution functions.
4. Data
The data used in this study were collected from a farm-level survey conducted in eastern South Dakota during the spring of 2018. We used the survey to collect information on the perceptions of benefits and challenges of farm management practices, particularly conservation tillage, cover crops, and diverse crop rotation; years of adoption of these practices; farmer demographics; and farm characteristics. The list of eligible survey participants in the state was obtained from the Farm Service Agency (FSA) using a Freedom of Information Act (FOIA) request. Using FSA as the source for the participants’ list is reasonable as most of the farm operations in South Dakota work with FSA programs. We employed proportionate stratified-random sampling to select a representative sample of 3,000 farm operators in the eastern part of the state where most of the corn and soybean production occurs. We used four rounds to contact survey participants in 2-week intervals: (i) an invitation letter that described the survey with a link to answer the survey online was mailed to all operations selected (including a $2 bill incentive in half of the letters to test for the effects on response rates), (ii) a hard copy of the survey with return envelopes were mailed to those who did not respond to the survey online; (iii) a reminder postcard was mailed to those who did not respond in round 2; and (iv) a hard copy of the survey with return envelopes were mailed to remaining non-responders. We received 708 completed survey responses. Excluding operations that stopped farming or rented out all of their lands, we had a 30% response rate. However, 190 of the returned survey responses had P.O. boxes as the postal address making it impossible to geocode them for categorizing them into peer groups. Hence, there were 518 completed surveys left for the analysis.
We use farmers’ age and cropland acres operated to evaluate the representativeness of respondents in our sample. As per the U.S. Department of Agriculture 2017 Census of Agriculture data, the average age of producers in South Dakota was 56.1 years. Similar to the Census data, the average age of respondents in our sample is 56.7 years. Based on the 2017 Census data, farm size averaged 1,443 acres in South Dakota. On average, respondents in our sample had an average farm size (total acreage of farmland operated in 2017 planting season) of 1,170 acres. Overall, the key demographics of respondents in our sample is comparable to the state-level demographics reported in the 2017 Census data.
It is evident from Table 1 and Figure 1 that the adoption rate of diverse crop rotation is low (24%) among our respondents compared to the other conservation practices such as conservation tillage (66%), and cover crops (47%). Similar to previous studies (Arbuckle and Roesch-McNally, Reference Arbuckle and Roesch-McNally2015; Singer, Nusser, and Alf, Reference Singer, Nusser and Alf2007), analysis of the pair-wise correlation between adoption decisions show a statistically significant correlation between conservation practices: conservation tillage and diverse crop rotation (r = 0.12, P value = 0.00); conservation tillage and cover crops (r = 0.22, P value = 0.00); and diverse crop rotation and cover crops (r = 0.19, P value = 0.00).
Table 1. Summary statistics of key variables
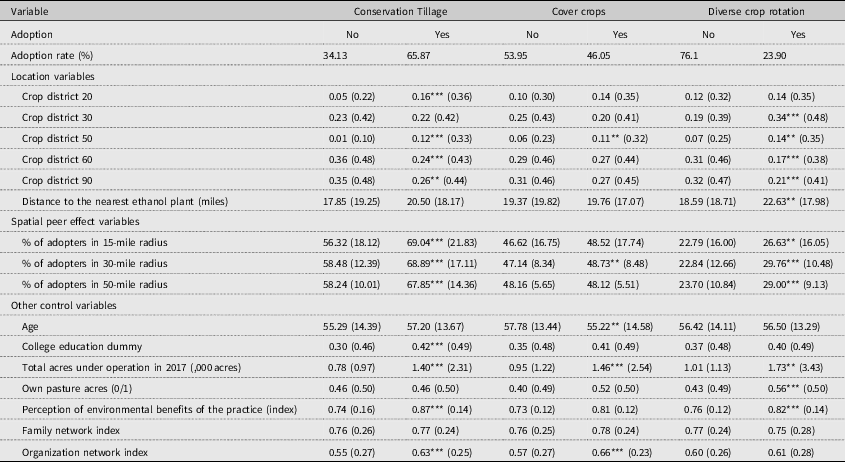
***, ** indicate mean values are statistically significantly different between adopters and non-adopters at 1% and 5% levels, respectively.
4.1. Description of the Variables
Summary statistics of key variables included in the empirical models are presented in Table 1. It is evident from Figure 1 that adoption rates of the conservation practices vary between crop districts. As reported in previous studies, the adoption of conservation tillage is low in wetter districts (60 and 90) and high in drier districts (20 and 50). As per Figure 1 adoption rates of cover crops are higher in districts 50 and 60, and adoption rates of diverse crop rotation are high in districts 50 and 30. It is evident from Figure 1 and Table 1 that relative to conservation tillage and diverse crop rotation adoption rates, crop district-wise variation is limited for adoption rates of cover crops (e.g., district 30, 60, and 90 have more or less similar adoption rates). Parts of crop districts 20 and 50 fall under a climatic transition zone between the wetter eastern part of the state (districts 30, 60, and 90) and the drier western part of the state. The declining east-west average perception in the transition zone and the resulting variation in the temperature and moisture levels affect producers’ decisions on cropping systems in the transition zone. We control for spatial heterogeneity by including crop district dummies that group together counties based on geography, climate, and cropping systems. Crop district dummies 30, 50, 60, and 90 take the value of 1 if farmer i belongs to that specific district and 0 otherwise (where crop district 20 is the base). It is evident from Table 1 that there are statistically significant differences in spatial clustering between adopters and non-adopters of conservation tillage and diverse crop rotation. However, no such spatial clustering is present between adopters and non-adopters of cover crops.
Expansion of corn ethanol production is considered one of the reasons for the declining crop diversity in the U.S. Midwest (Fausti Reference Fausti2015). Results in Table 1 show that on average, adopters of conservation practices are located further away from the ethanol plants than non-adopters. However, a statistically significant difference between adopters and non-adopters exists only for diverse crop rotation. Figure S1 in Supplementary Material (SM) shows the location of ethanol plants in eastern South Dakota. Comparison of Figure 1 and Figure S1 shows that the adoption rate of diverse crop rotation is highest in crop district 50 with only one ethanol plant. It has to be noted here that we are focusing only on the number of ethanol plants and not the total production capacity of ethanol plants per district due to the lack of availability of data. The inclusion of distance in miles to the nearest ethanol plant (ethanolplant_distance_miles) as a control variable will enable us to capture the localized effect of ethanol plants on the adoption of diverse crop rotation.
We include the percentage of adopters in a 15-mile radius and percentage of adopters in a 30-mile radius as spatial peer effect variables. We also estimated models including the percentage of adopters in a 50-mile radius as a spatial peer effect variable and the results are included in Table S2 in SM. Similar to crop district dummies, we find that there is a statistically significant difference in spatial peer effect variables between adopters and non-adopters of conservation tillage and diverse crop rotation, while no such effect is present for cover crops. In our sample, we observe that ethanolplant_distance_miles and peer effect variables (the percentage of adopters in a 15-mile radius and percentage of adopters in a 30-mile radius) are positively correlated at statistically significant levels. Hence, we do not include ethanolplant_distance_miles and peer effect variables together in the model for diverse crop rotation.
Besides the variables that are likely to be associated with spatial patterns in adoption decisions, vector X (equation [8]) contains control variables such as demographics, farm characteristics, and farmer perceptions. We control for farmers’ perception of environmental benefits of a specific conservation practice by including an environmental attitude index variable. In the survey, we asked respondents to rate their agreement or disagreement toward select potential benefits associated with each of the three conservation practices separately on a four-point Likert scale, one (strongly disagree) to four (strongly agree). We created a conservation practice-specific environmental index variable by taking the sum of the respondent’s scores associated with environmental aspects divided by the maximum potential environmental score possible for that practice. The questions on practice-specific potential environmental benefits are given below: builds soil structure and health (conservation till); improves soil health, increases water filtration, and break pest and disease cycle (cover crops); and promote ecological diversity (diverse crop rotation). Although adopters, in general, had higher values of the environmental index, a statistically significant difference between adopters and non-adopters exists only for conservation tillage and diverse crop rotation. In order to isolate the effect of spatial peer effects from the effects of social networks, we include index variables that capture the importance of organizational network and family network as information sources for producers. All the respondents were asked to rate the importance of following information sources in their decision making on a four-point Likert scale, one (not important) to four (very important): university extension, government organizations (e.g., NRCS), commodity groups/farmer associations, and family/friends. The organization network index variable is created by taking the sum of respondent’s scores associated with university extension, government organizations, and commodity groups/farmer associations and dividing by 12 (the maximum cumulative score possible for the three information sources combined). As per the results in Table 1, adopters of conservation tillage and cover crops have higher values of the organizational network index variable at statistically significant levels. The family network index variable is created by dividing a respondent’s score for family/friends by 4 (the maximum score possible). Unlike the organizational network index, there is no statistically significant difference in the value of family network index variables between adopters and non-adopters for any of the conservation practices.
It is evident from Table 1 that there are some differences in the demographic and socioeconomic characteristics between adopters and non-adopters of various conservation practices. Adopters of conservation tillage are more likely to be college-educated and have more acres under operation than non-adopters of conservation till. Adopters of cover crops are younger and have more acres under operation than non-adopters of cover crops. Although there are no statistically significant differences in age and education between adopters and non-adopters of diverse crop rotation, adopters of diverse crop rotation have more acres under operation and are more likely to own pasture acres than non-adopters.
5. Results and Discussion
To account for the potential correlation between the adoption decisions, we have employed a multivariate probit model that included three dependent variables (the adoption of conservation till, adoption of diverse crop rotation, and adoption of cover crops) using GHK simulated maximum likelihood estimation. The significance of the correlation coefficients and the likelihood ratio test support the use of a multivariate probit model instead of three separate probit models. Our focus in this study is to isolate the effect of spatially mediated peer effects on the adoption decisions and examine how such effects vary between conservation practices. Table S1 in SM presents the results from the multivariate probit model without including spatial peer effects. Tables 2 and 3 present the results from multivariate probit models with spatial peer effect variables percentage of adopters in a 15-mile radius and 30-mile radius, and Table S2 in the SM presents results from the multivariate probit model with the inclusion of a 50-mile radius spatial peer effect variable.
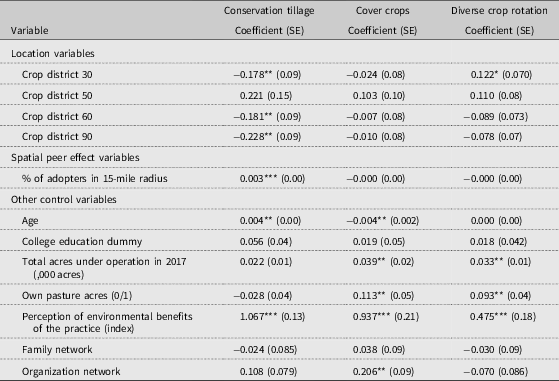
Table 2. Results from the multivariate Probit model with spatially mediated peer effects (15-mile radius peer group)

***, **, * indicate a statistical significance at 1%, 5%, and 10% respectively.
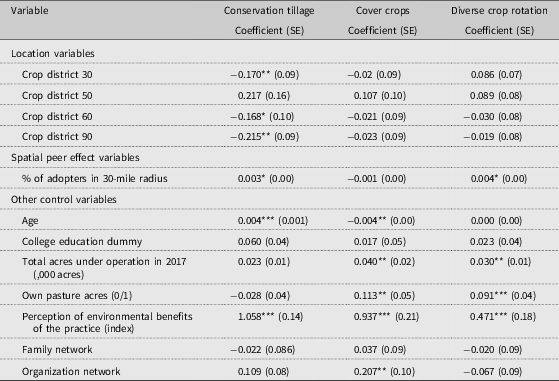
Table 3. Results from the multivariate Probit model with spatially mediated peer effects (30-mile radius peer group)
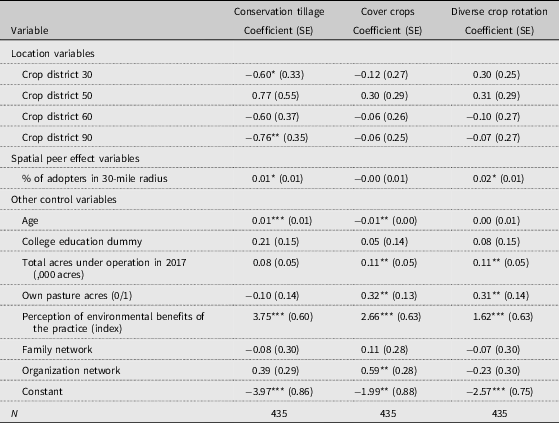
***, **, * indicate a statistical significance at 1%, 5%, and 10%, respectively.
Results in Tables 2 and 3 show that as the percentage of adopters in a 15-mile radius and 30-mile radius increases for farmer i, his/her likelihood of adopting conservation tillage increases. The marginal effect coefficients reported in Tables 4 and 5 show that one-unit increase in the percentage of adopters in a 15-mile radius and 30-mile radius will increase the likelihood of adoption of conservation tillage by 0.003. The sign, statistical significance, and the size of the coefficient and marginal effect are more or less similar for the spatial peer effect variable representing the percentage of adopters in a 50-mile radius (see Table S2 in SM). Conservation tillage is a knowledge-intensive practice that requires capital investments such as specialized equipment for planting. A higher percentage of adopters in the neighborhood might reduce the learning costs associated with the use of conservation tillage through sharing of information about the real costs, benefits, and risks of adoption (Dessart, Barreiro-Hurlé, and van Bavel, Reference Dessart, Barreiro-Hurlé and van Bavel2019). However, the magnitude of the peer effects on the likelihood of adoption is not substantial. Although the negative and statistically significant coefficient of cropping districts 30, 60, and 90 suggests the influence of spatial heterogeneity in the likelihood of adoption of conservation tillage (Claassen, Duquette, and Smith, Reference Claassen, Duquette and Smith2018; Wade, Claassen, and Wallander, Reference Wade, Claassen and Wallander2015), the inclusion of spatially mediated peer effects in Tables 2 and 3 have changed the significance levels and coefficient values of crop district dummy variables and some demographic variables (e.g., college education and total acres under operation) (compared to those in Table S1). Overall, a comparison of results in Tables 2 and 3 with results in Table S1 suggests the importance of including spatially mediated peer effects in adoption analysis to control for biased estimates on other covariates (Case, Reference Case1992; Sampson and Perry, Reference Sampson and Perry2019).
Table 4. Marginal effects from the multivariate Probit model with spatially mediated peer effects (15-mile radius peer group)
***, **, * indicate a statistical significance at 1%, 5%, and 10%, respectively.
Table 5. Marginal effects from the multivariate Probit model with spatially mediated peer effects (30-mile radius peer group)
***, **, * indicate a statistical significance at 1%, 5%, and 10%, respectively.
Results for diverse crop rotation in Tables 2 and 3 show that among the spatially mediated peer effect variables, only the percentage of adopters in a 30-mile radius has a positive and statistically significant effect on the likelihood of adoption of diverse crop rotation. Similar to conservation tillage, the adoption of diverse crop rotation is capital intensive as it might require specialized planting equipment for different crop types and it is knowledge-intensive as it requires knowledge to manage more crop types. Hence, as the percentage of adopters increases in the neighborhood, it might reduce the learning costs associated with switching to the new practice of growing more crop types and thus the adoption costs. The non-significance of the peer effect variable in the 15-mile radius (Table 2) and 50-mile radius (Table S2) peer-group regressions and the significance of the peer effect variables in the 30-mile radius peer-group regression may suggest the challenges of defining a peer group based on the type of practice, especially if policy makers want to leverage spatially mediated peer effects to scale up the adoption of technologies or practices (Sampson and Perry, Reference Sampson and Perry2019).
Additionally, the overall economic success of diverse crop rotation will also depend on market access (e.g., access to quality seeds and output market [ethanol and commodity market]). Because of the statistically significant correlation between the spatial peer effects variable and the distance to the nearest ethanol plant variable (ethanolplant_distance_miles), we have estimated the multivariate probit model including only ethanolplant_distance_miles and not spatial peer effect variables for diverse crop rotation (Table S3). It is evident from Table S3, as the distance to the ethanol plant increases the likelihood of adoption of diverse crop rotation also increases. The marginal effect coefficients presented in Table S4, show that one-unit increase in the distance to ethanol plants (in miles) increases the likelihood of adoption of diverse crop rotation by 0.006. The marginal effect of ethanolplant_distance_miles (0.006 in Table S4) on diverse crop rotation adoption is higher than the marginal effect of the spatial peer effect variable for a 30-mile radius (0.004) in Table 5. Findings from the study on the economic significance of spatial peer effect variables (and its sensitivity to peer-group definition) and the variable capturing the localized impact of ethanol plants suggest that in addition to peer effects, the location of the farm relative to an ethanol plant is an important determinant on the likelihood of diverse crop rotation adoption.
It has been reported previously that profitability from the use of cover crops depends on-farm and farmer characteristics and external factors such as weather (Bergtold et al., Reference Bergtold, Ramsey, Maddy and Williams2017). Given this, it is expected that there will be greater learning costs associated with cover crops adoption. However, the coefficients of spatial peer effect variables for a 15-mile radius and 30-mile radius are not statistically significant for the adoption of cover crops in Tables 2 and 3. Hence, results for cover crops from Tables 2 and 3 are very similar to those in Table S1 without spatial peer effects. An examination of adopters of cover crops in the study sample shows that about 47% of adopters have used it for less than 3 years, 23% have used it for the last 3–5 years, and 30% have used it for more than 5 years. The corresponding numbers for conservation tillage are 9%, 14%, and 77% for less than 3 years, 3–5 years, and more than 5 years, respectively and 19%, 12%, and 68%, respectively for diverse crop rotation. As per these survey findings, cover crops are a new conservation practice compared with conservation tillage and diverse crop rotation, which are more established practices in the region. It generally takes time for economic and environmental benefits of conservation practices to become evident, the shorter usage duration among cover crops’ adopters might partially explain the absence of statistically significant peer effect. However, as per the results in Table S2 in SM, the coefficient of spatial peer effect variable for a 50-mile radius has a negative and statistically significant effect on the likelihood of adoption of cover crops. The negative and statistically significant effect of the 50-mile radius peer effect in the adoption of cover crops is surprising. It has to be noted here that unlike values in Tables 2 and 3, the inclusion of a 50-mile radius spatial peer effect variable impacted the statistical significance of crop district dummy variables 30, 60, and 90. This result supports our assumption earlier that the selection of a larger boundary to define spatial peer effect may affect the spatial heterogeneity variables such as crop district dummies. The inclusion of crop district dummies along with spatial peer effect variables with lower geographic boundaries such as a 15-mile radius and 30-mile radius will enable us to examine the effect of more local spatial peer effects after accounting for crop district-level spatial heterogeneity. Results from the multivariate probit model for cover crops with a 50-mile radius spatial peer group support our selection of lower geographic boundaries for spatial peer effects and also highlight the challenges of defining a spatial peer group.
In addition to the spatial peer effects variables, we have included an organizational network index variable and family network index variables in our analyses to control for the effect of social networks as information sources on adoption decisions. As per the results in Tables 4 and 5, one-unit increase in the organizational network index variable will increase the likelihood of adoption of cover crops by about 0.20. Overall, results from the study suggest that more than spatial peer effects, leveraging organizational networks are effective in scaling up the adoption of cover crops.
Results in Tables 2 and 3 also show that spatial fixed effects captured by the crop district dummies are important in the adoption decision of conservation tillage, while no such effect is evident for cover crops and diverse crop rotation. Our results support previous findings that conservation tillage is more dominant in drier regions, as conservation tillage in areas with higher moisture content poses challenges for early planting in wetter areas (Claassen et al., Reference Claassen, Bowman, McFadden, Smith and Wallander2018).
Regarding other control variables, our results show that farmers with large farm sizes are more likely to adopt conservation practices such as cover crops and diverse crop rotation as more acres might increase the risk-bearing abilities of farmers. However, the effect of age on the likelihood of adoption varies between practices. While older farmers are more likely to adopt conservation tillage and younger farmers are more likely to adopt cover crops, no such effect is present for diverse crop rotation. As per our results, farmers who own pasture acres are more likely to adopt cover crops and diverse crop rotation while no such effect is present for conservation tillage. Our results confirm previous findings that for producers with pasture acres integrating cover crops with livestock is a practice with minimal risk that has the potential to benefit the whole farm economically and environmentally (Kolady and Deutz, Reference Kolady and Deutz2017).
Results from the study show that overall farmers with a more favorable perception of the environmental benefits of a practice are more likely to adopt that conservation practice (Bergtold et al., Reference Bergtold, Ramsey, Maddy and Williams2017; Delgado et al., Reference Delgado, Dillon, Sparks and Essah2007; Dessart, Barreiro-Hurlé, and van Bavel, Reference Dessart, Barreiro-Hurlé and van Bavel2019). Producers’ perception of the benefits and costs of a conservation practice may change as their neighbor’s perceptions and adoption behavior change. Additionally, producers’ perceptions may also change as part of a general shift in local culture and social norms. Findings from the study show that after controlling for spatial peer effects and spatial heterogeneity, producers with more positive perceptions of the environmental benefits of a conservation practice are more likely to adopt it. Investigating the determinants of producers’ perceptions of conservation practices is beyond the scope of this study.
6. Conclusion and Policy Implications
Our objective in this study was to isolate the influence of spatially mediated peer effects on farmers’ conservation practice adoption decisions from spatial heterogeneity and other socioeconomic and demographic characteristics. We find that although not substantial in magnitude, spatially mediated peer effects are important in the adoption of conservation tillage and diverse crop rotation. The importance of spatially mediated peer effects in the adoption of conservation tillage and diverse crop rotation suggests opportunities for leveraging such effects to increase the adoption of these practices.
Policy makers can develop practice-specific spatially targeted policies and programs that reduce financial incentives/subsidies in areas with a higher percentage of adoption and re-direct the resources to areas with lower adoption rates. Additionally, extension and outreach efforts could leverage spatial peer networks to increase the awareness about the costs and benefits of the adoption of conservation tillage and diverse crop rotation to increase the adoption of these practices. Local conservation efforts (demonstration sites and field days) could focus on working farms as opposed to research plots and federal programs could encourage conservation research on farmers’ fields by compensating producers who assist with conservation research and education (Singh et al., Reference Singh, McGowan, Ulrich-Scahd, O’Doneell, Klotz and Prokopy2018). Extension and outreach efforts could use similar nudges that provide information on the extent of adoption of the selected practice locally and its environmental benefits to target neighborhood networks to effectively induce behavioral changes. The statistical and economic significance of the distance to ethanol plants on the likelihood of adoption of diverse crop rotation suggests that scaling up the practice of diverse crop rotation in areas closer to the ethanol plants will be a challenge. Findings from the study imply that more concerted efforts and programs that not only leverage peer effects to nudge producer perception toward diverse crop rotation, but also targeting producers with large farms and livestock might be effective in scaling up the practice of diverse crop rotation.
As per the study, spatial peer effects are not statistically significant in the adoption of cover crops. Unlike conservation tillage and diverse crop rotation that are more established practices in the region, cover crops are relatively less established as seen in the short duration of usage by most of the current adopters. The non-significance of peer effects may be because due to the shorter duration of the usage of cover crops by adopters in the region, the visible benefit of cover crops on adopted farmland is still lacking to induce behavior changes in other producers. This is an aspect that needs to be investigated in future research. It is evident from this study that, other than farmer characteristics (age) and farm characteristics (large farms and livestock operation), organizational networks and perceptions of environmental benefits are the key determinants of the adoption of cover crops. A one-unit increase in the organization network index will increase the likelihood of adoption of cover crops by 0.20 units and one-unit increase in the environmental perception index will increase the likelihood of adoption by 0.94 units. The statistical and economic significance of the organizational network index and the environmental perception index implies that targeted programs and investments that impact organizational networks and perceptions will be effective to scale up the adoption of cover crops. Given that the use of cover crops is promoted not only to improve soil health but also to improve water quality, findings from the study imply the importance of developing programs that leverage organizational networks to influence producers’ perceptions toward cover crops to scale up its adoption and targeting these efforts toward younger producers and those with large farm size and livestock production. However, these efforts may not remove the economic uncertainties associated with growing cover crops. Unlike in the case of spatial peer effects, where a producer may be able to observe field performance of cover crops in a neighbor’s field and learn from it, organizational networks do not provide the opportunity to learn by field observation. In this context, the continuation of cost-share/subsidy programs at the federal and state levels might help in scaling up the adoption of cover crops. Previous studies have shown that the uncertainty over economic benefits (which depend on the weather, farm characteristics, management practices, cropping systems, input costs, etc.) is one of the reasons for the overall low adoption rates for cover crops (Bergtold et al., Reference Bergtold, Ramsey, Maddy and Williams2017). Cost-share programs reduce the profitability risk associated with the cover crops and incentivize producers to take the risk of growing cover crops even when there is uncertainty over economic benefits (Dunn et al., Reference Dunn, Ulrich-Schad, Prokopy, Myers, Watts and Scanlon2016; Rausch, Reference Rausch2017).
The study also shows that the inclusion of spatially mediated peer effects changes the statistical significance levels of demographic, socioeconomic, and spatial fixed effect variables in adoption decisions. Results from the study suggest the importance of accounting for spatially mediated peer effects in the analysis of adoption decisions to avoid biased estimates for other control variables. Overall, results from the study provide insights for policy makers and extension personnel in intense agricultural production areas to devise a mix of targeted policies, programs, and outreach efforts to scale up the adoption of conservation practices. The study’s findings support the need for a mix of policies and programs that leverage spatial peer effects where it is effective and resorting to other interventions in other cases.
We recommend that future studies use longitudinal study designs to gain insightful information about spatially mediated peer effects over time, particularly to examine whether spatial peer effects have changed over time. With the prevalence of social media and associated technologies, peer groups are increasingly less restricted by physical proximity. This is an aspect that needs to be investigated in future research.
Supplementary Material
To view supplementary material for this article, please visit https://doi.org/10.1017/aae.2020.24.
Financial Support
The authors acknowledge the financial support from South Dakota Corn Utilization Council and USDA HATCH project (accession number 1012620) for the study.
Conflicts of Interest
None.


 Open access