


1. Introduction
This study examines the aggregate structural changes of US dairy farms from 1987 to 2017. We analyze dairy farm expansion, entry, and exits at the national and state levels. In 2019, value added from the US dairy industry accounted for about 23% of the livestock sector’s contribution to the national economy (United States Department of Agriculture-Economic Research Service [USDA-ERS], 2020). The total value added to the US economy from the dairy industry was $40 billion in 2019, with milk production at 218.4 billion pounds (ERS 2020: National Agricultural Statistical Service [NASS], 2020). Larger operations contribute most to the value the industry adds to the economy. The industry continues to consolidate towards fewer and larger dairies. Consolidation favors larger operations because capital-intensive technologies, such as automated parlors and other advancements, replace labor. In 2010, operations with more than 1,999 milk cows produced 10 hundredweight (cwt) of milk per labor hour compared to 2–4 cwt of milk per labor hour on farms with herds of 50–500 head (MacDonald, Cessna, and Mosheim, Reference MacDonald, Cessna and Mosheim2016).
The number of small- and medium-sized operations continues to trend downward as the number of large-sized dairies steadily increases (Figure 1). The USDA reported that between 2007 and 2018, the number of licensed dairy farms declined from 59,130 to 37,468, while the average number of cows per dairy increased from 155 to 251 head. Small dairies continue to struggle as they compete with larger operations, as evidenced by their higher exit rates (Feng et al., Reference Feng, Hennessy, Jia, McKendree and Wolf2018). The rate of decline remains highest for operations with 20–49 and 50–99 milk cows. Dairies with 1,000–1,999 head reported average costs of production of $18.58 per cwt in 2017, a cost that is 16% lower than the average of farms with 200–499 head and 30% below the cost for farms with 100–199 head (NASS, 1987–2017).

Figure 1. Trends in the dairy sector, 1987–2017.
Changes in consumer preferences for dairy and nondairy products evolve faster than conventional dairy markets can respond (Badruddoza, Carlson, and McCluskey, Reference Badruddoza, Carlson and McCluskey2019; Norris and Cranfield, Reference Norris and Cranfield2018). Consumer demand for nondairy substitutes has increased in recent years at the expense of the market share conventional milk products once commanded (Yang and Dharmasena, Reference Yang and Dharmasena2019). Reduced demand for milk has led to oversupply and lower milk prices (MacDonald, Cessna, and Mosheim, Reference MacDonald, Cessna and Mosheim2016). Responding to chronically lower prices, some dairy operators have submitted claims of unfair pricing against processors (Bolotova, Reference Bolotova2019).
Mark et al. (Reference Mark, Kenneth, Cessna and Dohlman2016) summarize in detail the differences between MPP and MILC legislation. In response to prevailing market conditions, state and federal legislation, dairy operators, and dairy industry proponents have supported policy measures to address market problems caused by oversupply of, and weakened demand for, milk. In 2002, the USDA established the Milk Income Loss Contract (MILC) program through the Farm Security and Rural Investment Act (Mark et al., Reference Mark, Kenneth, Cessna and Dohlman2016). MILC legislation provided operators revenue protection through direct payments when milk prices fell below target levels. The Agricultural Act of 2014 replaced the MILC with the Margin Protection Program for Dairy Producers (MPP). The MPP offers dairies protection when the national average margin falls below a level selected by the dairy farmer. The MPP targets income-over-feed-cost margin protection. Newton, Thraen, and Bozic (Reference Newton, Thraen and Bozic2015) found that, due to the absence of adjusted gross income or production eligibility constraints, a significant portion of MPP benefits eventually accrue to a handful of larger dairy farms, which could further increase the exit rate of small- and medium-sized dairies.
Exit rates vary according to a state’s comparative advantage with respect to milk production, farm adaptability to an industry favoring economies of size, and consumer demand for alternative or plant-based dairy products. Some state Senators and representatives have introduced legislation to the US Congress to address the decline in dairy operations. In Wisconsin, 8%, or nearly 700 of the state’s dairy farmers, exited in 2018 for economic reasons (Quirmbach, Reference Quirmbach2019). In 2019, Senator Baldwin of Wisconsin introduced the Defending Against Imitations and Replacements of yogurt, milk, and cheese to Promote Regular Intake of Dairy Everyday Act (Ghazaryan, Bonanno, and Cho, Reference Ghazaryan, Bonanno and Cho2019). The policy objective was to protect the dairy industry from the expansion of nondairy product markets. Still, in Kentucky, there were 600 dairy farms at the beginning of 2018 with Grade A permits, but that number dropped to 513 by 2019 (Estep, Reference Estep2018). Ohio’s dairy farms also continue to exit at super-normal rates spurred by chronically low milk prices (DeMartini, Reference DeMartini2018).
These examples highlight the importance of understanding how dairy entry, size transition, and exits respond to federal policies encouraging industry preservation and expansion. We hypothesize that industry dynamics vary across states; thus, we expect that policies aimed towards supporting the dairy sector have differential effects on operation size, growth, and exit rates. It is likely that the effectiveness of interventions designed to slow exit rates or to encourage growth varies, depending on size economies but also differences in a state’s comparative advantage with respect to milk production. This analysis aims to quantify changes in entry-exit rates at the state and national levels, focusing on industry structure and change before and after the introduction of the 2002 MILC legislation. We model industry dynamics as a first-order Markov process. The transition probabilities are determined using a cross-entropy optimization procedure. These probabilities are used to test for industry structural changes at the state and national levels.
2. Data
Counts of dairy herd size classes are from the USDA’s Census of Agriculture, 1987–2017 (Ag Census, 2017). Every 5 years, the US Census of Agriculture categorizes dairy operations into eight herd size classes: 1–9, 10–19, 20–49, 50–99, 100–199, 200–499, 500–999, and 1,000 or more milk cows (Table 1). From 1987 to 2012, exit rates were highest for the 20–49 and 50–99 size classes. The exit rate for these operations has slowed since the 2012 Census of Agriculture likely because of attrition. Exits are more likely in size classes with relatively more operations.
Table 1. US dairy farms and herd size categories, 1987–2017

Note: Values inside the parentheses indicate the percentage of farms in a category.
Source: USDA NASS, Census of Agriculture, 1987–2017. (https://www.nass.usda.gov/AgCensus/index.php)
Variables hypothesized to correlate with the likelihood of an operation exits, increases, or decreases herd size include dairy production margins, milk production per cow, and the share of consumer expenditures on dairy products (Table 2). The expenditure share on dairy consumption is a proxy for changes consumer demand; milk production per cow represents changes in genetics, breeding, feed, and management, and the margin is a proxy for the capital and labor efficiency as reflected by changes in feed costs.
Table 2. Variables hypothesized to correlate with dairy size transitions and exits (means for all lower 48 states)
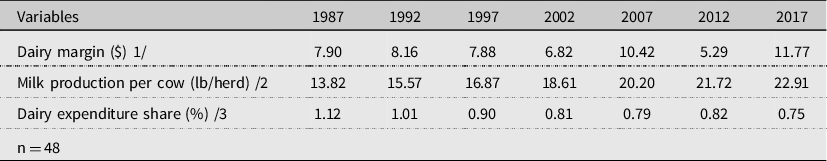
Notes: Entries are aggregated values. 1/ Current dollars, each year. Dairy margin was calculated by subtracting the cost of feed from the real milk price of each year. 2/ Statistics reported in Table 2 are averages over all lower 48 US states. 3/ Dairy expenditure share is calculated by dividing dairy product expenditures by total annual consumer expenditures.
Sources: USDA NASS Agricultural Prices Report (1987–2017); USDA AMS Mailbox Milk Price Report (1987–2017); WAOB World Agricultural Supply and Demand Estimates Report (1987–2017); USDA NASS Milk Production Report (1987–2017); BLC Consumer Expenditure Survey (1987–2017) (https://www.bls.gov/cex/).
The actual dairy production margin (ADPM) is calculated by subtracting the cost of alfalfa, soybeans, and hay from the milk price. Higher margins indicate that firms in the industry are efficient with respect to their allocation of capital, labor, and other productive inputs. The Agricultural Marketing Service’s (AMS) Mailbox Milk Price Report (U.S Department of Agriculture, Agricultural Marketing Service, 1987–2017) reports regional mailbox-milk prices for each state. State corn and alfalfa hay prices are from the National Agricultural Statistics Service (NASS) Agricultural Prices Report (NASS, 1987–2017). Soybean meal prices were unavailable for each state. The World Agricultural Outlook Board’s (WAOB) World Agricultural Supply and Demand Estimates Report (WAOB, 1987–2017) reports soybean meal prices at the national level, and these annual prices were used to proxy the soybean meal price. As an example, the corn price per bushel multiplied by 1.0728, plus the soybean meal price per ton multiplied by 0.00735, and the alfalfa hay price per ton multiplied by 0.0137, is all subtracted from the monthly milk price per cwt released by ADPM. These multipliers were used in the 2014 Agriculture Act and reflect the ration quantities of these ingredients for each animal group on a typical dairy (Agricultural Act of 2014). Monthly ADPM values are lagged 5-year averages and correspond with the quinquennial Agricultural Census years, 1987–2017. For example, the lagged ADPM corresponding with 2012 dairy size class counts is the average of ADPM’s from 2007 to 2012. All prices are in 2017 current dollars.
Milk production per cow (pounds/head) for each state is from NASS’s Milk Production Report (NASS, 1987–2017). This is a proxy variable for innovations in genetics, managerial practices, and other technology changes during the 1987–2017 period.
Expenditure shares on milk were unavailable for each state. The Bureau of Labor Statistics’ Consumer Expenditure Survey (BLS, 1987–2017) reports total annual consumer expenditures and dairy product expenditures. The Consumer Expenditure Survey identifies four statistical regions: the Northeastern (CT, MA, ME, NH, NJ, NY, PA, RI, VT), Midwestern (IA, IL, IN, KS, MI, MN, MO, ND, NE, OH, SD, WI), Southern (AL, AR, DC, DE, FL, GA, KY, LA, MD, MS, NC, OK, SC, TN, TX, VA, WV), and Western states (AK, AZ, CA, CO, ID, MT, NM, NV, OR, UT, WA, WY) located in each statistical region. The dairy expenditure share is calculated by dividing consumer expenditures on dairy products by total annual consumer expenditures. Expenditure shares are calculated and aggregated for each region and then apportioned to states in that region.
3. Methods and Procedures
We model dairy sector transition dynamics as a first-order Markov process. Padberg (Reference Padberg1962), Williams and Alexander (Reference Williams and Alexander1963), and Krenz (Reference Krenz1964) are early studies that analyzed agricultural sector industry dynamics as first-order Markov processes. Stavens and Stanton (Reference Stavins and Stanton1980) provided an extensive list of Markov transition probability applications in agricultural economics. Chavas and Magand (Reference Chavas and Magand1988) estimated the aggregate effects of scale economies, sunk costs, and milk prices on US dairy size and distribution using first-order Markov models. Zepeda (Reference Zepeda1995a, Reference Zepeda1995b) used transition probabilities to examine the effects of milk prices and technology on the size distribution of Wisconsin dairy farms. Rahelizatovo and Gillespie (Reference Rahelizatovo and Gillespie1999) estimated the effects of macroeconomic variables, agricultural policies, and technological change on Louisiana’s dairy farm structure using transition probabilities. Stokes (Reference Stokes2006) analyzed the effects of milk prices, cow productivity, policy, and land value on the structure of Pennsylvania’s dairy sector as a first-order Markov process.
The above studies estimated transition probabilities using nonlinear seemingly unrelated regression, maximum likelihood, or maximum entropy. Our approach extends Stokes (Reference Stokes2006) and Arfa et al. (Reference Arfa, Daniel, Jacquet and Karantininis2015)’s generalized cross-entropy (GCE) procedure. GCE procedures address ill-posed econometric problems such as the one encountered in this analysis (Golan, Reference Golan2018). For example, there are 81 transition probabilities to determine for each state, but there are only seven periods available for analysis. We modify the previous approaches that used GCE in three ways. First, we test for industry structural change by comparing the transition dynamics in the pre- and post-2002 years. We use 2002 as a reference year because it corresponds with MILC legislation. The statistical procedure tests if the transition probabilities governing industry entry/size/exit dynamics changed after 2002, with particular focus on the change in exit probabilities for each dairy size class. This is a one-tailed test, with the alternative hypothesis that exit probabilities corresponding with a dairy size class decreased following MILC legislation. We use a one-tailed test because we are interested in detecting whether post-2002 legislation was industry preserving. Second, we hypothesize that industry dynamics vary by state, as evidenced by changes in the transition probabilities. Separate models are solved for each of the lower 48 US states, which are compared with the transition probabilities estimated using the national aggregate of all US dairies, 1987–2017, as a reference. Third, we use the properties of each state’s transition probabilities to determine long-term exit likelihoods and the number of periods until a dairy in a size class exits the industry.
3.1. Model Assumptions
Let
 ${y_{k,t}}$
denote the proportion of dairies in herd size classes
${y_{k,t}}$
denote the proportion of dairies in herd size classes
 $k$
= 1 to 9, 10 to 19,…, 1,000+ head, and exiting dairies observed in period
$k$
= 1 to 9, 10 to 19,…, 1,000+ head, and exiting dairies observed in period
 $t$
= 1987, 1992,…2017. A first-order Markov process determining the proportion of dairies occupying state
$t$
= 1987, 1992,…2017. A first-order Markov process determining the proportion of dairies occupying state
 $k$
(
$k$
(
 $j$
aliases
$j$
aliases
 $k$
) in the next period is
$k$
) in the next period is
 $$\;{y_{k,t}} = \mathop \sum \nolimits_{j = 1}^K {p_{jk}} \cdot {y_{j,t - 1}}\;\forall \;k,t$$
where the matrix
 ${\bf{p}}$
are unknown transition probabilities restricted as
${\bf{p}}$
are unknown transition probabilities restricted as
 $\mathop \sum \limits_{k = 1}^K {p_{jk}} = 1$
and
$\mathop \sum \limits_{k = 1}^K {p_{jk}} = 1$
and
 $0 \le {p_{ij}} \le 1$
. Equation (1) assumes industry dynamics are determined by the transition probabilities and previous period shares. Appending an unobserved noise component to equation (1) yields a system of stochastic sample moment constraints
$0 \le {p_{ij}} \le 1$
. Equation (1) assumes industry dynamics are determined by the transition probabilities and previous period shares. Appending an unobserved noise component to equation (1) yields a system of stochastic sample moment constraints
 $${y_{k,t}} = \mathop \sum \nolimits_{j = 1}^K {p_{jk}} \cdot {y_{j,t - 1}} + {u_{kt}}\;\forall \;k,t$$
with the expected value of the error term
 ${u_{k,t}}$
zero and a finite variance
${u_{k,t}}$
zero and a finite variance
 $\sigma _{{y_k}}^2$
.
$\sigma _{{y_k}}^2$
.
The error components are modeled as a convex combination of unobserved weights (
 ${\bf{w}}$
) and an exogenous support vector (
${\bf{w}}$
) and an exogenous support vector (
 ${\bf{v}}$
), such that
${\bf{v}}$
), such that
 ${u_{kt}} = \mathop \sum \limits_l {v_l} \cdot {w_{klt}}$
, with
${u_{kt}} = \mathop \sum \limits_l {v_l} \cdot {w_{klt}}$
, with
 $\mathop \sum \limits_l {w_{klt}} = 1$
and
$\mathop \sum \limits_l {w_{klt}} = 1$
and
 $0\; \le {w_{klt}} \le 1$
(Golan, Judge, and Miller, Reference Golan, Judge and Miller1996). We use Pukelsheim (Reference Pukelsheim1994)’s 3-sigma rule to define the error support limits of
$0\; \le {w_{klt}} \le 1$
(Golan, Judge, and Miller, Reference Golan, Judge and Miller1996). We use Pukelsheim (Reference Pukelsheim1994)’s 3-sigma rule to define the error support limits of
 ${\bf{v}}$
by assigning the standard deviations of the shares of dairies in a size class to the support space. For example, using the 3-sigma rule, the error support is
${\bf{v}}$
by assigning the standard deviations of the shares of dairies in a size class to the support space. For example, using the 3-sigma rule, the error support is
 ${v_l} = \left[ { - 3 \cdot {\sigma _{{y_k}}},\; - 1.5 \cdot {\sigma _{{y_k}}},\;\;0,\;1.5 \cdot {\sigma _{{y_k}}},\;3 \cdot {\sigma _{{y_k}}}} \right]$
, with
${v_l} = \left[ { - 3 \cdot {\sigma _{{y_k}}},\; - 1.5 \cdot {\sigma _{{y_k}}},\;\;0,\;1.5 \cdot {\sigma _{{y_k}}},\;3 \cdot {\sigma _{{y_k}}}} \right]$
, with
 ${\sigma _{{y_k}}}$
the standard deviation of the share of dairies occupying a size class from 1987 to 2017. The support
${\sigma _{{y_k}}}$
the standard deviation of the share of dairies occupying a size class from 1987 to 2017. The support
 ${\bf{v}}$
therefore varies across states and dairy size classes.
${\bf{v}}$
therefore varies across states and dairy size classes.
Conditioning equation (2) on variables hypothesized to affect the transition probabilities, the sample moments are
 $$\mathop \sum \nolimits_t {{\bf{x}'}_t}\left[ {{y_{kt}} - \mathop \sum \nolimits_{j = 1}^K {p_{jk}} \cdot {y_{j,t - 1}} - \mathop \sum \nolimits_l {v_l} \cdot {w_{klt}}} \right] = 0\;\forall \;n,k$$
where
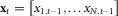 ${{\bf{x}}_t} = \left[ {{x_{1,t - 1}}, \ldots {x_{N,t - 1}}} \right]$
is a vector of
${{\bf{x}}_t} = \left[ {{x_{1,t - 1}}, \ldots {x_{N,t - 1}}} \right]$
is a vector of
 $n$
exogenous covariates with (
$n$
exogenous covariates with (
 ${\bf{p}}$
,
${\bf{p}}$
,
 ${\bf{w}}$
) solving the moment equations (Miller and Judge, Reference Miller and Judge2015).
${\bf{w}}$
) solving the moment equations (Miller and Judge, Reference Miller and Judge2015).
The transition probabilities and noise component weights solve a constrained GCE objective. The GCE Lagrangean is
 $$\eqalign{& {\min}_{{{\bf{1}} \ge \left( {{\bf{p}},\;{\bf{w}}} \right) \ge {\bf{0}},\lambda ,\delta ,\mu }}L = \sum\nolimits_j {} \sum\nolimits_k {{p_{jk}}} \ln \left( {{p_{jk}}/{q_{jk}}} \right) + \sum\nolimits_t {} \sum\nolimits_k {} \sum\nolimits_l {{w_{klt}}} \ln \left( {{w_{klt}}/w_{klt}^0} \right) \cr
& \,\,\,\,\,\,\,\,\,\,\,\,\,\,\,\,\,\,\,\,\,\,\,\,\,\,\,\,\,\,\,\,\,\,\,\,\,\, + \sum\nolimits_k {} \sum\nolimits_n {{\lambda _{nk}}} \sum\nolimits_t {{x_{nt}}} \left[ {{y_{kt}} - \sum\nolimits_{j = 1}^K {{p_{jk}}} \cdot{y_{j,t - 1}} - \sum\nolimits_l {{v_l}} \cdot{w_{klt}}} \right] \cr
& \,\,\,\,\,\,\,\,\,\,\,\,\,\,\,\,\,\,\,\,\,\,\,\,\,\,\,\,\,\,\,\,\,\,\,\,\,\, + \sum\nolimits_j {{\mu _j}} \left[ {1 - \sum\nolimits_k {{p_{jk}}} } \right] + \sum\nolimits_t {} \sum\nolimits_k {{\delta _{tk}}} \left[ {1 - \sum\nolimits_l {{w_{klt}}} } \right] \cr} $$
$$\eqalign{& {\min}_{{{\bf{1}} \ge \left( {{\bf{p}},\;{\bf{w}}} \right) \ge {\bf{0}},\lambda ,\delta ,\mu }}L = \sum\nolimits_j {} \sum\nolimits_k {{p_{jk}}} \ln \left( {{p_{jk}}/{q_{jk}}} \right) + \sum\nolimits_t {} \sum\nolimits_k {} \sum\nolimits_l {{w_{klt}}} \ln \left( {{w_{klt}}/w_{klt}^0} \right) \cr
& \,\,\,\,\,\,\,\,\,\,\,\,\,\,\,\,\,\,\,\,\,\,\,\,\,\,\,\,\,\,\,\,\,\,\,\,\,\, + \sum\nolimits_k {} \sum\nolimits_n {{\lambda _{nk}}} \sum\nolimits_t {{x_{nt}}} \left[ {{y_{kt}} - \sum\nolimits_{j = 1}^K {{p_{jk}}} \cdot{y_{j,t - 1}} - \sum\nolimits_l {{v_l}} \cdot{w_{klt}}} \right] \cr
& \,\,\,\,\,\,\,\,\,\,\,\,\,\,\,\,\,\,\,\,\,\,\,\,\,\,\,\,\,\,\,\,\,\,\,\,\,\, + \sum\nolimits_j {{\mu _j}} \left[ {1 - \sum\nolimits_k {{p_{jk}}} } \right] + \sum\nolimits_t {} \sum\nolimits_k {{\delta _{tk}}} \left[ {1 - \sum\nolimits_l {{w_{klt}}} } \right] \cr} $$
where the first line is a cross-entropy objective function; the second line is the
 $n\; \times $
 $k$
set of moment constraints of equation (3), and the last line is the additivity constraints for the transition probabilities and error support weights,
$k$
set of moment constraints of equation (3), and the last line is the additivity constraints for the transition probabilities and error support weights,
 $\mathop \sum \limits_{k = 1}^K {p_{jk}} = 1$
and
$\mathop \sum \limits_{k = 1}^K {p_{jk}} = 1$
and
 $\mathop \sum \limits_l {w_{klt}} = 1$
, respectively. The variables (
$\mathop \sum \limits_l {w_{klt}} = 1$
, respectively. The variables (
 ${\bf{\lambda }},{\bf{\mu }},{\bf{\delta }}$
) are Lagrange multipliers that correspond with their respective constraints. In total, there are 453 variables in (
${\bf{\lambda }},{\bf{\mu }},{\bf{\delta }}$
) are Lagrange multipliers that correspond with their respective constraints. In total, there are 453 variables in (
 ${\bf{p}},{\bf{w}},\;{\bf{\lambda }},{\bf{\mu }},{\bf{\delta }}$
) that solve the system.
${\bf{p}},{\bf{w}},\;{\bf{\lambda }},{\bf{\mu }},{\bf{\delta }}$
) that solve the system.
The parameters in the matrix
 ${\bf{q}}$
are an exogenous prior (or reference) distribution for the transition probabilities (discussed below). We set the prior distribution for the error weights to
${\bf{q}}$
are an exogenous prior (or reference) distribution for the transition probabilities (discussed below). We set the prior distribution for the error weights to
 $w_{klt}^0 = {1 \over 5}$
(a uniform support). The GCE function was minimized using GAMS 23.0.2 (Brooke et al., Reference Brooke, Kendrick, Meeraus and Raman2005).
$w_{klt}^0 = {1 \over 5}$
(a uniform support). The GCE function was minimized using GAMS 23.0.2 (Brooke et al., Reference Brooke, Kendrick, Meeraus and Raman2005).
The cumulative effect of a percentage change in a variable on the number of dairies entering a size category in period
 $t$
beginning in size class
$t$
beginning in size class
 $j$
is
$j$
is
 $$E_{j,{x_n}}^{{y_t}} = \;{{\partial {{\bar y}_{jt}}} \over {\partial {{\bar x}_n}}}\cdot{{{{\bar x}_n}} \over {{{\bar y}_{jt}}}} = {{{{\bar x}_n}} \over {{{\bar y}_{jt}}}}\cdot\sum\limits_j {\left[ {{{\hat p}_{jk}}\cdot\bar y_{j,t - 1}^2\left( {{{\hat \lambda }_{nk}} - \sum\limits_k {{{\hat p}_{jk}}} \cdot{{\hat \lambda }_{nk}}} \right)} \right]} $$
where overbars indicate period averages and the circumflexed variables are GCE-minimizing Lagrange multipliers. The term following the summation operator is the partial differentiation of equation (1). This equation measures the effect of a unit change in the number of dairies transitioning between states
 $j$
and
$j$
and
 $k$
resulting from a 1-unit change in
$k$
resulting from a 1-unit change in
 ${\bf{x}}$
.
${\bf{x}}$
.
3.2. Industry Transition Reference Distributions
It is unlikely that a dairy with a herd size of 20–49 cows would increase its herd to more than 1,000 head in the next period. However, an operation in this size class could increase its herd to the next highest size class (50–99) or remove enough cows to reclassify the operation into the 10–19 herd size class. Alternatively, in the next period, an operation could remain in the initial size class of 20–49 or exit the industry. These assumptions enter the problem as priors through a reference distribution of transition probabilities. The GCE objective solves for a matrix of transition probabilities
 ${\bf{p}}$
such that the distance between its reference distribution is minimized. In other words, the matrix elements of the estimated transition probabilities are conditioned on prior beliefs that characterize the possible states an operation can occupy from one period to the next. The priors operate as supports for the transition probabilities, shrinking the estimated transition probabilities towards the support. The influence of the reference distribution on the transition probabilities increases when data are limited.
${\bf{p}}$
such that the distance between its reference distribution is minimized. In other words, the matrix elements of the estimated transition probabilities are conditioned on prior beliefs that characterize the possible states an operation can occupy from one period to the next. The priors operate as supports for the transition probabilities, shrinking the estimated transition probabilities towards the support. The influence of the reference distribution on the transition probabilities increases when data are limited.
In a 1964 study of North Dakota farm size transition, Krenz (Reference Krenz1964) assumed that the largest size class of 1,000 or more acres was an absorbing state and that farms would only transition to larger size classes. Studies modifying Krenz’s priors include Stavins and Stanton (Reference Stavins and Stanton1980) and Keane (Reference Keane1991). Zepeda (Reference Zepeda1995b) allowed large farm sizes to shift one-step down and but not medium-sized farms. Karantininis (Reference Karantininis2002) restricted the lower and upper off-diagonal elements of the transition matrices to zero, thereby permitting dairies to shift one-step up or down, or remain in the same size class. Tonini and Jongeneel (Reference Tonini and Jongeneel2009) and Jongeneel et al. (Reference Jongeneel, Longworth and Huettel2005) assumed that dairies were more likely to remain in their current period observed size class, less likely to transition one size class up or down, and never transitioned more than one-step past their current classification. In their study of dairy entry-exit in Poland, Tononi and Jongegeel (Reference Tonini and Jongeneel2009) concluded from their literature review that, on average, a dairy remains in a current size class between periods with a 0.83 probability, but that size class persistence was lower for smaller-sized operations.
We adapted Arfa et al.’s (Reference Arfa, Daniel, Jacquet and Karantininis2015) priors to the USDA’s dairy size classes (Table A1). For details on their aggregation methods, see Arfa et al. (Reference Arfa, Daniel, Jacquet and Karantininis2015). For the smallest size class (size class “1” = 1–9 head), the row of priors was
 ${q_{1,1}} = 0.82$
,
${q_{1,1}} = 0.82$
,
 ${q_{1,2}} = 0.07$
,
${q_{1,2}} = 0.07$
,
 $\;{\rm{\;}}{q_{1,{\rm{exit}}}} = 0.11$
, with the remaining row cells set to 1e-6. For the largest operations (size class “8” = 1,000+ head), the priors were
$\;{\rm{\;}}{q_{1,{\rm{exit}}}} = 0.11$
, with the remaining row cells set to 1e-6. For the largest operations (size class “8” = 1,000+ head), the priors were
 ${q_{8,7}} = 0.07$
,
${q_{8,7}} = 0.07$
,
 ${q_{8,8}} = 0.82$
, and
${q_{8,8}} = 0.82$
, and
 ${q_{8,{\rm{exit}}}} = 0.11$
. For all other size classes,
${q_{8,{\rm{exit}}}} = 0.11$
. For all other size classes,
 ${q_{j - 1,k}} = 0.07$
,
${q_{j - 1,k}} = 0.07$
,
 ${q_{j,k + 1}} = 0.07$
,
${q_{j,k + 1}} = 0.07$
,
 ${q_{j,j}} = 0.75$
, and
${q_{j,j}} = 0.75$
, and
 ${q_{j,{\rm{exit}}}} = 0.11$
, 1e-6 otherwise. The entry-exit row priors were uniform, with
${q_{j,{\rm{exit}}}} = 0.11$
, 1e-6 otherwise. The entry-exit row priors were uniform, with
 ${q_{{\rm{entry}},j}} = {1 \over 9}$
.
${q_{{\rm{entry}},j}} = {1 \over 9}$
.
We compare these informative priors with a set of uniform priors that allow dairies to shift up, down, or remain in the same size class. For example, for dairies in the 1–9 size class, the uniform priors are
 ${q_{1,1}} = {q_{1,2}} = {q_{1,{\rm{exit}}}} = {1 \over 3}$
. Likewise, for the largest size class of 1,000+ head,
${q_{1,1}} = {q_{1,2}} = {q_{1,{\rm{exit}}}} = {1 \over 3}$
. Likewise, for the largest size class of 1,000+ head,
 ${q_{9,7}} = {q_{9,8}} = {q_{9,{\rm{exit}}}} = {1 \over 3}$
. For the remaining size classes,
${q_{9,7}} = {q_{9,8}} = {q_{9,{\rm{exit}}}} = {1 \over 3}$
. For the remaining size classes,
 ${q_{jk}} = {1 \over 4}$
for states
${q_{jk}} = {1 \over 4}$
for states
 $j$
= 10–19, 20–49, 50–99 size classes and exit, zero otherwise. In the case of state
$j$
= 10–19, 20–49, 50–99 size classes and exit, zero otherwise. In the case of state
 $\left( {j,k} \right)$
=
$\left( {j,k} \right)$
=
 $\left( {{\rm{entry}},{\rm{exit}}} \right)$
, the priors are uniform with
$\left( {{\rm{entry}},{\rm{exit}}} \right)$
, the priors are uniform with
 ${q_{{\rm{entry}},k}} = {1 \over 9}$
. Uniform priors suggest that, while some sizes are unobtainable, it is uncertain which admissible size class a dairy will occupy from one period to the next. For all model runs, we choose between Arfa et al.’s reference priors or the uniform priors based on a normalized entropy measure
${q_{{\rm{entry}},k}} = {1 \over 9}$
. Uniform priors suggest that, while some sizes are unobtainable, it is uncertain which admissible size class a dairy will occupy from one period to the next. For all model runs, we choose between Arfa et al.’s reference priors or the uniform priors based on a normalized entropy measure
 $S\left( {{\bf{\hat p}}} \right)$
(Golan, Judge, and Perloff, Reference Golan, Judge and Miller1996; Golan and Vogel, Reference Golan and Vogel2000)
$S\left( {{\bf{\hat p}}} \right)$
(Golan, Judge, and Perloff, Reference Golan, Judge and Miller1996; Golan and Vogel, Reference Golan and Vogel2000)
 $$S\left( {{\bf{\hat p}}} \right) = \left[ {\mathop \sum \nolimits_j \mathop \sum \nolimits_k {{\hat p}_{jk}}\ln {{\hat p}_{jk}}} \right]/\left[ {\mathop \sum \nolimits_j \mathop \sum \nolimits_k {q_{jk}}\ln {q_{jk}}} \right]$$
The index quantifies the amount of information gained from estimating the transition probabilities in terms of explaining dairy sector dynamics. Lower values of
 ${\rm{S}}\left( {{\bf{\hat p}}} \right)$
correspond with a preferred model. This index is used to determine if Arfa et al.’s or the uniform priors were appropriate for each state’s model (Table A2).
${\rm{S}}\left( {{\bf{\hat p}}} \right)$
correspond with a preferred model. This index is used to determine if Arfa et al.’s or the uniform priors were appropriate for each state’s model (Table A2).
3.3. Test for Change in Industry Dynamics
We calculate a chi-square statistic to test for structural changes in the dairy entry size class-exit transition dynamics. The test is similar Chow’s test, which identifies structural breaks in time series (Chow, Reference Chow1960). The reference year is 2002. If the matrix of the pre- (
 ${{\bf{p}}^1}$
) and post-2002 series (
${{\bf{p}}^1}$
) and post-2002 series (
 ${{\bf{p}}^2}$
) transition probabilities are different, then we conclude that a structural break occurred during the 1987–2002 (“period 1”) and 2002–2017 periods (“period 2”). The null hypothesis of this joint test is that industry dynamics were not different between periods;
${{\bf{p}}^2}$
) transition probabilities are different, then we conclude that a structural break occurred during the 1987–2002 (“period 1”) and 2002–2017 periods (“period 2”). The null hypothesis of this joint test is that industry dynamics were not different between periods;
 ${{\rm{H}}_0}:\;{{\bf{\hat p}}^1} = {{\bf{\hat p}}^2}\;$
. The alternative hypothesis is that the industry dynamics characterizing the pre- and post-2002 periods are different.
${{\rm{H}}_0}:\;{{\bf{\hat p}}^1} = {{\bf{\hat p}}^2}\;$
. The alternative hypothesis is that the industry dynamics characterizing the pre- and post-2002 periods are different.
We first estimate the transition probabilities characterizing dairy industry dynamics using all years (1987–2017) with the
 ${\bf{q}}$
priors. These results yield a matrix of reference transition probabilities
${\bf{q}}$
priors. These results yield a matrix of reference transition probabilities
 ${{\bf{\hat p}}^0}$
for each of the lower 48 states and one for all US dairies. Next, we use the 1987 to 2002 data (“period 1”) to estimate the corresponding set of transition probabilities using
${{\bf{\hat p}}^0}$
for each of the lower 48 states and one for all US dairies. Next, we use the 1987 to 2002 data (“period 1”) to estimate the corresponding set of transition probabilities using
 ${{\bf{\hat p}}^0}$
as a reference, which yields the period 1 matrix of transition probabilities
${{\bf{\hat p}}^0}$
as a reference, which yields the period 1 matrix of transition probabilities
 ${{\bf{\hat p}}^1}$
. Lastly, we use the 2002–2017 data (“period 2”) to estimate the transition probabilities for this period
${{\bf{\hat p}}^1}$
. Lastly, we use the 2002–2017 data (“period 2”) to estimate the transition probabilities for this period
 ${{\bf{\hat p}}^2}$
using again
${{\bf{\hat p}}^2}$
using again
 ${{\bf{\hat p}}^0}$
as the industry reference. Models are solved separately for each state and then solved for all US dairies, conditional on their respective reference matrix
${{\bf{\hat p}}^0}$
as the industry reference. Models are solved separately for each state and then solved for all US dairies, conditional on their respective reference matrix
 ${{\bf{\hat p}}^0}$
.
${{\bf{\hat p}}^0}$
.
The chi-square statistic for this test is
 $\chi _{K - 1}^2 = \mathop \sum \limits_j \mathop \sum \limits_k {\left( {\hat p_{jk}^2 - \hat p_{jk}^1} \right)^2}/\hat p_{jk}^1$
, with 8 degrees of freedom (Golan and Vogel, Reference Golan and Vogel2000) and a corresponding critical value of 15.51 (13.36) at the 5% (10%) level of significance. This is a joint test. The statistic tests how much the post-2002 transition probabilities diverged from the 1987 to 2002 transition probabilities. The null hypothesis is that pre- and post-transition industry dynamics are not different. A test statistic larger than the critical value indicates that the states or nation’s industry dynamics changed after 2002. We can only indirectly attribute the change entry/exit status to the introduction of MILC legislation and not directly to the policy itself. Interpretation of these test findings should be made with this caveat in mind.
$\chi _{K - 1}^2 = \mathop \sum \limits_j \mathop \sum \limits_k {\left( {\hat p_{jk}^2 - \hat p_{jk}^1} \right)^2}/\hat p_{jk}^1$
, with 8 degrees of freedom (Golan and Vogel, Reference Golan and Vogel2000) and a corresponding critical value of 15.51 (13.36) at the 5% (10%) level of significance. This is a joint test. The statistic tests how much the post-2002 transition probabilities diverged from the 1987 to 2002 transition probabilities. The null hypothesis is that pre- and post-transition industry dynamics are not different. A test statistic larger than the critical value indicates that the states or nation’s industry dynamics changed after 2002. We can only indirectly attribute the change entry/exit status to the introduction of MILC legislation and not directly to the policy itself. Interpretation of these test findings should be made with this caveat in mind.
3.4. Test for Changes in Dairy Exit Probabilities
The previous test considered changes in entry/size transition/exit probabilities for all size classes. A more specific question focuses on exit rates only, and if pre- and post-2002 exit rates are different. We formulate this hypothesis as a one-tailed test. The null hypothesis is that the exit rate of dairies in a size class was not different between the 1987–2002 and 2002–2017 periods;
 ${{\rm{H}}_0}:\;\hat p_{j,{\rm{exit}}}^2 = \hat p_{j,{\rm{exit}}}^1$
. The alternative hypothesis is
${{\rm{H}}_0}:\;\hat p_{j,{\rm{exit}}}^2 = \hat p_{j,{\rm{exit}}}^1$
. The alternative hypothesis is
 ${{\rm{H}}_{\rm{A}}}:\;\hat p_{j,{\rm{exit}}}^2 \lt \hat p_{j,{\rm{exit}}}^1$
; exit rates decreased after 2002.
${{\rm{H}}_{\rm{A}}}:\;\hat p_{j,{\rm{exit}}}^2 \lt \hat p_{j,{\rm{exit}}}^1$
; exit rates decreased after 2002.
We use an exact binomial test to test this hypothesis (Clopper and Pearson, Reference Clopper and Pearson1934). The binomial probability for the test is
 $${\rm{Pr}}\left( {\hat p_{j,{\rm{exit}}}^2\; \ge \hat p_{j,{\rm{exit}}}^1} \right) = \left( {\matrix{ {{n_{j\left( t \right)}}} \cr {{n_{j\left( t \right),{\rm{exit}}}}} \cr } } \right)\cdot{\left( {\hat p_{j,{\rm{exit}}}^1} \right)^{{n_{j\left( t \right)}}}}\cdot{\left( {1 - \hat p_{j,{\rm{exit}}}^1} \right)^{{n_{j\left( t \right)}} - {n_{j\left( t \right),{\rm{exit}}}}}}$$
where
 ${n_{j\left( t \right),{\rm{exit}}}} = {\rm{\;}}\hat p_{j,{\rm{exit}}}^2\cdot {n_{j\left( t \right)}}$
, and
${n_{j\left( t \right),{\rm{exit}}}} = {\rm{\;}}\hat p_{j,{\rm{exit}}}^2\cdot {n_{j\left( t \right)}}$
, and
 ${n_{j\left( t \right)}}$
is the observed number of dairies exiting the industry in period
${n_{j\left( t \right)}}$
is the observed number of dairies exiting the industry in period
 $t$
. We calculate this probability for the periods 2007, 2012, and 2017 for each size class and separately for every state. We also calculate these probabilities for each state using the average number of exits over the 2007–2017 period (
$t$
. We calculate this probability for the periods 2007, 2012, and 2017 for each size class and separately for every state. We also calculate these probabilities for each state using the average number of exits over the 2007–2017 period (
 ${\bar n_{j,{\rm{exit}}}}$
and
${\bar n_{j,{\rm{exit}}}}$
and
 ${\bar n_j}$
). When the calculated probability is less than 0.05 (i.e., a 5% Type I error rate), we reject the null hypothesis and conclude that the post-2002 exit transition probabilities were less than the 1987–2002 exit probabilities.
${\bar n_j}$
). When the calculated probability is less than 0.05 (i.e., a 5% Type I error rate), we reject the null hypothesis and conclude that the post-2002 exit transition probabilities were less than the 1987–2002 exit probabilities.
3.5. Long-Term Industry Composition and Periods until Exit
We use the properties of the Markov transition probabilities to solve for each state’s long-term steady-state probabilities. Long-term probabilities are a vector of probabilities that characterize the steady-state behavior of a Markov process, in this case, dairy entry, exit, and industry composition. The steady-state probabilities are interpreted as the average number of dairies occupying a size class over the long term. The vector of steady-state probabilities (
 ${{\bf{\pi }}^{SS}}$
) is the solution to the equation system:
${{\bf{\pi }}^{SS}}$
) is the solution to the equation system:
 $${{\bf{\pi }}^{SS}} = \left[ {\matrix{ {{\pi _1}} \cr {{\pi _2}} \cr {\matrix{ \vdots \cr {{\pi _K}} \cr } } \cr } } \right] = {\left[ {\matrix{ {{}_{J - 1}^{}{{\bf{I}}_{K}} - {}_{J - 1}^{}{\bf{\hat P}}_{K}^{'}} \cr {{\bf{1}}_K^{'}} \cr } } \right]^{ - 1}}\;\;\left[ {\matrix{ {{{\bf{0}}_{K - 1}}} \cr 1 \cr } } \right] $$
where
 ${\bf{I}}$
is an identity matrix,
${\bf{I}}$
is an identity matrix,
 $\bf 0$
a vector of zeros, and the subscripts indicate the dimensions of a vector or matrix (Miranda and Fackler, Reference Miranda and Fackler2002).
$\bf 0$
a vector of zeros, and the subscripts indicate the dimensions of a vector or matrix (Miranda and Fackler, Reference Miranda and Fackler2002).
We also determine the number of periods until a dairy occupying a size class is likely to exit the industry. Define
 ${\bf{Q}}$
as the
${\bf{Q}}$
as the
 ${{\bf{\hat P}}_{J - 1,K - 1}}$
matrix of transition probabilities after removing the row and column that corresponds with a state; for example, the (entry, exit) row. The expected number of periods until a dairy beginning in size class
${{\bf{\hat P}}_{J - 1,K - 1}}$
matrix of transition probabilities after removing the row and column that corresponds with a state; for example, the (entry, exit) row. The expected number of periods until a dairy beginning in size class
 $j$
exits the industry is calculated as the row-sum of the matrix
$j$
exits the industry is calculated as the row-sum of the matrix
 ${\bf{N}} = \;{\left( {{\bf{I}} - {\bf{Q}}} \right)^{ - 1}}$
where
${\bf{N}} = \;{\left( {{\bf{I}} - {\bf{Q}}} \right)^{ - 1}}$
where
 ${\bf{I}}$
is a conformable identity matrix (Isaacson and Madsen, Reference Isaacson and Madsen1976). The steps until exit are calculated for the pre- and post-2002 periods.
${\bf{I}}$
is a conformable identity matrix (Isaacson and Madsen, Reference Isaacson and Madsen1976). The steps until exit are calculated for the pre- and post-2002 periods.
4. Results
4.1. Analysis of All US Dairies
4.1.1. Transition Probabilities
For all US dairies, the probability of exiting the industry, 1987–2017, was highest for entering dairies (Pr(entry, exit) = 0.68), followed by the smallest operations (1–9 head, Pr(entry, exit) = 0.42) (Table 3). The likelihood of 1–9 head operation remained in the same category the following period was about that of the likelihood of exiting (Pr(1–9, 1–9) = 0.43). The 10–19 herd size dairies are more likely to reduce their herd size or exit. For operations managing more than 100 head, there is considerable uncertainty as to whether an operation downsizes, scales up, remains the same size, or exits, as evidenced by the relatively uniform distribution of their respective transition probabilities. Table A3 reports the state-level transition probabilities.
Table 3. Transition probabilities for US dairies

Note: Transition probabilities for all 42 states are reported in Appendix 3.
4.1.2. Elasticities
Increases in dairy margins have helped operations stay in business longer, especially small and mid-size dairies. Elasticities were calculated using equation (5) and the Lagrange multipliers are reported in Table A4. A 1% increase in dairy margins reduces the likelihood of dairies in the 20–49 size class from exiting by −0.14 (Table 4). The effects of a 1% increase in the dairy margin on the likelihood of dairies in the 1–9 and 50–99 size classes exit are similar (−0.097 and −0.098, respectively). Therefore, dairy margins reduce the likelihood of operation exit but exert a positive effect on small- and medium-sized operation survival. For larger operations, the magnitude of the dairy margin on exits was less than −0.001%.
Table 4. Changes in industry composition, dairy margins, production, and consumer expenditure on milk, 1987–2017: all US dairies
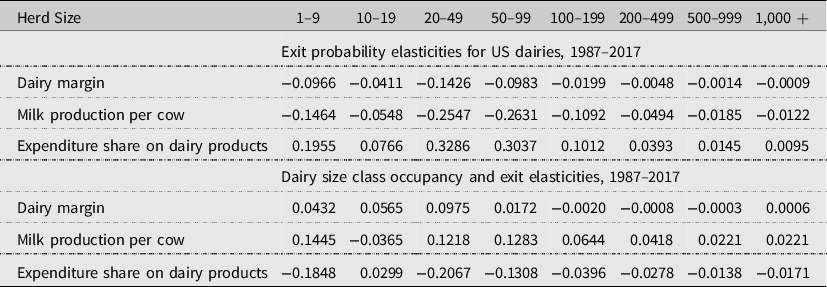
Milk production per cow is an indicator of productivity. The effect of milk production with respect to the likelihood of exiting is negative for all size classes, suggesting that increases in output per cow are associated with dairy survivability (Table 4). Similar to the impact of dairy margins, the 50–99 size and 20–49 size class operations are most responsive to a 1% increase in milk production per cow than other size classes (−0.2631 and −0.2547, respectively). Interestingly, higher levels of productivity increase mobility in the 10–19 size class by decreasing the probability that these dairies remain in the same class in the next period. Thus, 10–19 size class operations are likely to expand in size.
Higher consumer expenditures on dairy products increase the probability of exiting for all size classes (Table 4). An increase in expenditure shares for dairy products is also associated with lower rates of dairy entries. Smaller operations (1–9, 20–49, and 50–99 size classes) are relatively more responsive to the expenditure share on dairy products (0.20, 0.33, and 0.30, respectively) while the magnitude of this variable on larger operations is less than 0.05. Higher consumer expenditures on dairy products appear to be associated with lower survivability of small- and medium-sized class operations. One explanation behind this correlational finding may be that expenditure shares on dairy products have increased because of rising dairy costs of production, which are passed on to consumers through retail purchases. If the increase in the share of consumer expenditures on dairy products is linked to higher production costs, then small- and medium-sized dairies capable of scaling up their operation may be more likely to survive. Otherwise, smaller- and medium-sized dairies risk exiting and may become less competitive and eventually exit the industry. This process could accelerate dairy consolidation and lead to an increase in smaller- and medium-sized farm exits.
4.1.3. Industry Change: Post-2002
The probability of exiting for all size classes has increased since 2002. The likelihood of new entrants decreased by 9%, and the exit probability was largest for the 1–9 herd size dairies post-2002 (Pr(1–9, exit) = 0.44). The 20–49 herd size class has the largest increase in the probability of exiting compared to pre-2002 exit rates. This suggests that the likelihood of exiting the industry remains highest for small- and medium-sized dairies (Table 3). There was insufficient evidence to suggest that the sector dynamics characterizing the pre- and post-2002 periods were different. However, for all size classes, the binomial tests focusing only on the pre- and post-2002 changes in exit probabilities suggest that the exit rate has not decreased since 2002.
4.1.4. Long-Term Steady-State Probabilities
The probability of dairies entering the industry has decreased since 2002, but the steady-state probability to exiting has increased compared with the pre-2002 transition probabilities (Table 5). For the aggregated analysis of US dairies, the steady-state probability to exit after 2002 is 0.624, up about 0.11 from the pre-2002 period. Over the long term, we would expect to see roughly half of the remaining US dairies exit the industry.
Table 5. Changes in steady-state probability of exiting
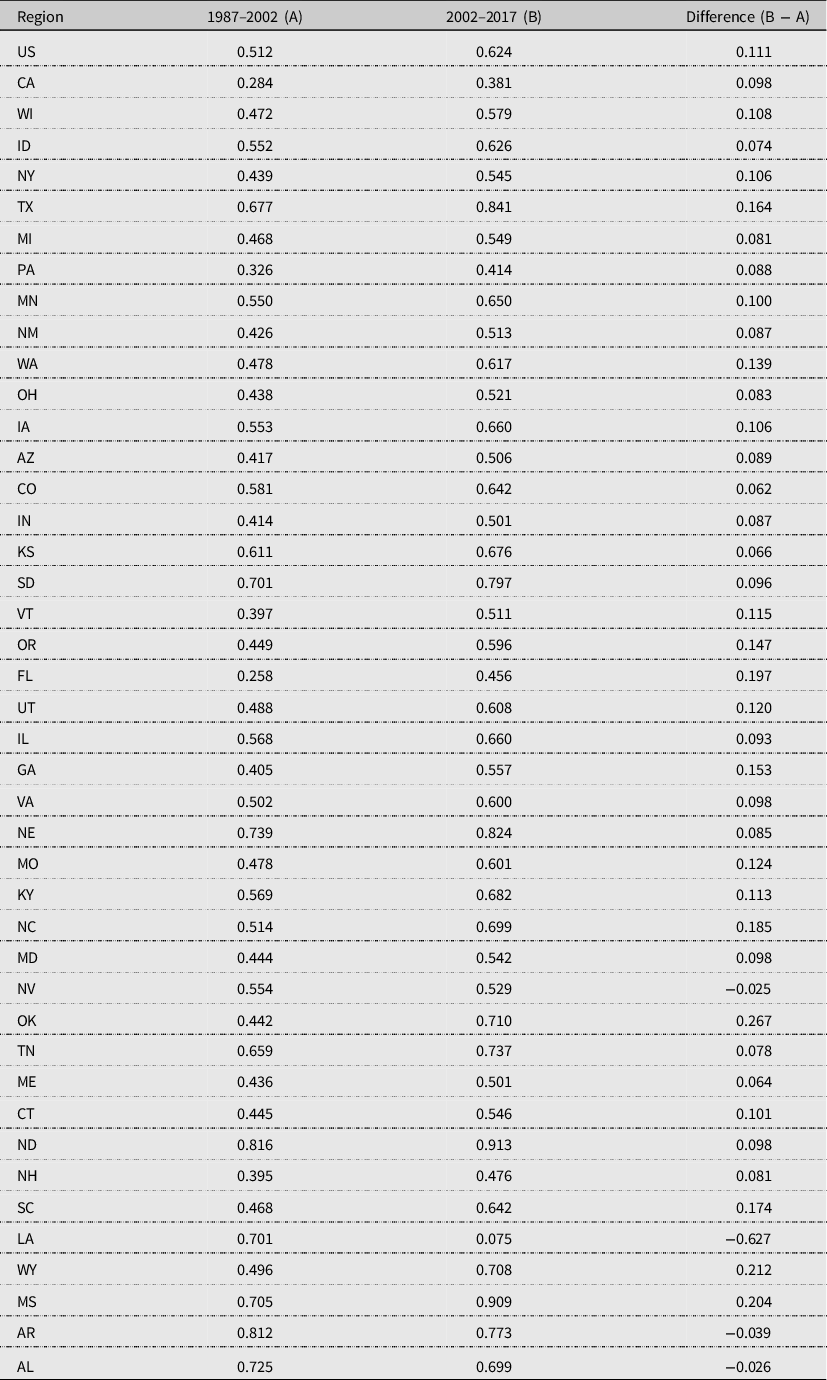
Notes: (1) Regions listed in order of milk production in 2018.
(2) In the third column, a negative value in the difference means that the probability of exit decreased compared to the 1987–2002 period.
4.1.5 Periods until Exit
The number of 5-year periods until a dairy beginning in any size class is likely to exit the industry is calculated using the pre- and post-2002 transition probabilities. In Table 6, the first row indicates the steps until exit and the first column indicates dairy size. Regions in each category are listed in the table according to the post-2002 transition probabilities (Table 6). According to the post-2002 transition probabilities, the number of periods until exit for the 1–9 size head operations is about 15 years. The number of periods until exit for larger operations (100–199, 200–499, 500–999, and 1,000+ size head operations) is about 20 years. The last three columns of Table 6 show the difference between the steps calculated using the pre-2002 transition probabilities. There is no difference between the steps calculated using the pre-2002 and post-2002 transition probabilities for all US dairies.
Table 6. Periods until exit, 2002–2017
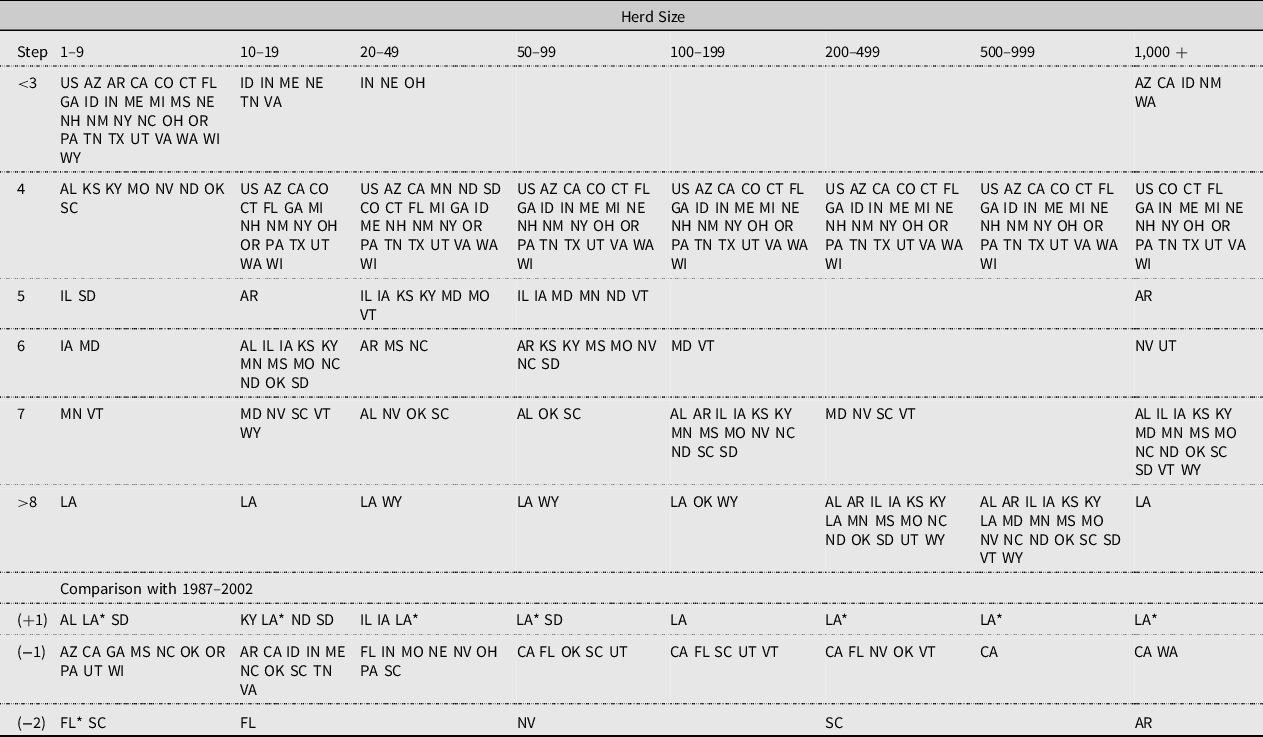
Notes: (1) 1 step = 5 years.
(2) The sign in parentheses indicates shortening or extending of the periods until exit.
4.2. State-Level Analyses
4.2.1. Transition Probabilities
State differences in the transition probabilities reflect the variability across states with respect to conditions favoring operation expansion and survivability. The probability of exiting over the entire sample period also varies across states and dairy size (Figure 2). Model performance for two different reference probabilities (e.g., priors) was evaluated for each state. Based on model performance (Table A2), the transition probabilities for 15 states were estimated using Arfa et al.’s priors. For 27 states, the uniform reference category was used as transition probability priors. Variation across states in the likelihood of exiting is greater for the smallest size dairies and new entrants. For small dairies in Maine, Nebraska, and Idaho, there is 0.50 probability these operations exit within the next 5 years. For the dairy size class of 1–9 head, Wyoming, Minnesota, and Vermont, there is less than a 0.20 probability of exiting by the next period. The probability of new entrants exiting also varies considerably by state. For entrants in Arkansas, North Dakota, Mississippi, and Louisiana, there is more than a 0.90 probability of exiting. On the other hand, for new dairies in California, Florida, and Arizona, the likelihood of exiting by the next period is less than 0.50.
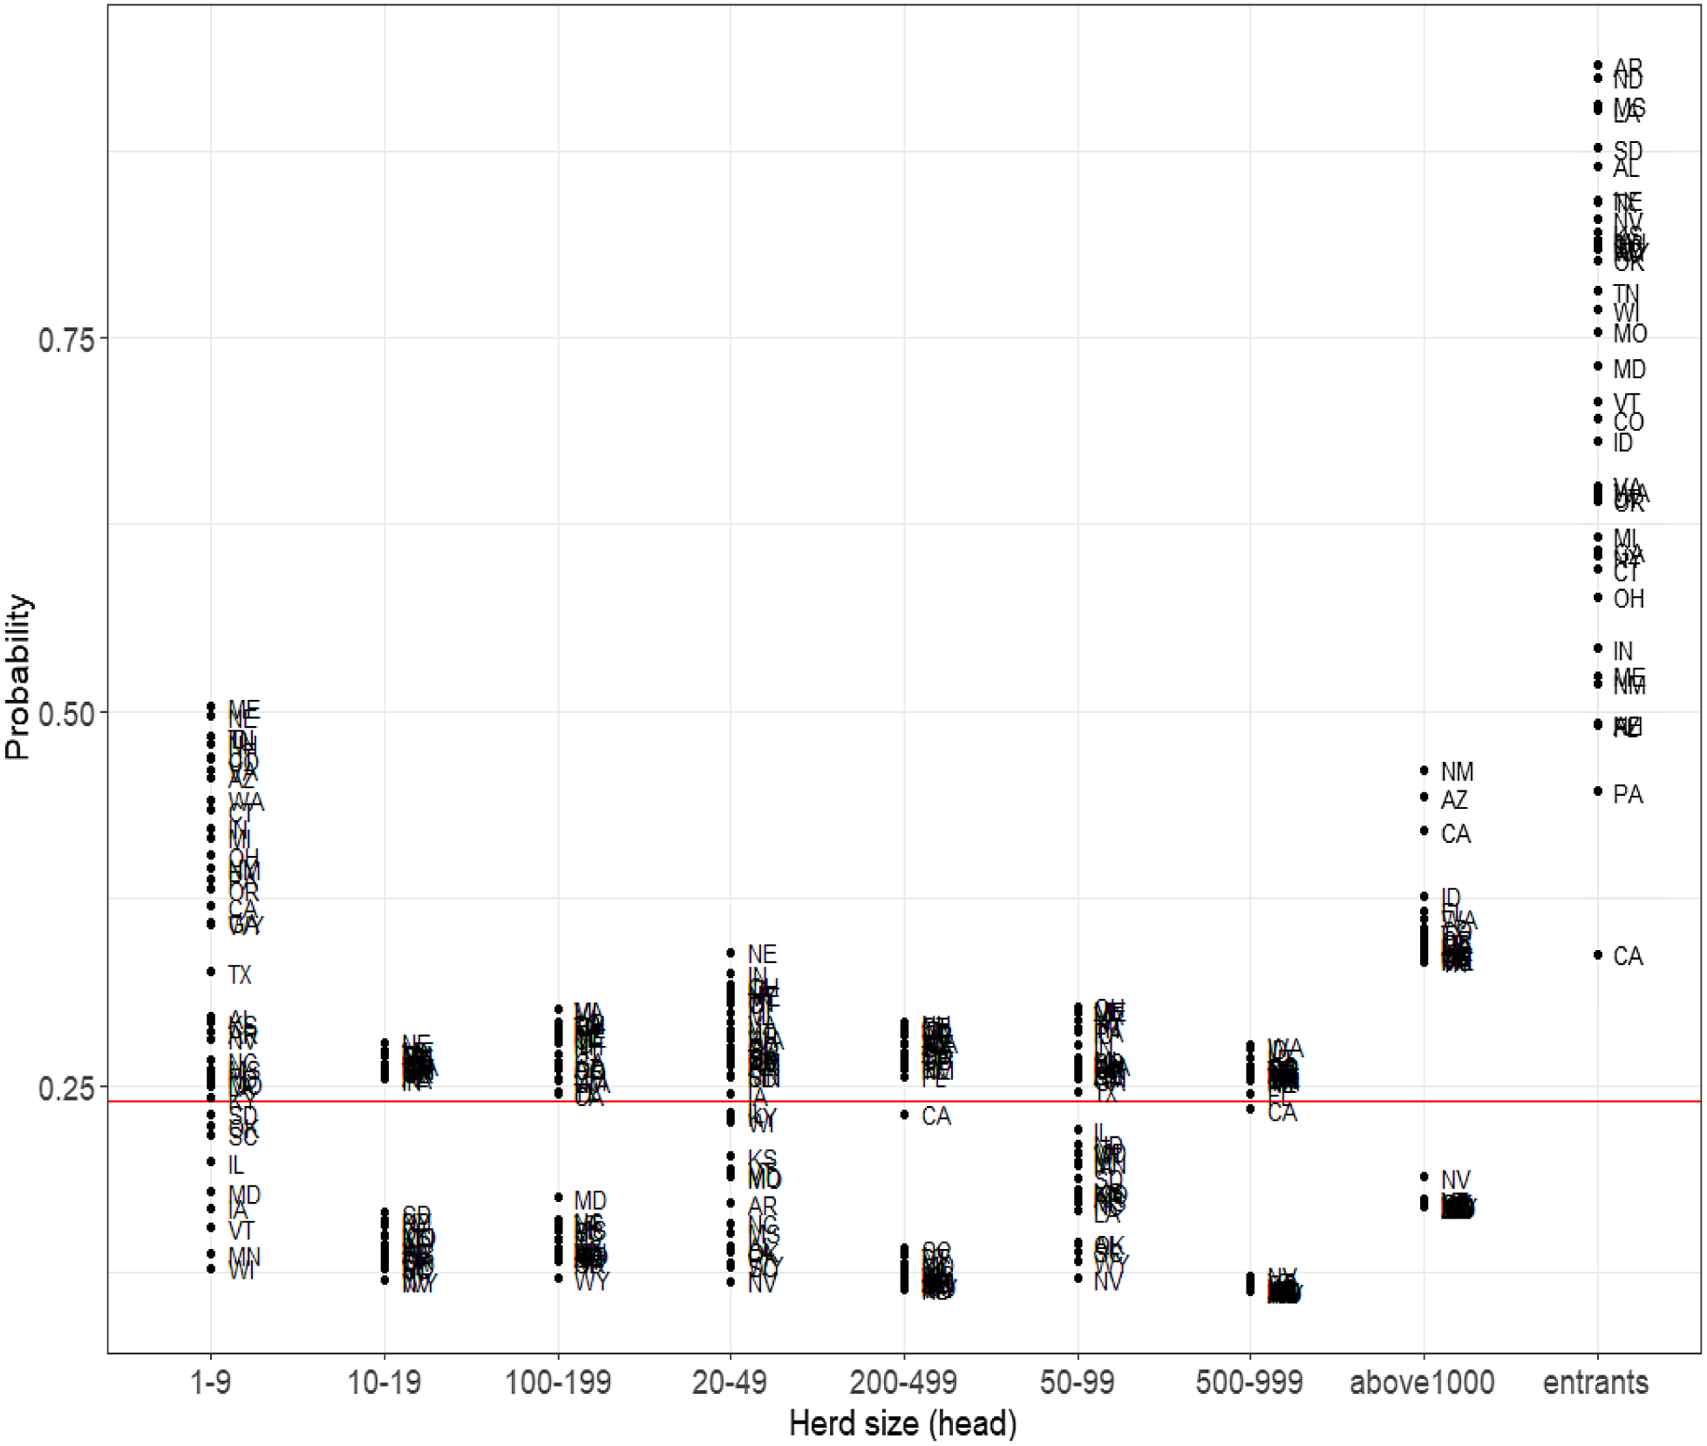
Figure 2. Exit probabilities for each size category, 1987–2017. Note: Red line is the US national average.
4.2.2. Elasticities
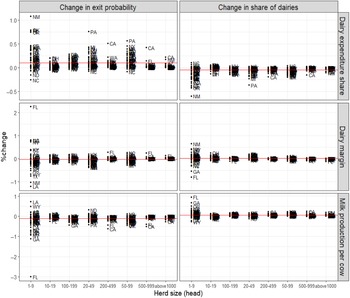
Changes in the dairy margin have differential effects on dairy size classes and vary by state (Figure 3). In Florida, Georgia, and North Carolina, for example, the share of exiting dairies does not decrease with higher dairy margins. In Louisiana, New Mexico, and Wyoming, an increase in dairy margins corresponds with an increase in the number of 1–9 size class dairies.

Figure 3. Dairy margins, production, and consumer expenditure share for dairy products on industry composition, 1987–2017: 42 States. Note: Red line is the US national average.
In most states, dairy margins have a positive impact on the share of farms in all size categories except for exiting operations. The effect of the dairy margin on transition diminishes for larger-sized operations. In most states, the responsiveness of transition probabilities to increased productivity is greater than the effect of dairy margins, suggesting that productivity is an important determinant of industry dynamics. Gains in productivity have the effect of increasing the share of mid-sized operations across all regions. For all states, an increase in milk production per cow encourages new dairies to enter. In Florida, Georgia, and California, an increase in milk production per cow leads to a larger decline in the share of dairies exiting (over −1%). In all states except North Carolina, North Dakota, and Alabama, higher expenditure shares on dairy products increases the composition of exiting farms, which is consistent with the results of the aggregate US analysis.
4.2.3. Industry Change: Post-2002
The trend in consolidation has continued since 2002 in most states, but the pace and magnitude of dairy exits and changes in industry structure varies across states and operation size. There is some evidence suggesting that industry dynamics have changed since 2002. The null hypothesis that the pre- and post-2002 transition probabilities were the same was rejected at the 1% level of significance for five states, including Nevada, Tennessee, South Carolina, Louisiana, and Wyoming. For the remaining states, the transition probabilities characterizing industry dynamics were not different between the two periods.
The binomial tests examining the changes in the pre- and post-2002 exit probabilities suggest that exit rates have increased since 2002 for all states and all size classes, except for Alabama and Louisiana dairies.
4.2.4. Long-Term Steady-State Probabilities for States
The steady-state probabilities for each size category vary by state. The increased costs of producing milk and changes in the marketing environment may have lowered the entry rate of dairies because market conditions favor the scale economies of larger operations. Over the long term, the lower the entry probability of new dairies, the lower the probability that the operation remains in a specific size category. For example, in the case of Arkansas and North Dakota where the probability of new dairies entering is relatively low (Figure 2), the steady-state probability to exit exceeds 0.90. Louisiana, California, Florida, and New Hampshire dairies are less likely to exit in the long term compared to dairies in other states (below 0.50). Oklahoma, Wyoming, and Mississippi have seen the greatest increase in their steady-state probability to exit after 2002. In these states, the long-term exit probability increased by more than 0.20.
4.2.5. Periods until Exit
Although it varies depending on the state, smaller dairies appear to have relatively short periods until exit. For larger operations, the period until industry exit is longer (Table 6). Using the post-2002 transition probabilities, for many states the number of periods until exit for the smallest operations (1–9 head) is about 15 years. The number of periods until exit for operations with more than 100 head is about 20 years. The number of periods until exit for dairies of all sizes, except for the smallest operations, is about 20 years for most states.
The last three columns of Table 6 highlight the differences between the steps calculated using pre-2002 transition probabilities. Depending on the transition probabilities used for the calculation, the number of periods until exit also varies by state and operation size. For most states, the number of periods until exit decreased by 5–10 years after 2002. In the case of the 1–9 head dairies in Florida, the number of steps until exit decreased by four steps (20 years) from seven steps before 2002 to 3 steps afterward. A reduction in the number of steps until exit is suggestive of industry consolidation. In a few states such as South Dakota and Louisiana, the periods until exit extend to one or more steps.
5. Conclusions
This study analyzed the structural changes in the US dairy industry as a first-order Markov process. The methodology provides a framework for analyzing industry dynamics, determining structural breaks in aggregate industry trends, and examining the role of national agricultural policies in these shifts. Evidence suggests that transitions between dairy sizes changed with initial size, by state, and macroeconomic variables including the income-over-feed-cost margins, milk productivity, and consumer expenditure shares on dairy products. Results suggest that small- and medium-sized operations in most states are more likely to increase in size or exit. An increase in dairy margins and improvements in milk productivity are positively associated with the survivability of small- and medium-sized dairies, while an increase in the consumer expenditures on dairy products is associated with small-sized operation exits.
The industrial dynamics of the US dairy sector exhibit a persistent trend toward consolidation across most states. Evidence was insufficient to conclude that the industry underwent significant structural changes after 2002. However, when the hypothesis of whether the exit probabilities for each state and dairy size classes changed since 2002, exit rates increased significantly for most regions. The pattern of exits probabilities varies depending on the dairy size and state. One interpretation of this finding is that the impact of direct payments to dairy operations based on margins and using surplus dairy products purchases as a way to support dairy farms have similar outcomes. Dairies exit or increase in size since both support systems subsidize milk production. If an operation receives more subsidies for producing more milk, then the incentive to increase output to receive additional subsidies is reinforced. One implication of this interpretation is that dairy policies tied to production may be misplaced if their purpose is to assist dairy operations since the outcome of both pre- and post-2002 policies caused farms to increase in size at the expense of losing small and medium dairies.
There are caveats of this study that inform future research directions. First, although the study spans 30 years, only seven periods were available for the analysis. The focus of the analysis was also on state-level changes in the dairy sector. This data limitation, our focus on industry performance at the state level, and our interest in the probability of entry and exits precluded the use of panel data estimators that could also be used to test for structural breaks. We instead used a math programming approach to determine if the exit rate of dairies changed following the 2002 farm bill legislation. While the optimization procedure used to determine the transition probabilities is robust to the ill-posed nature of the model, we are unable to conduct inference on the primary drivers of this industry’s dynamics. Time series data on dairy industry performance disaggregated to the state level could enhance the analysis.
Second, the optimization procedure conditioned the transition probabilities on dairy margins, consumer expenditures on milk, and milk production. The analysis omitted other economic and environmental variables that could affect industry dynamics. We also used aggregated expenditure data on milk consumption. Apportioning a regional expenditure share to states in a region removes variation in state-level expenditures on milk that might affect entry-exit dynamics. Conclusions and inference drawn from this observational analysis should be made with these caveats in mind.
The MPP was enacted by 2014 legislation, but its effects up to 2017 (the last available year of Census data) may be confounded with those of MILC. We have no way to disentangle the differential effects of these policies on dairy entry/exit. However, the objective of this study was to determine if any policy decreased the exit probability for all dairy size classes across all states, and the nation, with 2002 the reference year. To the extent that both policies were oriented towards industry preservation and expansion, we can still examine whether margin protection and/or direct payments decreased dairy entry/exit rates. A longer series would be required if the study’s objective was to differentiate the effects of MILC and MPP on industry performance.
Supplementary material
For supplementary material accompanying this paper visit https://doi.org/10.1017/aae.2022.1
Acknowledgments
This research was supported by the Sparks Chair for Agricultural Sciences & Natural Resources. The authors declare no competing interests. Data are publicly available and will be provided as supplemental material. The authors thank anonymous reviewers for their helpful and constructive comments and suggestions. All remaining errors are those of the authors.
Competing Interests
The authors declare no competing interests.


 Open access