


Introduction
Water shortages are very frequent in many countries, and, together with the rising demand for industry, growth of human population, climate change and specifically the trend towards irrigated agriculture, have led to widespread problems of water scarcity, especially in Mediterranean countries (Romero-Trigueros et al., Reference Romero-Trigueros, Alarcon, Nortes, Bayona, Maestre-Valero and Nicolas2020). Increasing scarcity of freshwater and growing competition, particularly in arid and semi-arid regions, is a sharp constraint on agricultural production. The development of water-efficient agricultural practices such as low pressure irrigation systems like surface- and subsurface-drip systems along with scientific irrigation scheduling techniques is thus required for sustainable food production. Irrigation water management in an era of water scarcity will have to be carried out most efficiently, aiming at saving water and at maximizing its productivity (Fereres et al., Reference Fereres, Francisco and Victoria2011). Deficit irrigation (DI) is a strategy that allows a crop to sustain some degrees of water deficits in order to reduce costs and potentially increase income (English and Nuss, Reference English and Nuss1982; Zhang, Reference Zhang2003; Fereres and Soriano, Reference Fereres and Soriano2007; Chai et al., Reference Chai, Gan, Zhao, Xu, Waskom, Niu and Siddique2016). Regulated deficit irrigation (RDI), conventional deficit and partial root-zone drying (PRD) are among these strategies developed for management of irrigation under water scarcity conditions. PRD is a DI technique in which opposite parts of the plant root system is alternately wetted and dried (Marsal et al., Reference Marsal, Mata, Arbones, Del Campo, Girona and Lopez2008). RDI has been developed recently as an important water-saving strategy in irrigated agriculture. Under RDI, crops are allowed to sustain some degree of water deficit in less sensitive growth stages and yield reduction, and it is considered an optimizing strategy (Chartzoulakis and Maria, Reference Chartzoulakis and Maria2015; Chai et al., Reference Chai, Gan, Zhao, Xu, Waskom, Niu and Siddique2016).
Crop water status is an important water stress indicator used in irrigation management (Cohen et al., Reference Cohen, Alchanatis, Saranga, Rosenberg, Sela and Bosak2017; Han et al., Reference Han, Zhang, DeJonge, Comas and Gleason2018). Therefore, reliable estimation of plant water stress is of paramount importance for the efficient irrigation scheduling. Although soil-based methods for assessing crop water status are more widely used, there is a growing interest in plant-based methods (Jones and Vaughan, Reference Jones and Vaughan2010), because they serve as a direct proxy of actual plant water status. Hence, there is a need to determine the threshold values of plant water stress at which irrigation can be initiated. Among the possible measures of plant water status include direct measurements of some aspect of canopy temperatures (Aladenola and Madramootoo, Reference Aladenola and Madramootoo2014; Bozkurt Çolak et al., Reference Bozkurt Çolak, Yazar, Çolak, Akça and Duraktekin2015; Sezen et al., Reference Sezen, Yazar and Tekin2019). Infrared thermometers (IRTs) measure canopy temperature (Tc) which has received considerable attention in detecting and diagnosing crop water stress (DeJonge et al., Reference DeJonge, Taghvaeian, Trout and Comas2015; Gonzalez-Dugo et al., Reference Gonzalez-Dugo, Testi, Villalobos, López-Bernal, Orgaz, Zarco-Tejada and Fereres2020). Thus, infrared thermometry can help in precise management of irrigation water since it enables continuous monitoring of crop water status with ability to integrate both soil water status and climatic conditions. Crop water stress index (CWSI) is based on a solid theoretical base (Idso et al., Reference Idso, Jackson, Pinter, Reginato and Hatfield1981) and it normalizes Tc firstly, by the actual difference between canopy and air temperature (Tc–Ta) and secondly, by the Tc–Ta of fully transpiring and non-transpiring crops commonly referred to as the lower and upper limits, respectively (Jackson et al., Reference Jackson, Idso, Reginato and Pinter1981). Different models to calculate CWSI have been developed based on differences in how the upper and lower limits are derived (Maes and Steppe, Reference Maes and Steppe2012). The empirical CWSI (Idso et al., Reference Idso, Jackson, Pinter, Reginato and Hatfield1981) model establishes a relationship between Tc–Ta and vapour pressure deficit (VPD) from which the lower limit, known as the ‘non-water-stressed baseline’, is derived. The CWSI is one of the most frequently used indices to quantify crop water stress based on Tc. There is a growing interest of using Tc-based methods, including CWSI, for irrigation management (Katimbo et al., Reference Katimbo, Rudnick, DeJonge, Lo, Qiao, Franz, Nakabuye and Jiaming Duan2022). The application of the CWSI in irrigation scheduling has been evaluated for different crops including vegetables (Yazar et al., Reference Yazar, Howell, Dusek and Copeland1999; Erdem et al., Reference Erdem, Arin, Erdem, Polat, Deveci, Okursoy and Gültas2010; Aladenola and Madramootoo, Reference Aladenola and Madramootoo2014; Bozkurt Çolak et al., Reference Bozkurt Çolak, Yazar, Çolak, Akça and Duraktekin2015; Sezen et al., Reference Sezen, Yazar and Tekin2019).
Using low-pressure systems such as surface drip and subsurface drip has the potential to save water and increase yield, quality as well as water productivity when utilized with the proper irrigation scheduling. Irrigation systems can directly influence crop performance and result in qualitative and quantitative improvements in vegetable yield (Dukes et al., Reference Dukes, Zotarelli and Morgan2010; Bozkurt Çolak et al., Reference Bozkurt Çolak, Yazar, Gönen and Eroğlu2018; Evett et al., Reference Evett, Stone, Schwartz, O'Shaughnessy, Colaizzi, Anderson and Anderson2019). The subsurface drip (SDI) has been proven to be an efficient irrigation method with potential advantages of high water use efficiency, efficient fertilizer application and lower labour costs than in a conventional drip irrigation system (Lamm and Camp, Reference Lamm, Camp, Lamm, Ayars and Nakayama2007; Lamm and Rogers, Reference Lamm and Rogers2017). In SDI system, the irrigation system is placed under ground and when coupled with an effective irrigation management programme provides the opportunity to supply crops with proper amount of water and nutrient requirements directly into root-zone and reduces surface soil evaporation due to irrigation (Irmak et al., Reference Irmak, Djaman and Rudnick2016).
Pepper (Capsicum annum L.) is an important commercial crop, cultivated for vegetable, spice and value-added processed products (Kumar and Rai, Reference Kumar and Rai2005). Its production and consumption is increasing worldwide. Water management in bell pepper is crucial as bell pepper is one of the most water stress-sensitive crops due to its shallow rooting system and the sensitivity of the bell pepper foliage characteristics. Sustainable water management is therefore required to optimize bell pepper yield and water use efficiency while maintaining maximum yield and quality. The pepper plant is considered sensitive to water stress, which can result in large yield reductions (Steduto et al., Reference Steduto, Hsiao, Fereres and Raes2012). Thus, bell pepper has been classified as susceptible to water stress, with flowering growth stage being the most sensitive period (Yahaya et al., Reference Yahaya, Alao and Odigie2012). Such sensitivity has been noticed in several researches that studied the fresh and dry matter yield reduction affected by water stress (Sezen et al., Reference Sezen, Yazar and Eker2006; Costa et al., Reference Costa, Ortuño and Chaves2007; González-Dugo et al., Reference González-Dugo, Orgaz and Fereres2007; Ferrara et al., Reference Ferrara, Lovelli, Di Tommaso and Perniola2011; Zotarelli et al., Reference Zotarelli, Dukes, Scholberg, Femminella and Muñoz-Carpena2011; Sezen et al., Reference Sezen, Yazar and Tekin2019; Abdelkhalik et al., Reference Abdelkhalik, Pascual, Nájera, Domene, Baixauli and Pascual Seva2020).
The Mediterranean climate is characterized by mild and rainy winters, and dry and hot summers, with highly variable rainfall distribution, and therefore, irrigation is essential for crop production (Galindo et al., Reference Galindo, Collado-González, Griñán, Corell, Centeno, Martín-Palomo, Girón, Rodríguez, Cruz, Memmi, Carbonell-Barrachina, Hernández, Torrecillas, Moriana and Pérez-López2018). In the Mediterranean region, the vegetative and reproductive growth stages of horticultural and field crops are generally affected by recurrent water stress episodes. Therefore, it is very important to understand to what extent water stress negatively affects physiological processes, plant growth and yield and quality in field-grown bell pepper (Delfine et al., Reference Delfine, Tognetti, Loreto and Alvino2002).
To achieve optimal bell pepper production and best irrigation regime, there is a need for a comprehensive assessment of the yield, and physiological response of the plant to a particular soil type, production system and irrigation regime (Bozkurt Colak, Reference Bozkurt Colak2021). Therefore, the present study was conducted to assess crop water status by means of the CWSI for irrigation scheduling and net profit generation on differentially irrigated bell pepper. Thus, the main objectives of this study are to investigate the yield, quality and CWSI of field-grown bell pepper response to various DI regimes such as RDI, PRD and conventional DIs along with full irrigation applied with surface- and subsurface-drip systems in a Mediterranean environment.
Materials and methods
Description of experimental site and soil
This study was conducted at the Soil and Water Resources Unit of Alata Horticultural Research Institute (36°53' N and 34°57' E, at an altitude of 30.0 m), in Tarsus in the Mediterranean region of Turkey during 2016 and 2017 growing seasons. The Mediterranean climate is characterized by mild and rainy winters, and dry and hot summers, with highly variable rainfall distribution. In the experimental site, the mean annual rainfall is 616 mm, mean evaporation from Class A pan is 1487 mm, average annual temperature is 17.8°C and mean relative humidity is 71.0% (MGM, 2019). Approximately 65% of the rainfall is received in the period November through May. The experimental soil is classified as silty-clay-loam texture with relatively high water holding capacity (58.2 mm in the 40 cm soil depth). Some physical and chemical properties of the experimental soil are presented in Table 1.
Table 1. Some physical and chemical properties of the soils at the experimental site

FC, field capacity; WP, permanent wilting point; BD, bulk density; EC, electrical conductivity; CaCO3, calcium carbonate; P2O5, phosphorus pentoxide; K2O, potassium oxide; OM, organic matter.
Experimental design and treatments
The experimental plots were arranged according to a split-plot design with two irrigation systems (surface drip, DI; and subsurface drip, SDI) as the main plots and irrigation regimes (I) as the subplots with four replicates. In this study, two irrigation methods (DI, SDI) and five irrigation strategies designated as full irrigation (I100); conventional DI, I50; conventional DI, I75; partial root-zone drying (PRD50); and RDI were considered as treatments. Irrigations were initiated when 25% of available water in the effective root-zone depth of 40 cm was depleted and replenished to field capacity in I100 plots. The RDI treatment plots received 50% of I100 until flowering growth stage, then it received 100% of water requirement until harvest the same as I100. In the conventional DI treatment plots of I75 and I50, 75 and 50% of I100 were applied, respectively, throughout the growing season. The PRD50 plots received 50% of I100, but from the alternative drip lateral lines in each irrigation application. The experimental subplots had dimensions of 10 m long and 3.5 m wide (5 plant rows). Layout of the experimental treatments and details of an experimental sub-plot is shown in Figs 1(a) and (b).
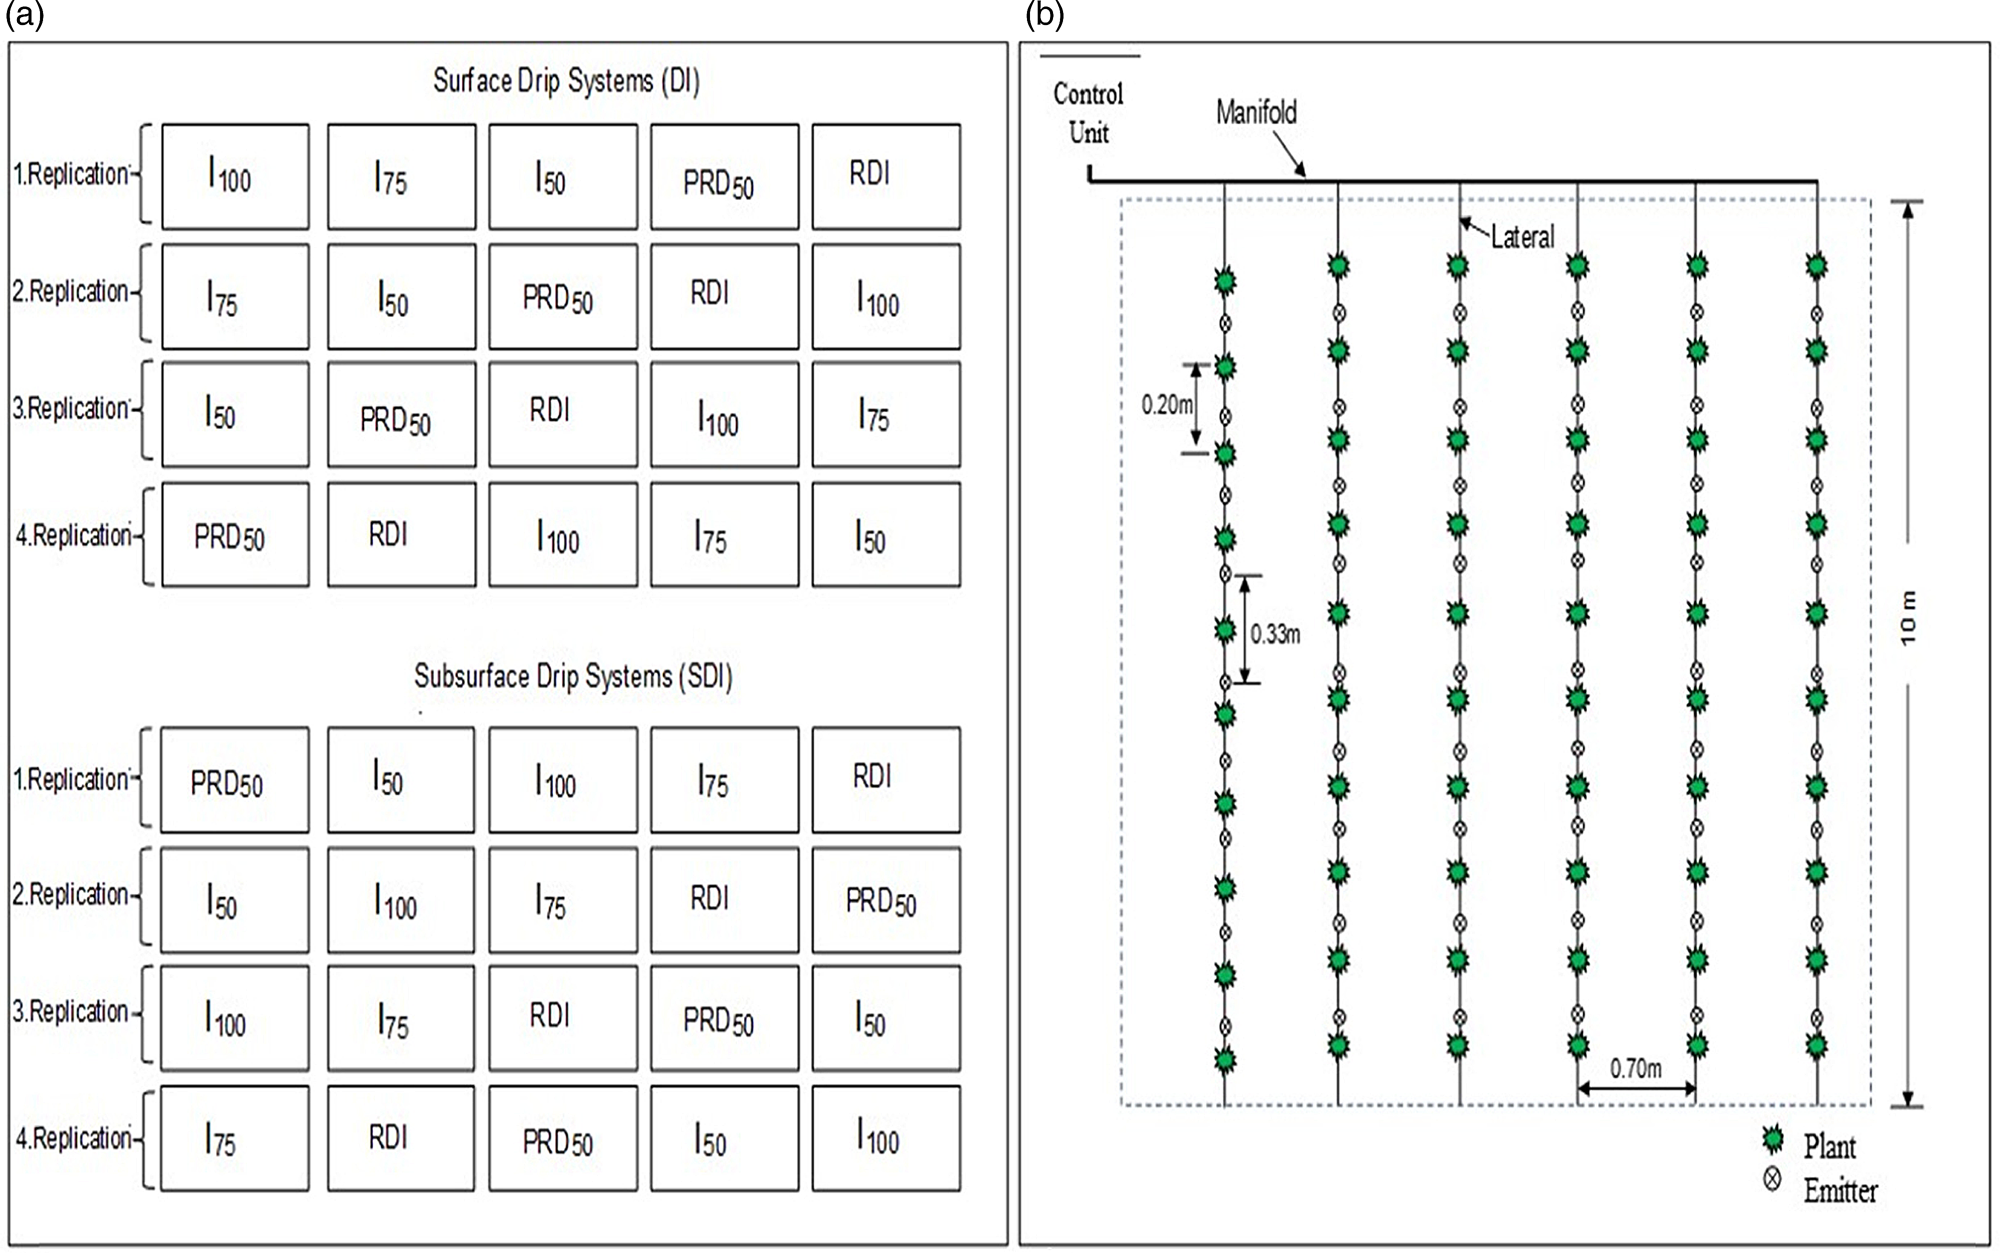
Fig. 1. Experimental design (a) and layout of the individual treatments (b).
Irrigation systems
In this study, surface- and subsurface-drip irrigation systems were used. In the surface-drip irrigation plots (DI), drip laterals with a diameter of 16 mm with in-line emitters spaced 0.33 m apart and flow rate of 2.0 litres/h at an operating pressure of 100 kPa were used. A locally produced surface-drip irrigation system (Betaplast Comp., Adana, Turkey) was used in the study. One drip lateral line was placed in the bell pepper plant rows of 0.70 m in the experimental plots except the PRD50 treatment. In PRD50 plots, two drip laterals were laid on both sides of the crop row at 15 cm away from the centre of plant row. In PRD50, plots received 50% of I100, but from the alternative drip lateral lines in each irrigation application.
In the SDI plots, drip lateral lines with in-line emitters with flow rate of 2.0 litres/h and spaced at 0.33 m (Geoflow Corte Madera, CA, USA) were placed below 20 cm of the soil surface in the raised plant beds by means of a chisel plows at 70 cm intervals. Both DI and SDI systems were laid out in the experimental plots several days before the transplantation of bell pepper seedlings.
The source of irrigation water for the experiments was from the irrigation canal passing through the experimental site, with an average electrical conductivity (EC) of 0.74 dS/m. A centrifugal pump was used at the pump station to pressurize the irrigation systems.
Plant material and agronomic details
Sowing took place on 29 March 2016 and 21 March 2017, in polystyrene trays, in a peat moss-based substrate recommended for vegetable seedbeds. The seeds were germinated in a greenhouse. Thereafter, 21 days old seedlings of Zafer bell pepper (Capsicum annuum L.) were transplanted into the experimental plots with row spacing of 70 cm and in-row plant spacing of 20 cm on 19 April 2016 and 11 April 2017 in the experimental years. This cultivar was chosen because of its adequate adaptation to the soil and climate conditions in the area, and its high productivity under open field cultivation. A composite fertilizer of 50 kg/ha N, 50 kg of P2O5 and 50 kg K2O (15%–15%–15% N, P2O5, K2O) was applied to the strips parallel to the plant rows and incorporated into the soil prior to the bell pepper seedlings transplanted in the trial plots. The remaining amount of N fertilizer was applied to the plots by fertigation by dissolving 1.25 kg of urea (46% N) in water at fertilizer tank, each irrigation starting 3 weeks after transplanting. Thus, all treatment plots received 164 kg/ha of N by means of fertigation and the total amount of N applied to all plots was 214 kg/ha. Other agricultural practices including weeding, pruning and chemical spraying were carried out as needed.
Measurements and data collections
Daily weather conditions during the study period were monitored using an automatic recording weather station installed on site. Weather parameters such as rainfall, maximum and minimum air temperatures, relative humidity, wind speed and solar radiation were measured on a daily basis and summarized for each growing season along with the long-term mean weather data from 1950 to 2019 in Fig. 2.
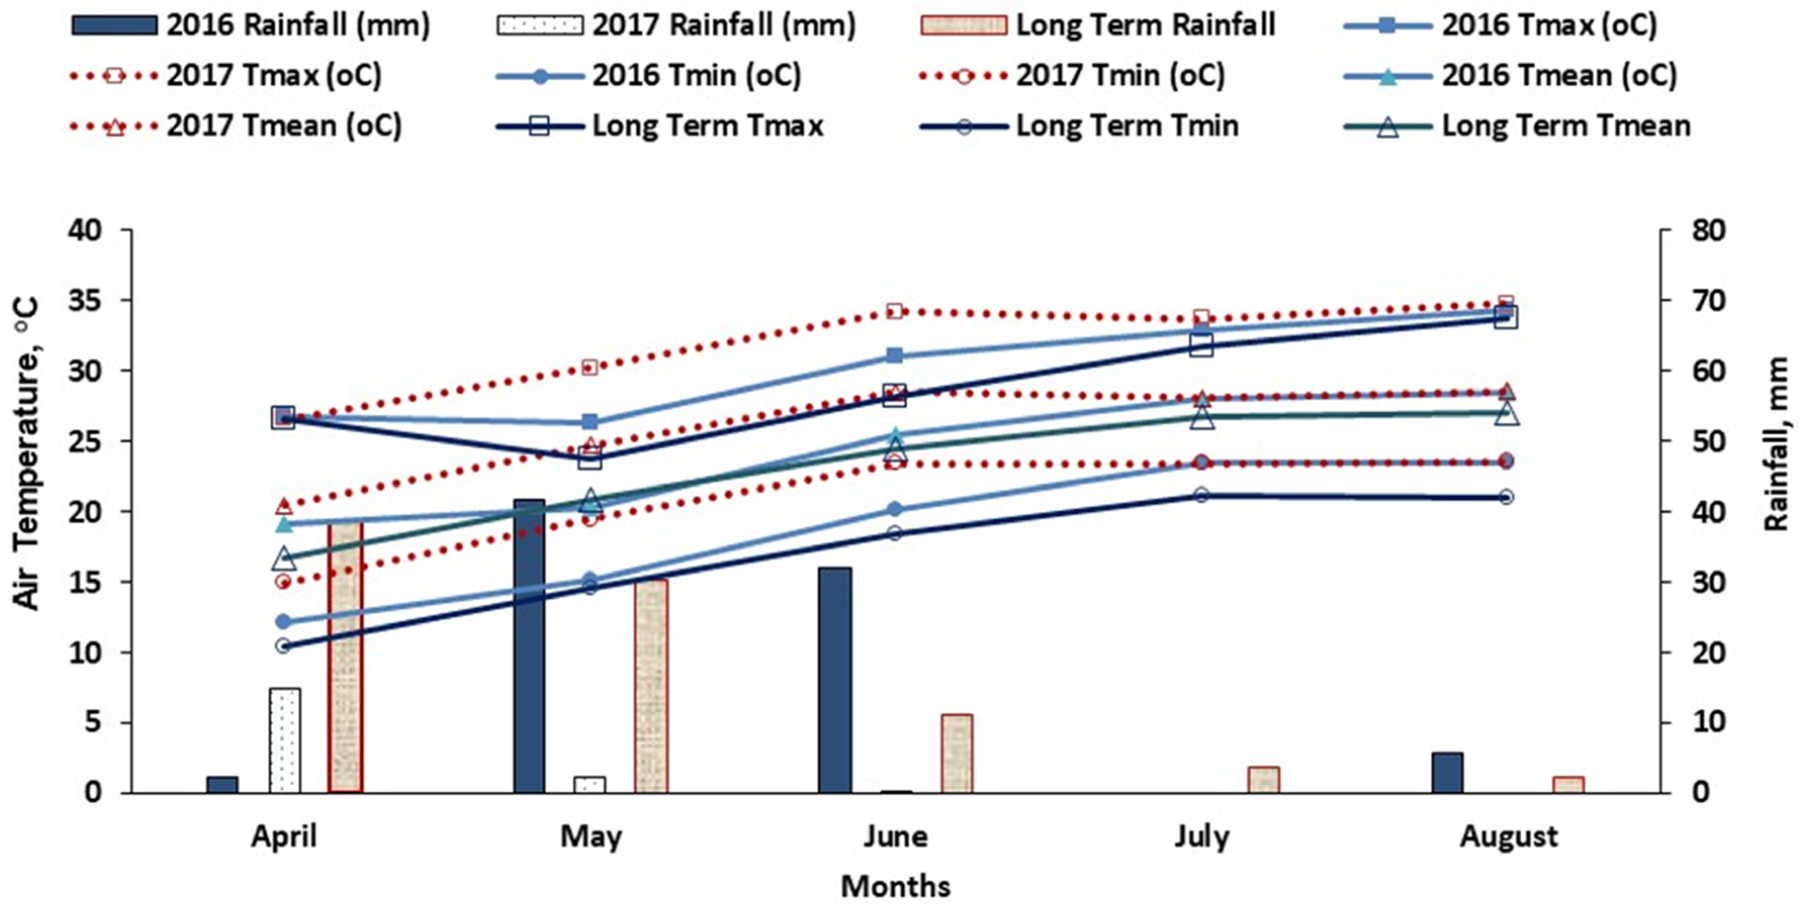
Fig. 2. Mean monthly weather data in the experimental years along with long-term means (monthly rainfalls; growing seasons’ maximum, minimum and mean air temperatures; long-term rainfall; long-term mean maximum, minimum and mean air temperatures).
Soil water content (SWC) monitoring in the experimental plots was carried out starting from the transplanting to harvest both with gravimetric method in 0–60 cm with 20 cm increments (0–20, 20–40 and 40–60 cm) and by time domain reflectometry method (TDR) in the upper soil layer of 0–20 cm. SWC sensors (SM-150, Delta T Devices, UK) connected to data loggers were placed between the two plants in the crop row at 20 cm depth at one replication for each irrigation treatment. Factory calibration of the sensors provides ±3% accuracy for mineral soils and therefore they were used directly.
Equal irrigation was uniformly applied to all treatments for the first 4 weeks after transplanting, based on 100% replacement of ETa, and, afterwards, variable amounts of water were applied according to the treatments considered. The amount of water applied to the full irrigation I100 sub-plots under DI and SDI systems was calculated with Eqn (1):

where Iv is the volume of irrigation water (L); ΔS is the soil water deficit in 40 cm root zone depth, which corresponded to approximately 25% of available water in the I100 plots (mm); A is the sub-plot area (m2); and PC is the plant cover percentage (%), which is estimated as the ratio of crop covered area to row space (70 cm). The amount of water applied to other treatments was calculated with reference to I100. All treatment plots were irrigated simultaneously.
Water balance equation was utilized for the estimation of the seasonal actual crop evapotranspiration (ETa) of bell pepper in the experimental treatments.

where ETa is crop evapotranspiration (mm); R is rainfall (mm); I is the quantity of irrigation water applied (mm); ΔSW is the change in the soil water storage in 40 cm soil depth at planting and at harvest (mm); Dp is deep percolation losses below the root-zone depth (mm); and Roff is runoff from the experimental plots (mm). Rainfall events greater than the soil water deficit in 40 cm soil depth were considered as deep percolation loss below the root-zone depth.
Plant observations were started just after the bell pepper seedling transplanting in the experimental plots and continued until the crops reached to physiological maturity. Bell pepper yields were determined by hand harvesting all the plants within the 6 m sections of the three adjacent centre rows in each plot depending on the physiological maturity of plants. The harvest area in each plot was 12.6 m2 (three rows, each 6 m long). Bell pepper was harvested five times in each experimental year. A total of five harvests were taken as the yield from an experimental treatment.
The starting and ending dates of the phenological development periods of the bell pepper plant were determined by observing the general condition of plants in the plots. The length of the total growing season was determined as 114 and 122 days for I100 treatments in the experimental years, respectively. The length of the growth period in 2017 was 10 days longer than that in 2016. The length of the growing season here represents the total time elapsed from transplanting of the seedlings in the field to the final harvest.
Yield components and quality parameters such as number of bell pepper fruit per unit area, mean fruit weight, fruit volume, fruit length and width, total soluble solids (TSS) and plant height were determined in each harvest period in the experimental years. Fruit numbers per plant and the weight of each fruit for the selected 10 plants per treatment plot were recorded at each harvest. TSS content in juice was determined by an Atago N1 refractometer (Atago Co. Ltd., Japan) and expressed as Brix at 20°C.
Tc were measured with a hand-held IRT (Everest Interscience model 100L DL, USA). Tc measurements were taken from four different corners of the plots at around 1.5 m distance from the bell pepper plant canopies. IRT measurements were made between solar noon time (12:00 and 14:00 h local standard time) under clear sky conditions. Dry- and wet-bulb temperatures were measured with an aspirated psychrometer in the open area near the experimental plots. The mean VPD was computed as the average of the calculated instantaneous wet and dry bulb temperatures and the standard psychrometer equation (List, Reference List1971) with a mean barometric pressure of 101.25 kPa. Thus, CWSI, lower and upper limits were calculated by following the empirical approach outlined by Idso et al. (Reference Idso, Jackson, Pinter, Reginato and Hatfield1981).

where LL is the lower baseline and UL is the non-transpiring upper baseline; Tc = canopy temperature (°C); Ta = air temperature (°C). LL was determined using data collected only from the unstressed treatments (I100). To verify the upper baseline, Tc of the fully stressed plants in the non-irrigated plots were determined several times during the growing season of bell pepper.
Economic evaluation
An economic analysis was conducted for estimating the net benefit generated by experimental treatments considered in the study. The net benefit or net return was estimated as the difference between total production costs and gross incomes per unit area (Sezen et al., Reference Sezen, Şengül, Baytorun, Daşgan, Akyildiz, Tekin, Onder, Agcam, Akhoundnejad and Gügercin2015). Information on the production costs and sale prices of bell pepper in 2016 and 2017 was obtained from the Agricultural Provincial Directorate (APD) in Mersin (APD, 2016, 2017). Production costs include land rental, fertilizers, seed, soil cultivation, plant protection and labour costs for irrigation, harvesting and transportation costs. The total production cost of bell pepper was estimated by the sum of crop production costs, the yearly cost of the irrigation system, irrigation labour and water costs.
Statistical analysis
Analysis of variance was performed using SAS (SAS Institute, Inc., Cary, NC, USA) to determine significant differences between all measured parameters, and EXCEL software was used to plot the graphs. Comparisons of treatment means (P ≤ 0.05) at each level of irrigation were done using Least Square Difference (LSD) method.
Results
Applied irrigation water amount (I) and crop evapotranspiration (ETa)
Weather conditions were quite different in the two consecutive growing seasons of our study. When the weather conditions in the experimental years were evaluated, it was observed that the 2016 growing season was typical of the conditions that prevail in the Mediterranean region. However, the mean air temperatures in 2017 season (May through July) were several degrees greater than those in 2016 as well as long-term means. Monthly rainfalls varied between the two growing seasons. In general, the 2016 growing season was relatively wet with a total rainfall of 81.8 mm when compared with the 2017 growing season with a total rainfall of only 17.2 mm. Rainfall received in May–June period in 2016 was also greater than the long-term means (45.7 mm).
Detailed information on irrigation amounts, relative irrigation, seasonal crop water use or actual crop evapotranspiration (ETa), relative ETa, water productivity and irrigation water productivity for the different irrigation strategies under two drip irrigation methods for the experimental years was presented in a previous publication by Bozkurt Colak (Reference Bozkurt Colak2021). Therefore, brief information about these parameters will be provided below. The treatment irrigation was initiated on 20 June 2016 and 9 May 2017 and the final irrigation was applied on 8 August in both years. Both in DI and SDI plots, 2 and 3 equal and 22 treatment irrigation applications with 3–5 days intervals were made in 2016 and 2017 growing seasons, respectively. In 2016, in DI plots, the seasonal total irrigation amount varied from 335 to 545 mm; the corresponding values for the SDI plots were 307 to 489 mm. In 2017, the total amounts of irrigation water in DI treatment plots varied from 359 to 647 mm; and the corresponding values for the SDI treatment plots were 335 to 618 mm. Due to warmer weather conditions prevailed in 2017 growing season, the total amount of irrigation water applied to treatments in 2017 was 16 and 21% greater in I100 treatment plots under DI and SDI, respectively, than those in 2016. RDI plots received 5.0 and 19.3% less water than I100 plots under DI and SDI, respectively, in 2016; the corresponding vales were 11.9 and 9.9% in 2017.
Actual crop ETa values ranged from 484 mm in PRD50 to 693 mm in I100 in DI and varied between 456 mm in PRD50 and 635 mm in I100 in SDI plots in 2016 growing season. In 2017, ETa values varied from 529 mm in PRD50 to 797 mm in I100 in DI plots; and varied between 501 and 760 mm in SDI plots. In 2016, ETa values in I75 and RDI treatments in DI system were 587 and 669 mm, respectively. The corresponding values for the SDI were 548 and 618 mm, respectively. RDI treatments used 3.5 and 10% less water than I100 in DI and SDI, respectively, in 2016; and corresponding values for 2017 were 11.9 and 5.7%. The results revealed that the highest and the lowest ranges of water consumption were found in the I100 and PRD50 treatments in both experimental years. Bell pepper plants in PRD50 consumed slightly less water as compared to I50 in both experimental years although these two treatments received the same amount of water.
Variation of soil water content
Fluctuations in the SWC with time in the 0–20 cm upper soil layer for the different treatments under DI and SDI in 2016 and 2017 growing season are depicted in Figs 3(a) and (b). As shown in Figs 3(a) and (b), variations in SWC have shown similar trends during the experimental periods for DI and SDI systems for the same irrigation treatment. SWC in the 0.20 m soil depth decreased gradually towards the physiological maturity period in all treatments in the experimental years. The highest SWC were found in I100 plots both under DI and SDI systems and SWC remained above 25% of available water throughout the growing seasons except towards the end of growing seasons during which it fell below 25% level. In RDI plots, SWC decreased gradually during vegetative growth stage until flowering since this treatment received 50% of water that applied to I100 under DI and SDI systems. However, RDI received the same amount of water as I100 following flowering growth stage. Therefore, SWC in RDI plots remained just below the I100 treatment throughout the growing seasons. In I50 and PRD50, SWC remained below 50% available water during most of the growing seasons. SWC values in I50 and PRD50 plots were found to be around the wilting point starting from the late June under DI and SDI systems in 2016 and 2017 growing seasons. It was observed that SWC in the I75 treatment also was maintained relatively high as compared to DI50 and PRD50 treatments, in which SWC variations were the greatest among the treatments, and water stress gradually build up towards the end of growing season in these treatments.

Fig. 3. Soil water storage variation in 20 cm soil depth under the different treatments: (DI-20 cm) SWC in DI in 2016; (SDI-20 cm) SWC in SDI in 2016 (treatments: I100, full irrigation; I75, deficit irrigation; I50, deficit irrigation; PRD50, partial root-zone drying; RDI, regulated deficit irrigation). Soil water storage variation in 20 cm soil depth under the different treatments: (DI-20 cm) SWC in DI in 2017; (SDI-20 cm) SWC in SDI in 2017 (treatments: I100, full irrigation; I75, deficit irrigation; I50, deficit irrigation; PRD50, partial root-zone drying; RDI, regulated deficit irrigation).
Bell pepper yield, yield components and quality
Total fresh bell pepper yields, yield components and quality parameters for the different treatments in the experimental years are presented in Table 2. The statistical analysis of the yield and quality parameters are summarized in Table 3 and Figs 4(a)–(i). Statistical evaluations of the results for bell pepper yields and quality parameters obtained during two experimental years showed the prevailing effect of the different weather conditions during the study. For this reason, the yields and quality parameters data obtained in 2016 and 2017 were evaluated separately. Fresh bell pepper yields varied from 45.5 t/ha in PRD50 to 75.7 t/ha in I100 in DI system; and changed between 54.1 t/ha in PRD50 and 74.2 t/ha in I100 under SDI system in 2016. In 2017, yields ranged from 45.4 t/ha in PRD50 to 70.6 t/ha in I100 under DI system, and changed from 46.4 t/ha in PRD50 to 71.5 t/ha in I100 under SDI system. PRD50 produced the lowest yield as 49.8 and 45.9 t/ha, respectively, in the experimental years. Irrigation treatments had significantly different effect on total yield (P < 0.01); however, irrigation systems did not have significant effect of yield in the experimental years.

Fig. 4. Comparison of mean values averaged over two drip systems for the different treatments in the experimental years. (a) Yield; (b) fruit number; (c) yield per plant; (d) fruit volume; (e) fruit width; (f) fruit length; (g) fruit weight; (h) total soluble solid; (i) plant height (treatments: I100, full irrigation; I75, deficit irrigation; I50, deficit irrigation; PRD50, partial root-zone drying; RDI, regulated deficit irrigation).
Note. Vertical bars represent standard error among four independent replicates. Different lowercase letters indicate significant differences at P < 0.01, except fruit weight in the first year P < 0.05.
Table 2. Bell pepper total yield, fruit number, yield per plant, fruit volume, fruit width, fruit length, fruit weight, total soluble solid and plant height values under different treatments in the experimental years

DI, surface drip; SDI, subsurface drip; I100, full irrigation; I75, deficit irrigation; I50, deficit irrigation; PRD50, partial root-zone drying; RDI, regulated deficit irrigation.
Different lowercase letters indicate significant differences. **LSD grouping at P < 0.01 level; *LSD grouping at P > 0.05, P > 0.05; ns, not significant.
Table 3. Statistical analysis results on yield, fruit number, yield per plant, fruit volume, fruit width, fruit length, fruit weight, total soluble solid and plant height of bell pepper under different treatments in the experimental years

LSD, least significant difference; CV, coefficient of variation; DI, surface drip; SDI, subsurface drip; I100, full irrigation; I75, deficit irrigation; I50, deficit irrigation; PRD50, partial root-zone drying; RDI, regulated deficit irrigation.
**LSD grouping at P < 0.01 level; *LSD grouping at P > 0.05, P > 0.05; ns, not significant.
Irrigation regimes had significantly different effect on fruit number per unit area in 2016; however, in the second year both irrigation regimes and irrigation systems had significant effect on fruit numbers (Table 3 and Fig. 4(b)). I100 treatment produced greatest number of fruits in the experimental years followed by RDI. PRD50 resulted in the lowest number of fruits in the study years. In the first year of the study, the lowest fruit number values were obtained as 1.06×10⁶/ha in DI-PRD50, and the highest fruit number values were obtained as 1.63×10⁶/ha for DI-I100. In the second year, the lowest fruit number values were found in DI-PRD50 as 1.14×10⁶/ha for irrigation, and the highest fruit number values were observed both in DI-I100 and SDI I100 as 1.69×10⁶/ha (Table 2).
The yield per plant values for the different irrigation treatments and two drip irrigation methods for both experimental years (2016 and 2017) are given in Table 2. Yields per plant varied from 0.80 kg in PRD50 to 1.32 kg in I100 in DI system; and changed between 0.95 kg in PRD50 and 1.30 kg in I100 under SDI system in 2016. In 2017, yields per plant varied from 0.79 kg in PRD50 to 1.24 kg in I100 under DI system, and changed from 0.81 kg in PRD50 to 1.25 kg in I100 under SDI system. Both in 2016 and 2017 experimental years, PRD50 produced the lowest yield per plant as 0.87 and 0.80 kg, respectively. As indicated in Table 3 and Fig. 4(c), there was no significant difference in yields between the surface- and subsurface-drip irrigation systems in the experimental years. However, irrigation treatments resulted in significantly different yields per plant in 2016 and 2017 growing seasons (P < 0.01). In the 2016 development period of the study, higher yield per plant values were obtained as compared to 2017. RDI produced significantly greater yield per plant than I75, I50 and PRD50 treatments but lower than I100 plots in both experimental years.
Full irrigation regimes under both drip systems produced the greatest mean fruit volume in the experimental years. RDI and I75 treatments had greater fruit volume values as compared to I50 and PRD50 but lower than I100 treatment. Water stress reduced the fruit volume in PRD50 and I50 treatments under both drip systems. Mean fruit volume values varied from 108.3 cm3 in DI-PRD50 to 168.2 cm3 in DI-I100. In the second years of the study, irrigation regimes on the fruit volume were found to be statistically significant (P < 0.01). Mean fruit volume values varied from 90.8 cm3 in DI-PRD50 to 163 cm3 in DI-I100 (Table 2). In the first years of the study, irrigation systems and irrigation systems × irrigation regimes interactions on the fruit volume were found to be statistically significant (P < 0.05). Irrigation regimes on the fruit volume were found to be statistically significant (P < 0.05) (Table 3 and Fig. 4(d)).
Mean fruit width values varied from 5.58 cm in I50 to 6.40 cm in I100 under DI, varied between 5.0 cm in I50 and 5.97 cm in I100 under SDI in 2016; and varied from 5.14 cm in PRD50 to 6.36 cm in I100 in DI, changed between 5.59 cm in PRD50 and 6.24 cm in I100 in SDI in 2017 (Table 2). In the first year of the study, irrigation systems and irrigation regimes on the fruit width were found to be statistically significant (P < 0.01). In the second year, the effect of different irrigation systems and the irrigation systems, irrigation system × irrigation regimes interaction on the fruit width was found to be significant at P < 0.05 and P < 0.01, respectively (Table 3 and Fig. 4(e)).
Mean fruit length values varied from 5.69 cm in PRD50 to 6.60 cm in I100 under DI, varied between 5.48 cm in PRD50 and 6.25 cm in I100 under SDI in 2016; and varied from 5.71 cm in I50 to 6.76 cm in I100 in DI, changed between 5.90 cm in PRD50 and 6.99 cm in I100 in SDI in 2017 (Table 2). In the first years of the study, the effect of irrigation systems and irrigation regimes on the fruit length was found to be statistically significant (P < 0.01). In the second year, the effect of different irrigation regimes on the fruit length was found to be significant at P < 0.01 (Table 3 and Fig. 4(f)).
Mean fruit weight values changed from 41.2 g in I50 to 46.5 g in I100 under the DI, varied between 43.5 g in PRD50 and 48.0 g in I100 under SDI in 2016; and varied from 41.2 g in I50 to 47.5 g in I100 in DI, changed between 44.6 g in I50 and 47.9 g in I100 in SDI in 2017 (Table 2). In general, fruit weight values decreased with increasing water stress. Both irrigation systems and irrigation regimes had significantly different effect on fruit weight (P < 0.01 and P < 0.05) (Table 3 and Fig. 4(g)).
Total soluble solute (TSS) values varied from 5.18 g/100 g in I100 to 5.61 g/100 g in I50 under the DI, and changed between 5.13 g/100 g in I75 and 5.33 g/100 g in PRD50 in 2016; and varied between 5.10 g/100 g in I100 and 5.80 g/100 g in I50 in SDI in 2017 (Table 2). In both experimental years, irrigation regimes had significantly different effect on TSS values (P < 0.01). Higher TSS values were obtained in water stress treatments of I50 and PRD50 (Table 3 and Fig. 4(h)).
Plant height values varied between 73 cm in PRD50 and 89 cm in I100 in DI, and SDI in 2016; varied from 66 cm in PRD50 to 83 cm in I100 in DI, changed between 67 cm in PRD50 and 85 cm in I100 in SDI in 2017 (Table 2). Irrigation systems had significant effect on the plant height in the experimental years (P < 0.01) (Table 3 and Fig. 4(i)). Water stress reduced the plant height under both drip systems in the experimental years.
Crop water stress index (CWSI)
In this study, the upper limit (UL) and lower limit (LL) equations were developed for the bell pepper following the Idso's empirical approach as: UL = −0.0099 VPD + 4.362; and LL = −2.1895 VPD – 0.5539. Since the slope value in the UL equation was small, UL was taken as 4.36°C. The variations in CWSI prior to irrigations for the different treatments during the growing seasons are shown in Figs 5(a)–(d). Seasonal mean CWSI values for DI treatments in the first year varied from 0.16 in I100 to 0.63 in PRD50; for SDI treatments, CWSI varied from 0.13 in I100 to 0.61 in PRD50. In the second year, seasonal mean CWSI values for DI treatments varied between 0.13 in I100 and 0.58 in PRD50, and for SDI treatments CWSI varied from 0.15 in I100 to 0.61 in I50 and PRD50. RDI and I75 treatments under both drip systems had lower CWSI values than I50 and PRD50. In 2016, mean CWSI values for I100, I75, RDI, I50 and PRD50 were 0.22, 0.31, 0.27, 0.52 and 0.53, respectively, under DI, and corresponding mean CWSI values for these treatments were 0.19, 0.28, 0.25, 0.49 and 0.52, respectively, under SDI. In 2017, mean CWSI values for I100, I75, RDI, I50 and PRD50 were 0.20, 0.29, 0.24, 0.48 and 0.50, respectively, under DI, and mean CWSI values for I100, I75, RDI, I50 and PRD50 were 0.20, 0.30, 0.25, 0.51 and 0.52, respectively, under SDI.

Fig. 5. Crop water stress index (CWSI) variation during the 2016 and 2017 bell pepper growing seasons in all treatments under surface and subsurface drip irrigation: (a) CWSI in DI in 2016; (b) CWSI in SDI in 2016; (c) CWSI in DI in 2017; (d) CWSI in SDI in 2017.
Note. Vertical bars represent the mean ± s.e. (n = 19).
Relationships between CWSI, yield, yield per plant, total soluble solid, ETa, fruit weight and plant height
The relationships between CWSI (as the independent variable) and bell pepper yield, yield per plant, TSS, ETa, fruit weight and plant height (as the dependent variable) in the experimental years are presented in Figs 6(a)–(f) and 7(a)–(f), respectively. For the growing seasons, the relationship between CWSI and yield had high determination coefficients that yielded R 2 = 0.98 for DI and 0.99 for SDI in the first and second years, corresponding values were R 2 = 0.99 and 0.95, respectively. The relationship between CWSI and yield per plant was expressed with a significant quadratic equation with high determination coefficients of R 2 = 0.96 for DI and 0.99 for SDI in the first and second years, corresponding values were R 2 = 0.96 and 0.90, respectively. A second-order polynomial equation best describes the relations between CWSI and TSS with high determination coefficients of R 2 = 0.97 for DI and 0.75 for SDI in the first and second years, corresponding values were R 2 = 0.85 and 0.90, respectively. The significant relationship between CWSI and ETa was determined with high determination coefficients of R 2 = 0.99 for DI and 0.97 for SDI in the first and second years, corresponding values were R 2 = 0.85 and 0.80, respectively. The significant relationship between CWSI and fruit weight was determined with high determination coefficients of R 2 = 0.85 for DI and 0.99 for SDI in the first and second years, corresponding values were R 2 = 0.99 and 0.99, respectively. The significant relationship between CWSI and plant height was determined with high determination coefficients of R 2 = 0.83 for DI and 0.77 for SDI in the first and second years, corresponding values were R 2 = 0.99 and 0.99, respectively. The relationship obtained between yield and CWSI may be used to predict the yield potential of bell pepper.

Fig. 6. The relationships between crop water stress index (CWSI) and yield (a), yield per plant (b), total soluble solid (c), evapotranspiration (ETa) (d), fruit weight (e) and plant height (f) in the 2016 growing season.
Note. **LSD grouping at P < 0.01 level; *LSD grouping at P > 0.05, P > 0.05; ns (not significant).

Fig. 7. The relationships between crop water stress index (CWSI) and yield (a), yield per plant (b), total soluble solid (c), evapotranspiration (ETa) (d), fruit weight (e) and plant height (f) in the 2017 growing season.
Note. **LSD grouping at P < 0.01 level; *LSD grouping at P > 0.05, P > 0.05; ns, not significant.
Economic evaluation
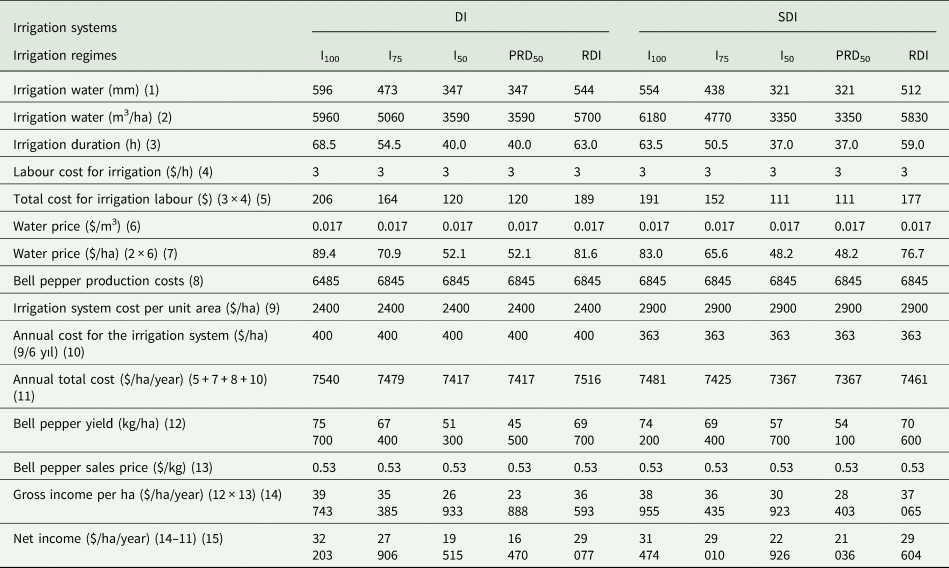
An economic analysis was carried out based on the 2 years’ average data on investment, operation and production costs obtained from the APD in Mersin (APD 2016, 2017), and the results are given in Table 4. Economic analysis showed that the highest net income was generated as US$32203/ha with the full irrigation treatment under the surface-drip (DI I100) treatment followed by the SDI I100 treatment with US$31474/ha. RDI (US$29077/ha and US$29604/ha for DI and SDI) treatment produced relatively higher net return values as compared with I50 and PRD50 treatments. The lowest net return was generated by DI PRD50 treatment with US$16470/ha.
Table 4. Economic analysis of the different irrigation treatments under the surface and subsurface irrigation systems
DI, surface drip; SDI, subsurface drip; I100, full irrigation; I75, deficit irrigation; I50, deficit irrigation; PRD50, partial root-zone drying; RDI, regulated deficit irrigation.
Numbers in parenthesis represent column numbers, and how the values in each column are calculated.
It is charged over 1$ = 3.33 TL in pricing.
Discussion
The seasonal actual crop ETa values were generally greater in the 2017 than in 2016 due to prevailing greater air temperatures and less amounts of rainfall during the 2017 growing season. Bell pepper plants under surface-drip plots used 8.4 and 4.6% more water than subsurface-drip plots for the I100 treatments in 2016 and 2017 seasons, respectively, due to reduced surface evaporation from the SDI plots. Since SDI kept the surface soil dry, it decreased the evaporation, and thereby reduced the water consumption of bell pepper. Similar findings were reported by Kong et al. (Reference Kong, Li, Wang and Huo2012) that seasonal actual crop water use (ETa) of bell pepper under SDI plots was lower than under DI plots. They reported that the minimum and maximum ETa were found for DI plots (362–451 mm) and SDI plots (301–438 mm), respectively. Crop water use decreased with increasing water stress as observed in I50 and PRD50 treatments in which SWC gradually decreased below 50% of available water just after flowering growth stage and fell below 50% level during fruit set and maturation periods. Several studies on drip irrigated bell pepper documented that the ETa values varied from 715 to 1412 mm in SDI treatment; and 765 to 1475 mm in DI treatments in Southeast Anatolia region of Turkey (Kirnak et al., Reference Kirnak, Kaya, Taş and Higgs2003); ETa values ranged between 309 and 528 mm in Mediterranean region of Turkey (Sezen et al., Reference Sezen, Yazar and Eker2006); ETa ranged between 322 and 796 mm in Thrace region of Turkey (Demirel et al., Reference Demirel, Genc and Sacan2012); varying between 493 and 592 mm (Tanaskovik et al., Reference Tanaskovik, Cukaliev, Kanwar, Heng, Markoski and Spalevic2016); Karam and Nangia (Reference Karam and Nangia2016) determined seasonal ETa using weighing lysimeter as 506 mm for bell pepper for a total growing period of 112 days from transplantation to third harvest. Present findings comply with most of the earlier findings reported.
Water stress significantly reduced fresh bell pepper yields in both experimental years (P < 0.05). Bell pepper yields were greater in 2016 growing season than that those in 2017. The reason for this difference in yield between the years could be attributed to higher temperatures prevailed during flowering stage in 2017. As indicated in Table 3, there was no significant difference in yields between the surface- and subsurface-drip irrigation systems in the experimental years. Although there is no significant difference in yield values between the two irrigation systems, all treatments except I100 produced greater yield under SDI than DI. However, irrigation treatments resulted in significantly different yields in 2016 and 2017 growing seasons (P < 0.01). Since there was no significant difference between the two drip systems regarding the yield values, statistical comparisons of the mean yields were made on yields averaged over the two drip systems (Fig. 4(a)). In both growing seasons, I100, RDI and I75 treatments resulted in similar yields except I75 in 2017, and significantly greater yields than I50 and PRD50. I75 treatment produced significantly greater yield than PRD50 and I50. Although PRD50 and I50 treatments received the same amount of irrigation water, I50 resulted in higher yields than PRD50. PRD50 reduced yields by 30.9 and 28.5% in DI and SDI systems, respectively, in 2016; and the corresponding yield reduction was 36.5 and 35.1% in 2017. Water stress occurring in I50 and PRD50 significantly reduced bell pepper yield under both drip systems. As mentioned earlier, SWC in these two treatments remained below 50% available water level during most of the growing seasons. RDI saved 5 and 12% water (average value 8.5%) as compared with I100 under DI; and 10 and 6% (averaged over 2 years 8.0%) under SDI system, respectively, in the experimental years. I75 treatment resulted in an average water saving of 20.6 and 26.7% for DI and SDI, respectively. Average yield reductions of 6.8 and 9.9% were observed for I75 under SDI and DI, respectively, as compared to I100. Delfine et al. (Reference Delfine, Tognetti, Loreto and Alvino2002) demonstrated that photosynthetic limitations in bell pepper plants growing in the field and subjected to moderate stress conditions were mainly due to decreasing stomatal conductance. Thus, lower yields obtained from I50 and PRD50 treatments were because of the water stress that reduces the stomatal conductance. Many studies confirmed that reductions in water supplied during pepper growth have an advance effect on final yield. For high yield, an adequate water supply is required during the whole crop cycle (Delfine et al., Reference Delfine, Tognetti, Loreto and Alvino2002; Dorji et al., Reference Dorji, Behboundian and Zegbe-Dominguez2005; Sezen et al., Reference Sezen, Yazar and Eker2006; González-Dugo et al., Reference González-Dugo, Orgaz and Fereres2007); Sezen et al. (Reference Sezen, Yazar and Eker2006) have reported drip irrigated bell pepper yield varying from 21.0 to 35.3 t/ha in Mediterranean region of Turkey.
TSS of pepper fruit and fruit size are important parameters to evaluate fruit quality. The results revealed that irrigation regimes had significantly different effect on TSS values (P < 0.01) in both experimental years. Higher TSS values were obtained in water stress treatments of I50 and PRD50. Hsiao (Reference Hsiao1993) stated that restricted plant size and reduced assimilate availability at the time of fruit development and maturation caused by water stress, as the major causes of the reduced number of fruits, thus lower yields. The water deficit during the period between flowering and fruit development reduced final fruit production (Jaimez et al., Reference Jaimez, Vielma, Rada and Garcia-Nunez2000; Fernandez et al., Reference Fernandez, Gallardo, Bonachela, Orgaz, Thompson and Fereres2005 and Dorji et al., Reference Dorji, Behboundian and Zegbe-Dominguez2005; Sezen et al., Reference Sezen, Yazar and Eker2006). It was observed in the present study that in general, fruit weight values decreased with increasing water stress. Both irrigation systems and irrigation regimes had significantly different effect on fruit weight (P < 0.01 and P < 0.05). Full irrigation regimes under both drip systems produced the greatest mean fruit volume in the experimental years. RDI and I75 treatments had greater fruit volume values as compared to I50 and PRD50 but lower than I100 treatment. Water stress reduced the fruit volume in PRD50 and I50 treatments under both drip systems. Reduction in the yield of bell pepper under DI might be due to the reduction in fruit size and numbers (Fernandez et al., Reference Fernandez, Gallardo, Bonachela, Orgaz, Thompson and Fereres2005). Reduction in pepper fruit size and numbers appears as the controlling factor for fruit yield (Sara et al., Reference Sara, Sayyed, Mohammad and Hamid2017). In the present study, DI significantly reduced crop yield in terms of fresh mass of fruit per plant.
Dorji et al. (Reference Dorji, Behboundian and Zegbe-Dominguez2005) compared traditional drip system irrigation to DI (I50) and PRD drip system irrigation for hot pepper irrigation and found that water savings with I50 and PRD50 were about 50% of traditional drip irrigation. However, the I80 and I60 treatments caused significant reductions in pepper yields through a reduction in fruits number per square metre and average fruit weight in comparison with I100 treatment. The RDI method can save a substantial amount of water and maintain yield in bell pepper production. Similar data were reported by Kang et al. (Reference Kang, Zhang, Hu, Li and Jerie2001) in hot pepper grown under water stress. The findings of the present study confirm these findings by Nagaz et al. (Reference Nagaz, Masmoudi and Mechlia2012) and Kang et al. (Reference Kang, Zhang, Hu, Li and Jerie2001). Gadissa and Chemeda (Reference Gadissa and Chemeda2009) concluded that in areas where water shortage prevails depth of irrigation can be lowered up to 75% of its full supply for the production of green pepper under the normal planting method with 25% water saving and 22.8% yield reduction. Thus, RDI and I75 irrigation treatments can save substantial irrigation water while producing similar yields with full irrigation under the Mediterranean climatic conditions.
The experimental results indicated that I100 treatment resulted in lowest CWSI, and I50 and PRD50 resulted in the highest CWSI in the experimental years. In general, as the irrigation water applied increased, CWSI decreased. The SWC was consistent with the CWSI values in I50 and PRD50, which had the largest soil water stress levels and greater CWSI values, while the highest irrigation level (I100) had the smallest soil water stress levels and lower CWSI values. Slightly lower CWSI values were determined in SDI plots than those in DI plots; however, the difference between the CWSI values in SDI and DI treatments was not significant. As shown in Figs 5(a)–(d), CWSI values increased gradually towards the end of season in all treatments. RDI and I75 treatments under both drip systems had lower CWSI values than I50 and PRD50. Mean CWSI values for RDI averaged over 2 years were 0.26 for DI and 0.25 for SDI; and for I75, mean CWSI values were 0.30 and 0.29.
The CWSI has been used in numerous studies on irrigation management. In most of the studies on effects of water stress on vegetables, CWSI increased with increased levels of water stress. Overall, the CWSI is responsive to water stress and has the potential to determine crop responses to water stress. Aladenola and Madramootoo (Reference Aladenola and Madramootoo2014) reported that average maximum CWSI thresholds of 0.3 and 0.4 for loamy sand and clay soil, respectively, can be used to schedule irrigation, beyond which the bell pepper will suffer stress. Sezen et al. (Reference Sezen, Yazar and Tekin2019) reported similar results that the full irrigation treatment had lower CWSI (0.25–0.27) for red pepper under the Mediterranean climatic conditions. In the present study, an average CWSI value of 0.20 was found for full irrigated bell pepper under DI and SDI systems.
In general, the CWSI correlated significantly (P < 0.01) and negatively with yield, yield per plant, TSS, ETa, fruit weight and plant height indicating that the yield of bell pepper declined with increasing CWSI values. All these relations are best described by significant second-order polynomial equations. In the most studies, CWSI results are consistent with yield results, and yield varied linearly with the CWSI in eggplant (Bozkurt Çolak et al., Reference Bozkurt Çolak, Yazar, Çolak, Akça and Duraktekin2015), broccoli (Erdem et al., Reference Erdem, Arin, Erdem, Polat, Deveci, Okursoy and Gültas2010), pepper (Aladenola and Madramootoo, Reference Aladenola and Madramootoo2014; Sezen et al., Reference Sezen, Yazar, Dasgan, Yucel, Akyıldız, Tekin and Akhoundnejad2014). Linear equations developed for each crop can be used to predict the yield of the crop when the crop is subjected to different levels of water stress.
Conclusions
The main focus of this study was to investigate physiological and yield response of bell pepper to various DI strategies applied with surface- and subsurface-drip systems under the Mediterranean climatic conditions. RDI appeared to be a good alternative to full irrigation since it produced statistically similar yield to I100 treatment in both experimental years under both drip systems. The highest net income was generated with the full irrigation treatment under the surface-drip (DI I100) treatment followed by the SDI I100 and RDI treatments. An average CWSI value of approximately 0.20 just before irrigation can be used for irrigation scheduling of bell pepper to achieve high bell pepper yields. In general, the CWSI correlated significantly (P < 0.01) with bell pepper yield, yield per plant, TSS, ETa, fruit weight and plant height indicating that bell pepper yield declined with increasing CWSI values. In conclusion, RDI is recommended along with conventional DI (I75) in Mediterranean area.
Author contributions
Y. B. C. and A. Y. conceived and designed the study. M. Y., E. G. and A. A. conducted data gathering. S. T. performed statistical analyses. Y. B. C. and A. Y. wrote the article.
Financial support
The authors would like to thank the Turkish Scientific and Technical Research Council (TUBITAK) for its financial support for the project TUBITAK ERA-NET-215O951.
Conflict of interest
None.
Ethical standards
Not applicable.


