


Introduction
To feed the world's growing population, many agricultural systems require the frequent application of mineral N fertilizers to attain high herbage yields. The intensification of agricultural systems has caused an increase in absolute N losses and GHG emissions due to increased animal numbers and higher feed and/or fertilizer inputs (Ghahramani et al., Reference Ghahramani, Howden, del Prado, Thomas, Moore, Ji and Ates2019). Nitrogen (N) fertilizer is a major contributor to ammonia (NH3) emissions from urea-based fertilizers and to greenhouse gas (GHG) emissions through nitrous oxide (N2O) losses from calcium ammonium nitrate (CAN)-based fertilizers (Halvorson et al., Reference Halvorson, Snyder, Blaylock and Del Grosso2014; Krol et al., Reference Krol, Forrestal, Wall, Lanigan, Sanz-Gomez and Richards2020; Wang et al., Reference Wang, Köbke and Dittert2020). However, pressure is increasing for agricultural production to be achieved in a more sustainable manner (Hennessy et al., Reference Hennessy, Delaby, van den Pol-van Dasselaar and Shalloo2020) and for agricultural systems to reduce their GHG emissions (Horan and Roche, Reference Horan and Roche2019; Hoekstra et al., Reference Hoekstra, Schulte, Forrestal, Hennessy, Krol, Lanigan, Müller, Shalloo, Wall and Richards2020; Lahart et al., Reference Lahart, Shalloo, Herron, O'Brien, Fitzgerald, Boland and Buckley2021). The Irish Government has set a target to reduce total GHG emissions by 51% by 2030 and agricultural GHG emissions by 25%, compared to 2018 quantities (Department of the Environment, Climate and Communications (DECC), 2022). The agricultural industry in Ireland accounts for 37% of total GHG emissions, of which 10.6% comes from N fertilizer application (Environmental Protection Agency (EPA), 2021). Nitrous oxide is a long-lived ozone-depleting GHG with a high global warming potential and N2O emitted from CAN-based fertilizers is responsible for 92.4% of total N2O emissions in Ireland (Duffy et al., Reference Duffy, Black, Fahey, Hyde, Kehoe, Murphy, Quirke, Ryan and Ponzi2020). CAN accounts for 84% of the market in fertilizers that only contain N in Ireland, in contrast to other temperate regions where urea accounts for a greater proportion, such as New Zealand and Australia. This is due to the historical promotion of CAN and questions regarding the efficacy of urea use as it is susceptible to N loss via NH3 volatilization (Forrestal et al., Reference Forrestal, Harty, Carolan, Lanigan, Watson, Laughlin, Wall, Hennessy and Richards2017). Approximately 15.5% of N in urea is volatized to the atmosphere as NH3 after application to the soil surface (EPA, 2021). Urea accounts for about 56% of the global production of N fertilizers (International Fertilizer Industry Association, 2013). The rate of NH3 volatilization may be even higher at warm temperatures and under moist soil conditions (Camberato, Reference Camberato2017). Additionally, warm and dry (i.e. low precipitation) conditions also lead to high volatilization rates, as described by Forrestal et al. (Reference Forrestal, Harty, Carolan, Lanigan, Watson, Laughlin, McNeill, Chambers and Richards2016b). Such large losses of N not only constitute an economic loss for farmers, but are also an important contribution to agriculture producing 98% of total NH3 emissions in Ireland (Forrestal et al., Reference Forrestal, Wall, Carloan, Harty, Roche, Krol, Watson, Lanigan and Richards2016a).
Therefore, there has been a growing interest in the use of N stabilisers such as urease inhibitors to reduce NH3 emissions. Nitrogen stabilisers are compounds that prolong the period of time the N component of the fertilizer remains in the urea form (Watson et al., Reference Watson, Laughlin and McGeough2009). Urease inhibitors (e.g. N-(n-butyl) thiophosphoric triamide) reduce NH3 volatilization from urea by delaying NH3 release through inhibiting the enzyme urease, which catalyses urea hydrolysis (Forrestal et al., Reference Forrestal, Harty, Carolan, Lanigan, Watson, Laughlin, McNeill, Chambers and Richards2016b). Previously, herbage production from swards receiving urea + NBPT compared to urea has been compared in studies under cutting experiments (Zaman et al., Reference Zaman, Zaman, Adhinarayanan, Nguyen, Nawaz and Dawar2013), silage harvesting protocols (Carswell et al., Reference Carswell, Shaw, Hunt, Sánchez-Rodríguez, Saunders, Cotton, Hill, Chadwick, Jones and Misselbrook2019) and sheep grazing (Suter et al., Reference Suter, Sultana, Turner, Davies, Walker and Chen2013). Forrestal et al. (Reference Forrestal, Harty, Carolan, Lanigan, Watson, Laughlin, Wall, Hennessy and Richards2017) reported that there was no difference in herbage production between CAN, urea + NBPT and urea under a cutting regime despite finding that urea + NBPT reduced NH3 losses compared to urea by 79.5% and N2O emissions by 71% compared to CAN. Forrestal et al. (Reference Forrestal, Harty, Carolan, Lanigan, Watson, Laughlin, Wall, Hennessy and Richards2017) illustrated the efficacy of urea + NBPT under a cutting regime, and one of the most cost effective and rapid ways to reduce GHG emissions from agriculture is through modification of N fertilizer use and technologies i.e. urea + NBPT and other similar type products (Lanigan et al., Reference Lanigan, Donnellan, Hanrahan, Carsten, Shalloo, Krol, Forrestal, Farrelly, O'Brien, Ryan and Murphy2018; Carswell et al., Reference Carswell, Shaw, Hunt, Sánchez-Rodríguez, Saunders, Cotton, Hill, Chadwick, Jones and Misselbrook2019). However, there was slow uptake of the new technology by the industry in Ireland (DECC, 2021).
To determine if there was a yield benefit from the application of urea + NBPT compared to other common N fertilizer types, the current study investigated the application of three fertilizer types (CAN, urea and urea + NBPT) at two fertilizer rates (150 and 250 kg N/ha per year) at four sites across Ireland, with the aim of determining what herbage growth responses occur when perennial ryegrass (Lolium perenne L.) swards are rotationally grazed. This would entail more fertilizer application splits of 8–10 applications compared to 5 applications for cutting regimes across the year. Rotational grazing also consists of a greater number of defoliation events than previous research carried out under cutting regimes, which may encourage greater growth rates (Peters et al., Reference Peters, Taube, Kluß, Reinsch, Loges and Fenger2021). Actual cattle/sheep grazing, which could impose greater variability and different stresses on the grass through defecation, urination, trampling and defoliation action that could modify or mediate responses to different fertilizer regimes, was also imposed to verify the responses observed under cutting in previous research. Two fertilizer rates were employed to strengthen industry relevance, particularly as a lower N fertilizer rate is desired to aid in reduction of N2O emissions and reflects current environmental limitations while also observing if any differences in N response at different N rates occur (Finneran et al., Reference Finneran, Crosson, O'kiely, Shalloo, Forristal and Wallace2012).
The objective of the present study was to compare the agronomic performance of CAN, urea and urea + NBPT under typical Irish temperate conditions when rotationally grazed. A secondary objective was to compare efficiencies under dry weather conditions, as there is evidence that these severe weather events are increasing in Ireland (Park et al., Reference Park Williams, Allen, Macalady, Griffin, Woodhouse, Meko, Swetnam, Rauscher, Seager, Grissino-Mayer and Dean2013). The hypothesis of the experiment was that fertilizer type would cause differing magnitudes of responses in pre-grazing herbage yield and herbage production under rotational grazing when compared under differing application rates, growing years and locations.
Materials and methods
Experimental sites
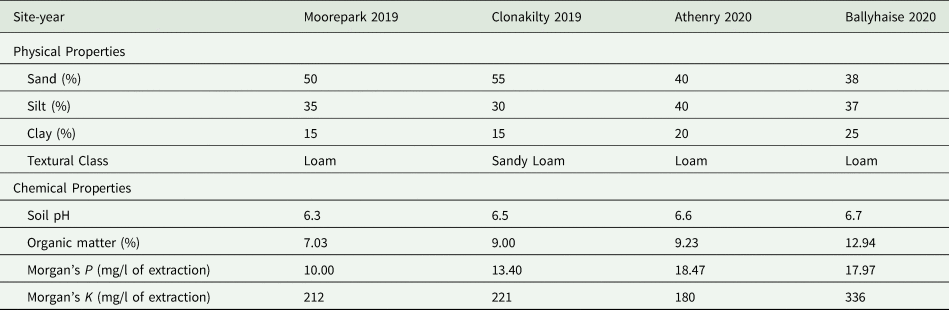
The experiment was undertaken at four sites, Teagasc Moorepark, Cork (52.16° N, 8.24° W), Clonakilty Agricultural College, Cork (51°63 N, 08°85 E), Ballyhaise Agricultural College, Cavan (54° 015′N, 07° 031′W) and Mellows Campus, Athenry, Galway (54° 80′; N; 7°25′ W). All sites were soil tested and classified before the experiment (Table 1). The perennial ryegrass swards used in the study were reseeded in 2017, 2009, 2016 and 2008 for Moorepark, Clonakilty, Athenry and Ballyhaise, respectively.
Table 1. Experimental site locations and initial soil physical and chemical characteristics
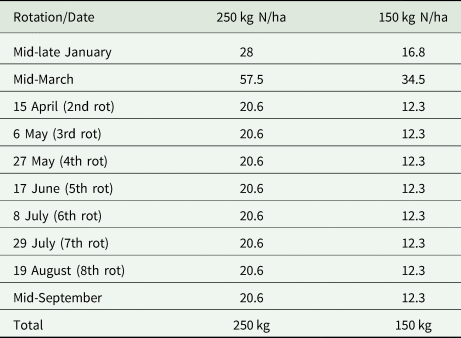
The experimental arrangement was a 3 × 2 factorial complete random block design configuration with four replications per treatment to compare CAN, urea + NBPT and urea fertilizer at two annual rates (150 and 250 kg N/ha per year). Thus, the experimental design gave rise to a total of 6 treatments (CAN at 250 kg N/ha (CAN-250), CAN at 150 kg N/ha (CAN-150), urea + NBPT at 250 kg N/ha (NBPT-250), urea + NBPT at 150 kg N/ha (NBPT-150), urea at 250 kg N/ha (Urea-250) and urea at 150 kg N/ha (Urea-150)). This was conducted from 2019 to 2021, in Moorepark and Clonakilty, with Ballyhaise and Athenry added in 2020 and 0 N plots were added in all sites from 2020 to allow for additional measurements, giving 28 plots (8 × 6 m) at each site. The 0 N plots were added to the end of each replicate at each site so additional measurements such as background N and N uptake could be quantified rather than an additional treatment to the overall study. The 0 N plots were analysed separately to the treatments. Each site had the same plot arrangement and size. Within the dataset, site and year were combined to create a new description factor called ‘site-year’ as all sites were not included every year within the dataset. The urease inhibitor NBPT (Agrotain®, Koch Fertilizer LLC, Wichita, KS, USA) was coated onto urea granules at a rate of 660 mg/kg NBPT by the fertilizer company as this was the standard level of coating when the study was established according to Watson et al. (Reference Watson, Laughlin and McGeough2009). The fertilizer application strategies are outlined in Table 2 for the 10 rotations. Fertilizer was applied by hand broadcasting after each grazing event. Plots also received sulphur (S; 20 kg/ha), phosphorus (P) and potassium (K) (0-10-20 @ 111 kg/ha) during the main grazing season to ensure other macronutrients were not limiting. There was no lime applied during the course of the experiment as all sites were at a sufficient pH concentration for herbage production (pH 6.3 to 7.2). Three sites were grazed with lactating dairy cows, whereas sheep were used in Athenry. At each site, the first grazing occurred in March, six weeks after first N application and thereafter when the CAN-250 treatment had a pre-grazing herbage yield of approximately 1500 kg of dry matter (DM)/ha (assessed visually). A target of eight to ten rounds of grazing in each year was set, as this is the recommended number of grazing's to be achieved in a productive rotational grazing system (Teagasc ‘Grass10’ campaign). The CAN-250 treatment was used as the control as this treatment represents standard practice in Ireland and ensured uniformity across sites. All plots were grazed simultaneously and the collective herbage available amongst all plots made up the available herbage for grazing. A rotation started when the animals exited the plots and ended when animals re-entered the plots for the subsequent grazing. The length of a grazing of the plots depended on the amount of herbage available and the number of animals available to graze the available herbage (information available in Supplementary material), with the aim of achieving a post-grazing sward height of 4 cm.
Table 2. Nitrogen fertilizer application schedule
Sward measurements
Prior to each grazing event, pre-grazing herbage yield was measured by harvesting one strip (5 m × 1.2 m) from each plot to 4 cm using an Etesia mower (Etesia UK Ltd., Warwick, UK) at Moorepark, Clonakilty and Athenry and by hand cutting a quadrant (0.5 × 0.5 m) by a trained technician in Ballyhaise. For the Etesia cuts, the area of the plot which was harvested was rotated each time amongst the right-side, middle and left-side of the plot to allow for variation in the plot due to urine and faeces. Similarly with the quadrant sampling cuts, cuts within plot were rotated and were taken as representative of the plot area. From all harvested samples from each plot, a 100 g subsample dried at 60°C for 48 h in a forced convection oven (Parsons Lane, Hope Valley, UK) to determine DM. These samples were then milled through a 1 mm screen using a Cyclotech 1093 Sample Mill (Foss, DK-3400 Hillerød, Denmark) on removal from the oven and scanned using near infrared spectrometry (NIRS) for crude protein content, water soluble carbohydrates (WSC) and dry matter digestibility (DMD), using the equations developed by Burns et al. (Reference Burns, Gilliland, McGilloway, O'Donovan, Lewis, Blount and O'kiely2010), which were calibrated weekly by a trained lab technician. Nitrogen uptake was calculated prior to each grazing event from the crude protein content using the following equations:


Total annual N uptake in terms of 0 N yields could only be calculated for 2020 and 2021 when the 0 N yields were included in the experiment.
A folding pasture plate meter with a steel plate (Jenquip, Fielding, New Zealand) was used to measure ten compressed sward heights before and after harvesting on each cut area and also for the pre- and post-grazing sward height, on each plot. Sward density (kg DM/ha per cm) was calculated as (Delaby et al., Reference Delaby, Peyraud, Bouttier and Peccatte1998):

Sward density was then used to calculate herbage removed:

Total annual herbage production was the sum of each rotation's yield calculated as:

For the first rotation a previous post-grazing yield of 100 kg DM/ha was assumed.


Weather data
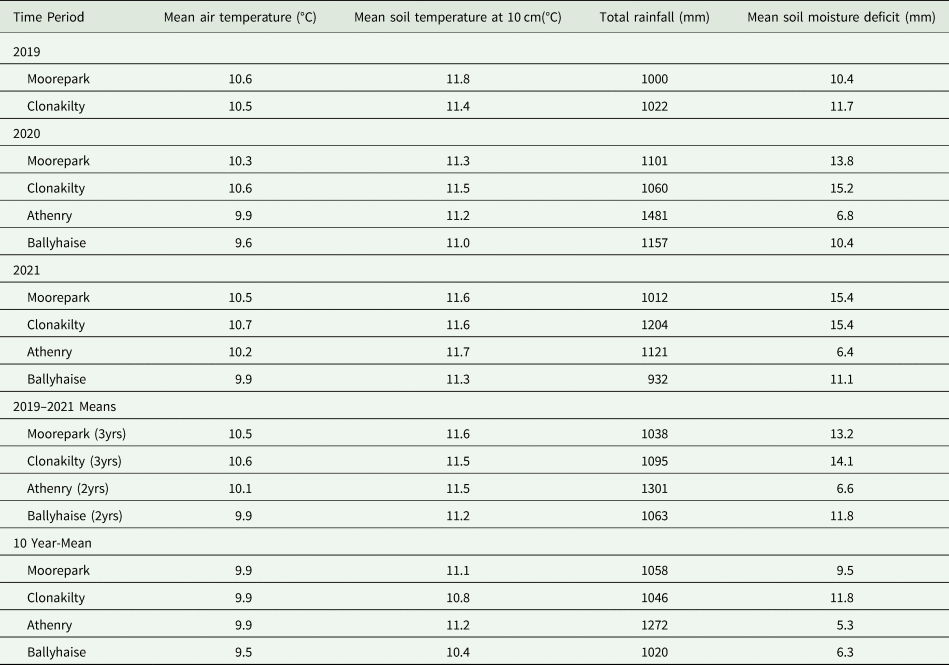
All weather data for each site and year were collected from weather stations at Moorepark, Athenry and Ballyhaise and for Clonakilty at a weather station 7 km away at Timoleague, Co Cork (Agricultural Catchments Program, Teagasc). A summary of mean annual air temperature (°C), mean soil temperature (°C, at 10 cm soil depth), total rainfall (mm) and mean soil moisture deficit (SMD; mm) is provided in Table 3 accompanied by the 10-year average (2009–2018) for each variable. SMD was calculated using the equations of Schulte et al. (Reference Schulte, Diamond, Finkele, Holden and Brereton2005).
Table 3. Weather data for 2019–2021
Absolute drought conditions in Ireland are defined by Met Eireann (The Irish Meteorological Service – www.met.ie) as 15 consecutive days with no rainfall. This criteria was rarely met in our dataset (3 rotations in total) so to determine if drier weather conditions would have an effect on the efficiency of each fertilizer type, we defined dry rotations as any rotation where 10 consecutive days within that particular rotation experienced 0 mm rainfall, max daily temperature reached ≥18°C during the rotation (17°C is the average daily temperature for Irish summer months) and a SMD occurred simultaneously for the entire period. These rotations were identified, and a subset of data containing 14 rotations was created containing just the dry rotations for analysis.
Statistical analysis
Analysis was undertaken using PROC MIXED in SAS (SAS 9.4). The experimental design was a random complete block design (3 × 2 factorial with 4 replicates). All model assumptions were met and tested by plotting the data and evaluating the normal distribution of the data through PROC UNIVARIATE in SAS. The 0 N control was not included in the analysis and rather used as a measurement to evaluate the N fertilizer application efficiency of the fertilizer types being investigated in this study. Terms included in the model were site-year, replicate, fertilizer type, fertilizer rate, rotation number and their subsequent interactions between these terms. The interactions included in the model were fertilizer type × fertilizer rate, rotation × fertilizer type, rotation × fertilizer rate, rotation × fertilizer type × fertilizer rate, site-year × fertilizer type and site-year × fertilizer rate. Individual plot was the experimental unit. The site-year factor was included in the model as all sites were not included every year within the dataset. Tukey's test was used to determine differences between treatment means and differences were considered significant where P < 0.05. The dry rotation dataset was analysed using the same model and terms included in the model.
Results
Weather data
The mean air and soil temperatures at 10 cm depth during the experiment were higher than each site's 10-year mean, whereas mean total rainfall was similar to each site's 10-year mean (Table 3). In 2021, Ballyhaise had 932 mm of rainfall, the driest of all sites and 88 mm below the 10-year mean. The mean SMD for the duration of the experiment at Moorepark, Clonakilty, Athenry and Ballyhaise (13.2, 14.1, 6.6 and 10.8 mm respectively) had a similar trend, being higher than each site's 10-year mean (9.5, 11.8, 5.3 and 6.3 mm, respectively). The dry periods totalled 14 rotations across the 10 site-years with Moorepark, Clonakilty, Athenry and Ballyhaise experiencing 6, 4, 2 and 2 individual dry rotations, for the respective sites. The majority of the dry rotations occurred between May and September in each year.
Grazing characteristics
There was no interaction between fertilizer type and rate for any of the variables measured. Table 4 shows that there was a tendency for urea to have a lower pre-grazing herbage yield than CAN and urea + NBPT when all site-years were analysed together (1436, 1485 and 1480 kg DM/ha, respectively). This is biologically a small difference in terms of herbage production. Pre-grazing herbage yield by rotation for each fertilizer type, averaged across all sites and years is presented in Fig. 1. However, pre-grazing yield was not affected by fertilizer types in any site year (P > 0.05). Similarly, fertilizer type did not affect (P > 0.05) pre-grazing sward height, post-grazing sward height or sward.
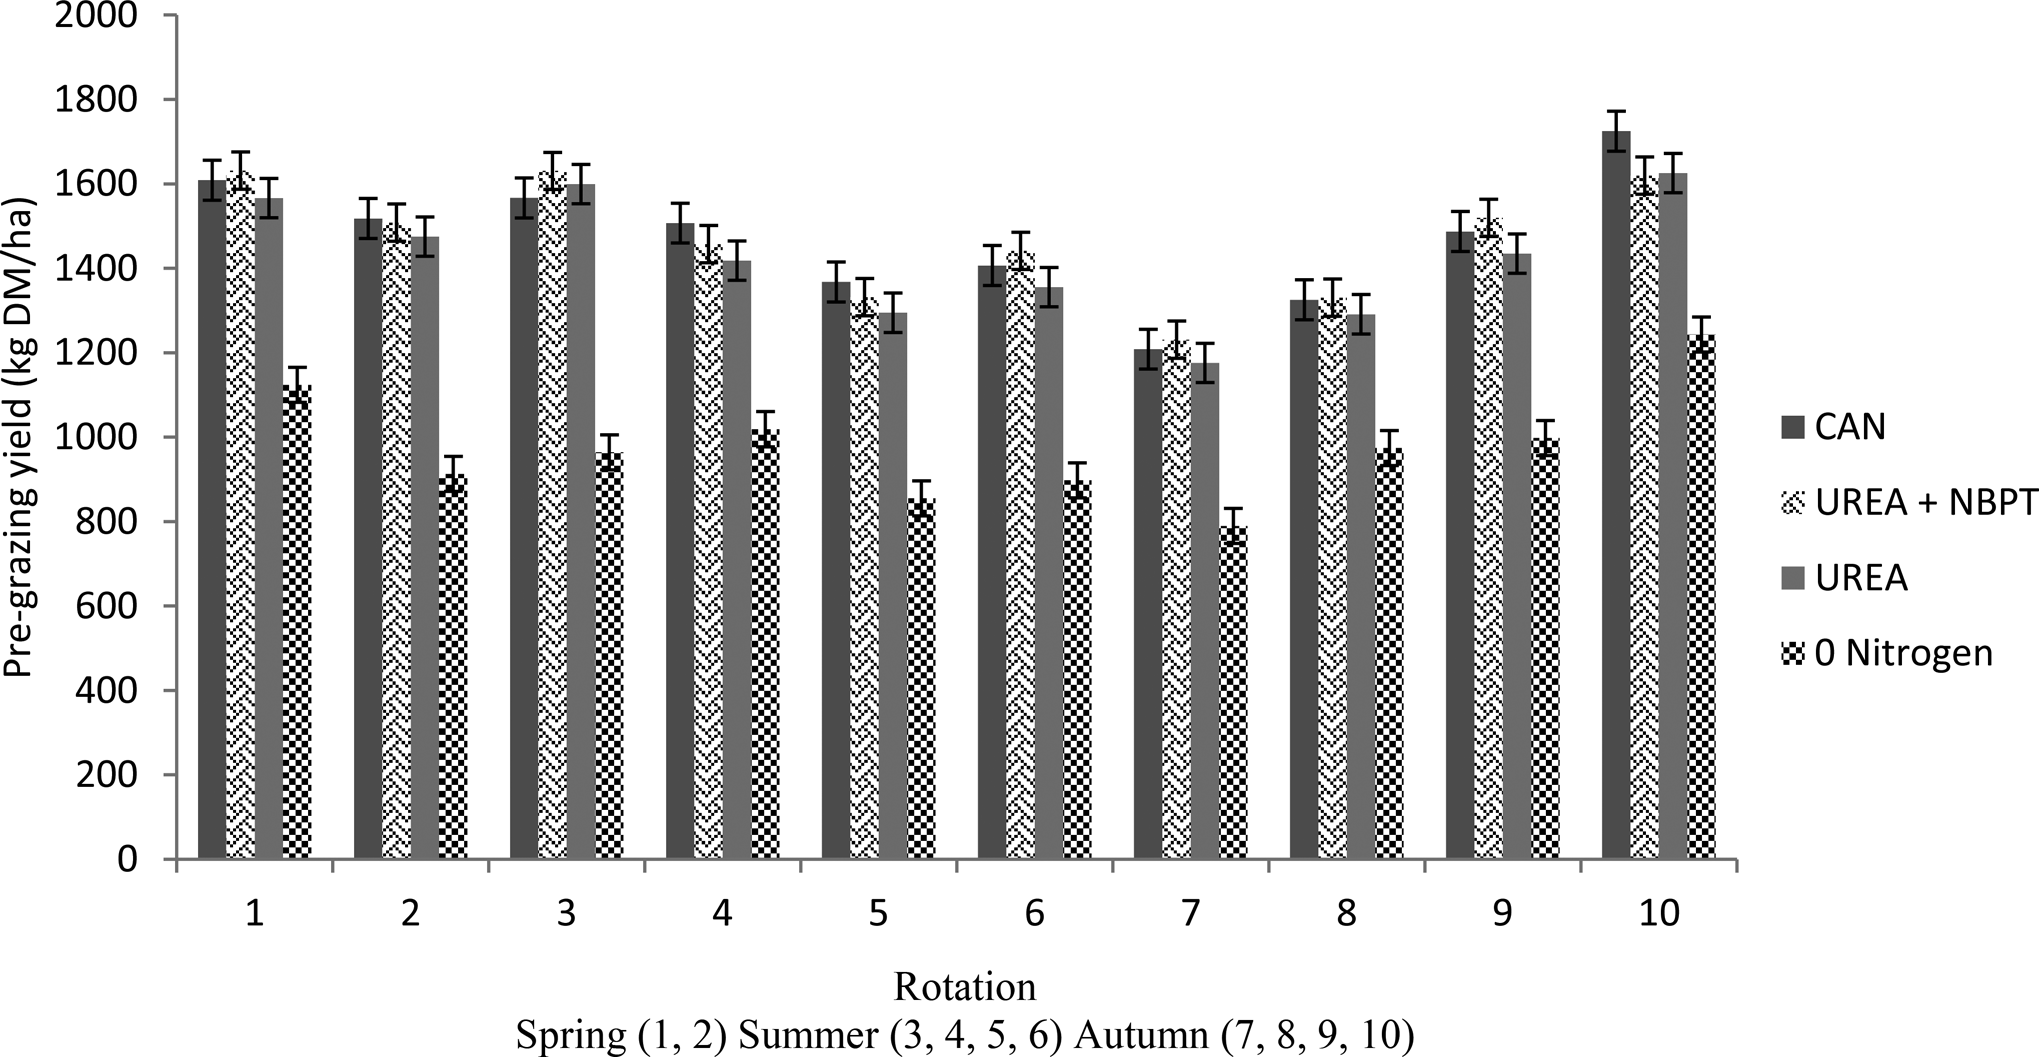
Fig. 1. Seasonal responses in pre-grazing herbage yield to nitrogen (N) fertilizer type (calcium ammonium nitrate (CAN), urea + N-(n-butyl) thiophosphoric triamide (urea + NBPT) and urea) across 10 site-years (data are the means of 150 kg N/ha per year and 250 kg N/ha per year for four replicates; error bars represent standard error of the mean).
Table 4. Effect of nitrogen (N) fertilizer type and rate on herbage production
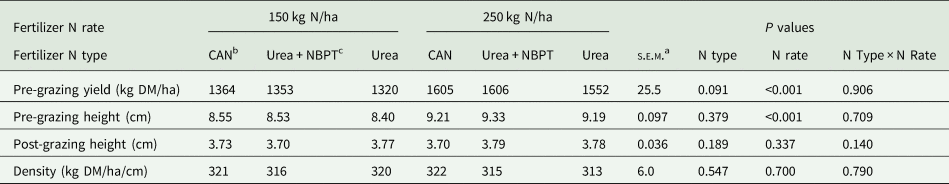
All data are means of rotations of four sites over 2-3 years (total = 10 site-years).
a s.e.m., standard error of the mean.
b CAN, calcium ammonium nitrate.
c Urea + NBPT, Urea + N-(n-butyl) thiophosphoric triamide (urea + NBPT).
Nitrogen fertilizer rate had a significant effect (P < 0.001) on pre-grazing yield, as the mean difference between the 150 and 250 kg N/ha treatments was 242 kg DM/ha in favour of the 250 kg N/ha treatment. Similarly, N fertilizer rate had a significant effect on pre-grazing height (P < 0.001), as the mean difference between the 150 and 250 kg N/ha treatments was 0.75 cm (8.49 and 9.24 cm for 150 and 250 kg N/ha, respectively). Conversely, fertilizer rate did not affect post-grazing sward height (P = 0.337) or sward density (P = 0.700).
Total herbage production
In terms of total herbage production, there was no significant interaction between fertilizer type and rate for any of the variables measured (Table 5). Fertilizer type had an effect as CAN and urea + NBPT (13 478 and 13 542 kg DM/ha) had 391 and 455 kg DM/ha greater herbage production than urea (13 087 kg DM/ha; mean of two fertilizer rates). Urea + NBPT and CAN were not significantly different in terms of herbage production (P = 0.901). However, when individual site-years were analysed independently of each other there was no difference amongst fertilizer types (Table 5). Only in 2019 in Moorepark was there a tendency for urea + NBPT and CAN (13 828 and 13 666 kg DM/ha) to have a greater herbage production than urea (12 921 kg DM/ha; P = 0.083).
Table 5. Effect of nitrogen (N) fertilizer type and rate on total herbage production by site-year and means of all site-years
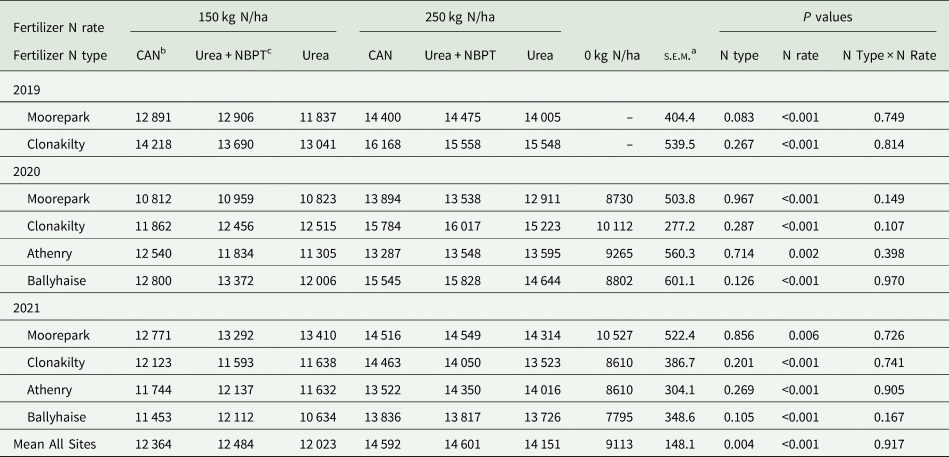
a s.e.m., standard error of the mean.
b CAN, calcium ammonium nitrate.
c Urea + NBPT, Urea + N-(n-butyl) thiophosphoric triamide (urea + NBPT).
The 250 kg N/ha treatment increased herbage production over all site years and for individual site years compared to the 150 kg N/ha treatment (14 424 vs. 12 221, respectively; P < 0.001). All fertilizers gave a similar DM growth response at150 kg N/ha applied (CAN = 21.6; urea + NBPT = 22.5; urea = 19.4 kg DM/ha per kg of N applied), adjusting for the 0 N plots, which yielded 9113 kg DM/ha. The DM growth response continued at a similar response rate with the use of an additional 100 kg N/ha applied (CAN = 22.3; urea + NBPT = 21.2; urea = 21.3 kg DM/ha per kg of N applied).
Herbage nutritive value and N uptake
Herbage nutritive value and N uptake for fertilizer type and rate are presented in Table 6. There were no interactions between fertilizer type and rate for crude protein content, N uptake, WSC or DMD averaged over all harvests, years, sites and fertilizer rates. Fertilizer type had no effect on herbage nutritive value in terms of crude protein content or N uptake (Table 6). The mean crude protein content of the three fertilizer types was 188, 191 and 188 g/kg for CAN, urea + NBPT and urea, respectively. The mean N uptake calculated for the three fertilizer types was 46.3, 46.6 and 44.9 kg N/ha for CAN, urea + NBPT and urea, respectively. The total annual N uptake calculated for the three fertilizer types and adjusted for the 0 N control at the 150 kg N/ha fertilizer rate was 118.3, 126.8 and 108.3 kg N/ha for CAN, urea + NBPT and urea respectively when the 0 N yield was subtracted (P < 0.001). At the 250 kg N/ha the total annual N uptake calculated for the three fertilizer types was 205.7, 211.8 and 189.3 kg N/ha for CAN, urea + NBPT and urea respectively when the 0 N yield was subtracted (P < 0.001). At both fertilizer rates the urea total annual N uptake calculated when the 0 N yield was subtracted was significantly lower than CAN and urea + NBPT. Crude protein content of the swards receiving the three fertilizer types across the grazing season is presented in Fig. 2 The only significant difference between fertilizer types occurred in rotation 4 where urea + NBPT had higher crude protein content than urea (P = 0.044; Fig. 2).
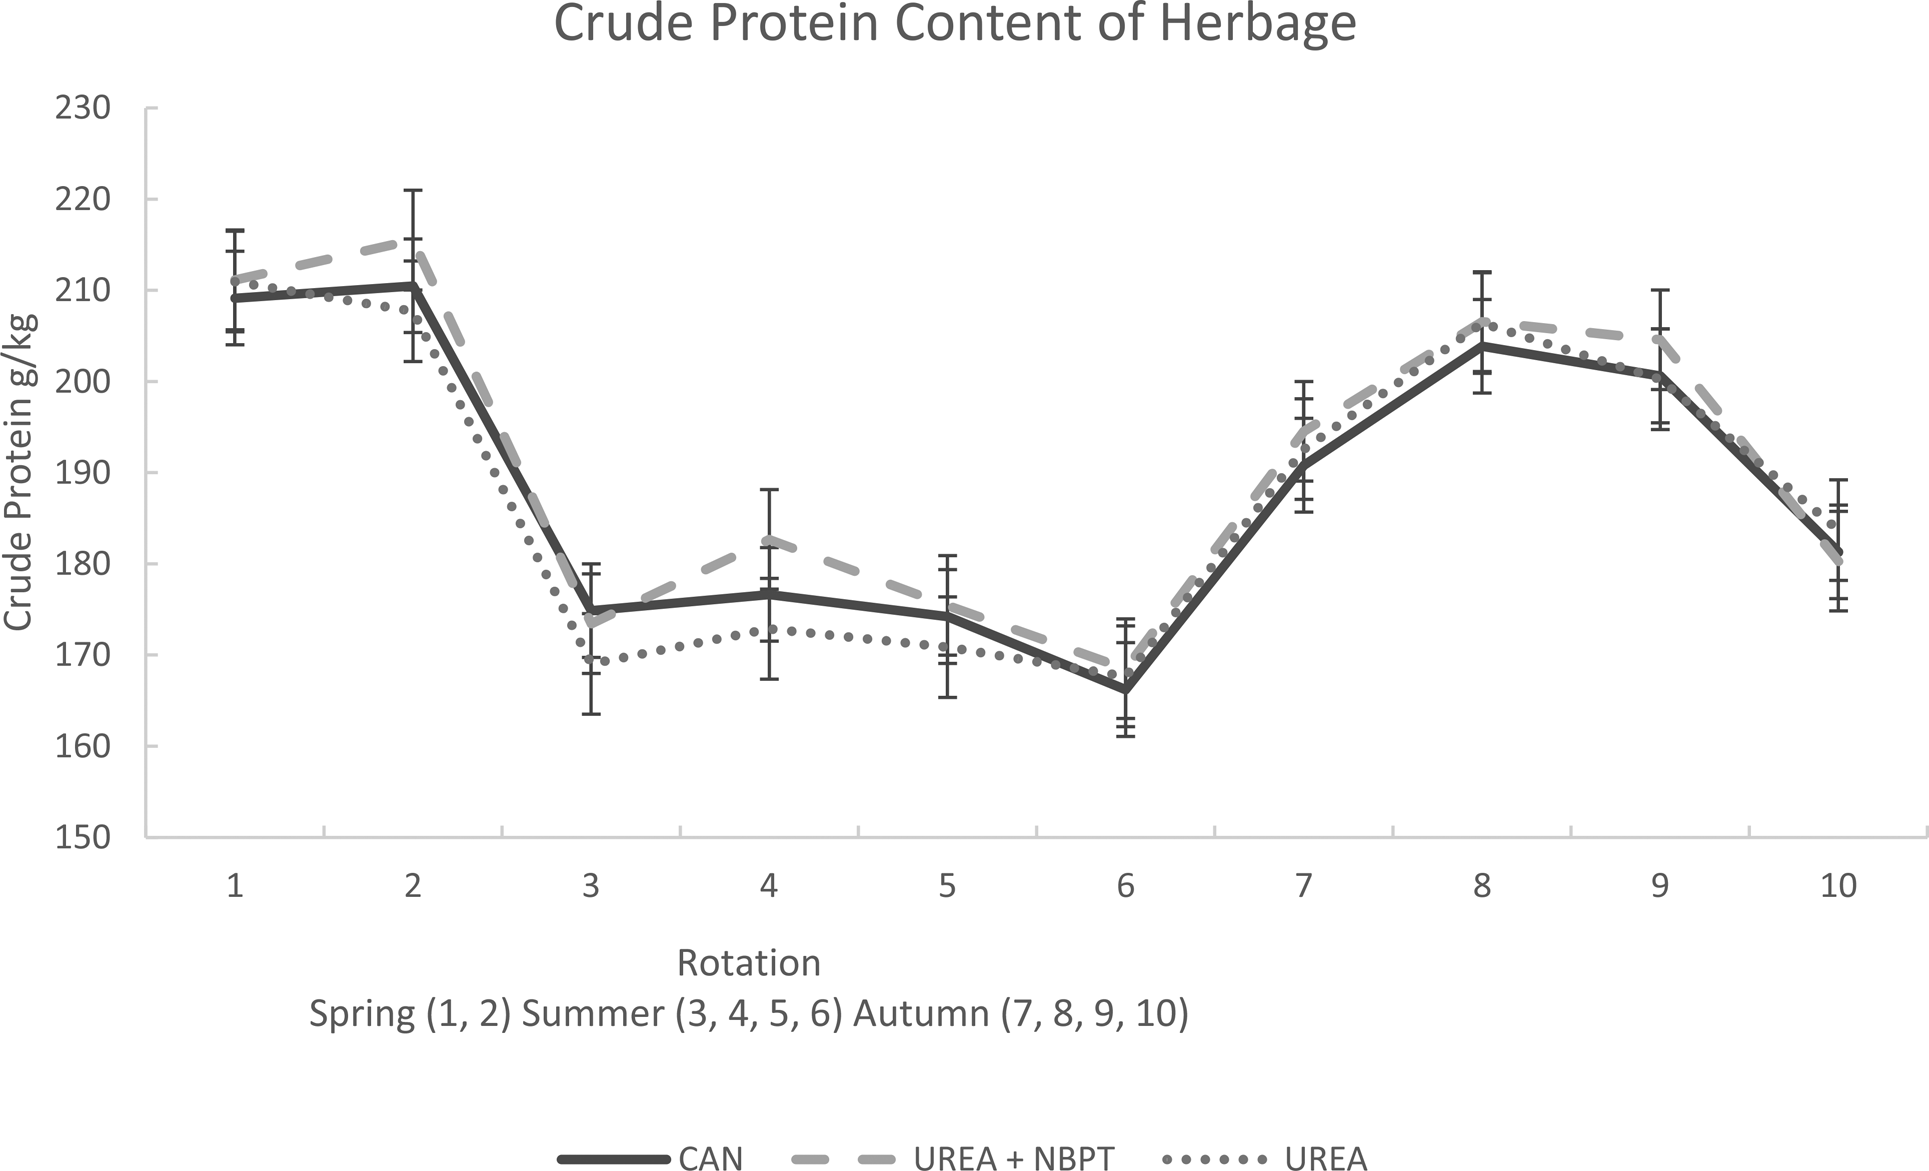
Fig. 2. Seasonal fluxes in crude protein contents of herbage to nitrogen (N) fertilizer type (calcium ammonium nitrate (CAN), urea + N-(n-butyl) thiophosphoric triamide (urea + NBPT) and urea) across 10 site-years (data are the means of 150 kg N/ha per year and 250 kg N/ha per year for four replicates; error bars represent standard error of the mean).
Table 6. Effect of nitrogen (N) fertilizer type and rate on herbage quality and N uptake (weighted mean of all rotations across all sites)
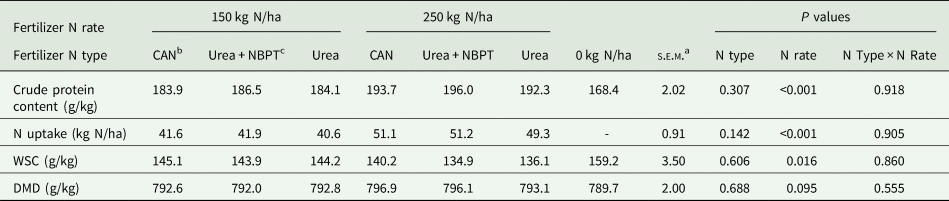
All data are means of rotations of four sites over 2-3 years (total = 10 site-years) except for the 0 kg N/ha treatment and N uptake (8 site-years).
a s.e.m., standard error of the mean.
b CAN, calcium ammonium nitrate.
c Urea + NBPT, Urea + N-(n-butyl) thiophosphoric triamide (urea + NBPT).
There was an effect of fertilizer rate on herbage nutritive value as the 250 kg N/ha treatments had increased crude protein content and N uptake and lower WSC whereas there was a tendency for DMD to be increased. The mean crude protein content of the two fertilizer rates was 184 and 194 g/kg for 150 and 250 kg N/ha, respectively. The mean N uptake of the fertilizer types calculated for the two fertilizer rates was 41.1 and 50.5 kg N/ha for 150 and 250 kg N/ha, respectively.
Dry rotations
There was no effect of N rate or type nor interactions during the dry rotations (Table 7). Fertilizer type displayed no effect on herbage production or nutritive value. There was no difference in pre-grazing herbage yield, crude protein content, N uptake, WSC or DMD between either fertilizer N type or N rate during any of these rotations. In comparison, when the dry weather condition rotations were excluded from the overall analysis the mean pre-grazing herbage yields were 1462, 1469 and 1419 kg DM/ha; with crude protein at 189, 193 and 189 g/kg, with a mean N uptake of 46.5, 47.3 and 44.8 kg N/ha for CAN, urea + NBPT and urea, respectively. When the N uptake was calculated in terms of the 0 N pre-grazing yields (1015 kg DM/ha) for the dry weather condition rotations for the mean fertilizer rate of the three fertilizer types, N uptake was 10.4, 11.0 and 9.2 kg N/ha for CAN, urea + NBPT and urea, respectively. When this N uptake was calculated in the same way for all rotations excluding dry weather condition rotations and a comparison was made v. the dry rotations there was a 33.7, 33.4 and 35.8% increase in N uptake for CAN, urea + NBPT and urea, respectively. In this scenario, when pre-grazing yield was 944 kg DM/ha for 0 N, uptake per ha for CAN, urea + NBPT and urea, was 15.7, 16.2 and 14.3 kg N, respectively.
Table 7. Effect of nitrogen (N) fertilizer type and rate during relatively dry weather conditionsa on herbage production and herbage quality
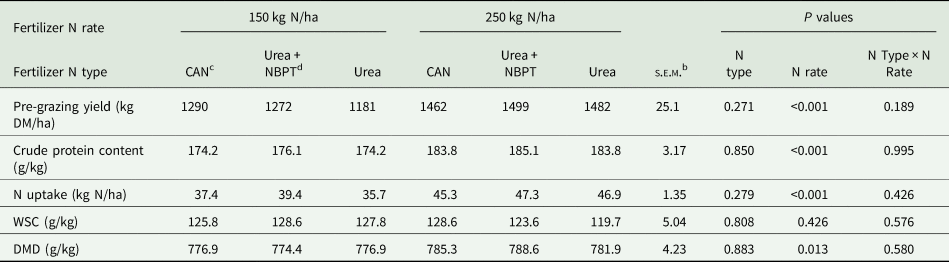
All data are means of rotations of four sites over 2-3 years (total = 10 site-years).
a dry weather conditions, 10 consecutive days with 0 mm of rain and >18°C daily temperature.
b s.e.m., standard error of the mean.
c CAN, calcium ammonium nitrate.
d Urea + NBPT, Urea + N-(n-butyl) thiophosphoric triamide (urea + NBPT).
Discussion
Grazing implications
This experiment was established to examine the effect of N fertilizer types under rotational grazing, therefore animal effects of urine, faeces and treading are necessary (Cashman et al., Reference Cashman, McEvoy, Gilliland and O'Donovan2016). These effects are additional and not present in a cutting plot experiment or simulated grazing experiment. As this was a livestock grazing experiment over a short-term period (two to three years depending on the site), there was no long-term effect of grazing on soil mineralization or N recycling by the livestock as outlined by Ledgard (Reference Ledgard2001), as the faeces is mainly unutilized by the grass. The protein content of the herbage offered to the livestock was similar across fertilizer types, as was post-grazing sward height, therefore the risk of large differences in terms of total N recycling and mineralization per year was small with mineralization of N from faeces and urine ranging from 2-10% of the original N as discussed by Floate (Reference Floate1981).
Fertilizer type effects on annual yield, nutritive value and N uptake
Although there was no effect of fertilizer type on herbage production at any individual site-year, when the data from 10 site-years were analysed together significantly greater total herbage production for CAN and urea + NBPT was detected compared with the urea treatment. While urea was significantly lower for the 10 site-years combined in the present study, this difference was small (424 kg DM/ha) and probably reflects the fact that urea is vulnerable to NH3 loss, in particular as soil becomes drier during summer months (Harty et al., Reference Harty, Forrestal, Watson, McGeough, Carolan, Elliot, Krol, Laughlin, Richards and Lanigan2016). As there were 10 site-years analysed in the dataset, these differences could be detected. Mean herbage production for 2020 and 2021 across all sites on the 0 N plots, from background N supplied from the soil, was 9113 kg DM/ha (data is mean of 2020 and 2021 as 0 N plots were only added to the study in 2020). When this was subtracted from the herbage production of each fertilizer type (mean of 2020 and 2021, resulting in herbage production of 4114, 4258 and 3779 kg DM/ha for CAN, urea + NBPT and urea, respectively) and urea relative yields were calculated, there was an 11% increase in total annual herbage production for urea + NBPT compared to urea. When N uptake was calculated similarly, there was a significant 12% increase in total annual N uptake for urea + NBPT compared to urea (136.2 vs. 120.1 kg N/ha for urea + NBPT and urea, respectively) displaying a production benefit for urea + NBPT compared to urea. This is a similar production benefit compared with previous studies that reported a 10% increase in crop production (Abalos et al., Reference Abalos, Jeffery, Sanz-Cobena, Guardia and Vallejo2014) and a 9.75% increase in herbage production (Zaman et al., Reference Zaman, Zaman, Adhinarayanan, Nguyen, Nawaz and Dawar2013). Conversely, Carswell et al. (Reference Carswell, Shaw, Hunt, Sánchez-Rodríguez, Saunders, Cotton, Hill, Chadwick, Jones and Misselbrook2019) observed no yield difference in grass silage for urea compared to urea + NBPT at two study sites. This was also in agreement with Forrestal et al. (Reference Forrestal, Harty, Carolan, Lanigan, Watson, Laughlin, Wall, Hennessy and Richards2017) and Harty et al. (Reference Harty, Forrestal, Watson, McGeough, Carolan, Elliot, Krol, Laughlin, Richards and Lanigan2016), who also detected no significant herbage production differences under cutting plots at three locations across Ireland, but did record significantly greater N recovery with urea + NBPT. Suter et al. (Reference Suter, Sultana, Turner, Davies, Walker and Chen2013) also noted no differences between N forms under sheep grazing for herbage production in Australia. These mixed results, suggest that the risk of NH3 volatilization is variable. It is possible that temperate maritime conditions may be generally more favourable for urea usage compared with other climates. Carswell et al. (Reference Carswell, Shaw, Hunt, Sánchez-Rodríguez, Saunders, Cotton, Hill, Chadwick, Jones and Misselbrook2019) found no total herbage yield effects were observed between urea and urea + NBPT, making urea still attractive to farmers as long as they do not have to account for the large gaseous emissions. However, Carswell et al. (Reference Carswell, Shaw, Hunt, Sánchez-Rodríguez, Saunders, Cotton, Hill, Chadwick, Jones and Misselbrook2019) also stated that the economic losses associated with N use efficiency are highest with urea and that urea + NBPT reduced NH3 emissions by 48–65%.
An important observation from the present study was the relatively high performance of urea under temperate Irish conditions. However, this is not unprecedented as Forrestal et al. (Reference Forrestal, Harty, Carolan, Lanigan, Watson, Laughlin, Wall, Hennessy and Richards2017) also observed similar performance with cutting plots. In fact, Forrestal et al. (Reference Forrestal, Harty, Carolan, Lanigan, Watson, Laughlin, Wall, Hennessy and Richards2017) found that the N uptake for urea treatments was significantly lower than for the CAN and urea + NBPT treatments but only at the higher annual N fertilizer rates of 300, 400 and 500 kg N/ha, which were not examined in this study and are not practical or economic rates.
As fertilizer is a high direct cost in rotational grazing systems making up 9.8% of total costs in 2020 on Irish dairy farms and projected to almost double to 16.9% in 2022 with rising fertilizer costs (Teagasc, 2022), it is important to discourage a switch from CAN to urea, which is cheaper per kg N. CAN is the most expensive N fertilizer in Ireland costing €3.00 per kg N, followed by urea + NBPT costing €2.06 per kg N and urea costing €1.95 per kg N (Glanbia, 2023). Therefore, switching from CAN to urea + NBPT would incur a saving of €235/ha on fertilizer costs for a 250 kg N/ha system while growing the same amount of herbage. However, switching from CAN to urea would incur a cost saving of €262/ha on fertilizer for a 250 kg N/ha system but a reduced herbage grown of 441 kg DM/ha. In an event where this would happen, NH3 emissions would increase further and Ireland would fail to reach its target to reduce NH3 emissions (EPA, 2021). Therefore, when the high costs to society and the environment were included into the fertilizer cost of N, urea offers a non-economically viable N source compared with urea + NBPT. As a result, Carswell et al. (Reference Carswell, Shaw, Hunt, Sánchez-Rodríguez, Saunders, Cotton, Hill, Chadwick, Jones and Misselbrook2019) recommends a need for the externality costs that society pays, to be incorporated within the N unit cost of N fertilizer types to encourage uptake of N fertilizers with lower environmental impacts. The lost N represents a serious economic loss to farmers, but it can also affect human health and contaminate ground water and air quality (Galloway et al., Reference Galloway, Townsend, Erisman, Bekunda, Cai, Freney, Martinelli, Seitzinger and Sutton2008). According to a report published by Glibert et al. (Reference Glibert, Harrison, Heil and Seitzinger2006) the global rates of urea fertilizer usage have increased rapidly over the past several decades, so that more urea is now used than any other N fertilizer type and constitutes >50% of global nitrogenous fertilizer usage. Recently Beig et al. (Reference Beig, Niazi, Jahan, Hussain, Zia and Mehran2020) stated that this usage has presently reached about 200 million tonnes of urea fertilizer produced worldwide to meet supply and demand. Beig et al. (2020) stated that a quarter of the urea applied to soils globally is lost to the environment due to poor efficiency and hypothesize that this can be reduced by slowing the release of urea N through protection with a urease inhibitor. Therefore, switching to the use of protected urea in grazing systems has the potential to reduce NH3 and indirect GHG emissions from agriculture significantly in regions where grazing is utilized.
One of the most important findings of the experiment is that urea + NBPT reliably produced the same total herbage yield as CAN. Given that CAN comprises the majority of straight N fertilizer use in certain temperate regions, including Ireland, there is huge potential for the agricultural industry to reduce its CAN generated N2O emissions by converting to urea + NBPT while retaining similar fertilizer rates and production intensity (Rahman et al., Reference Rahman, Richards, Harty, Watson, Carolan, Krol, Lanigan and Forrestal2021). Forrestal et al. (Reference Forrestal, Harty, Carolan, Lanigan, Watson, Laughlin, Wall, Hennessy and Richards2017) had previously measured a 71% decrease in N2O emissions with the application of urea + NBPT compared to CAN. Therefore, the results of the current study fully justify the use of this environmentally sensitive management strategy for high performing, rotationally grazed ruminant herds at grass. Additionally, the current study demonstrated that urea + NBPT did not compromise the nutritive value of the herbage grown by maintaining comparable crude protein, WSC and DMD contents to CAN, with N uptake the same for urea + NBPT and CAN. This is similar to Carswell et al. (Reference Carswell, Shaw, Hunt, Sánchez-Rodríguez, Saunders, Cotton, Hill, Chadwick, Jones and Misselbrook2019) who reported no differences in crude protein or digestibility between urea and urea + NBPT. These results should further validate and strengthen confidence that urea + NBPT is an effective technology that should be prioritized by legislative policy and industry stakeholders to improve the inventory for GHG emissions. Recently in Ireland the Department of Agriculture, Food and the Marine has introduced regulations that require a minimum coating of inclusion levels of inhibitors. The rate of inhibitor used must meet minimum regulatory requirements, which should ensure effective reduction in GHG and ammonia emissions and were based on independent research relevant to Irish climatic conditions. However, in terms of minimum usage of protected urea in agricultural systems in the EU or around the rest of the world, there is not yet any legislation being implemented. Though, the UK's Department for environment, food and rural-affairs is considering the obligatory use of urease inhibited urea instead of urea in order to reach its legal obligations to reduce ammonia emissions by 16% by 2030 (Department for Environment, Food and Rural-Affairs (DEFRA), 2022).
Fertilizer rate effects on annual yield, quality and N uptake
Through the European Union (EU) Nitrates Directive (91 676 EEC) there is increasing pressure for agriculture to curb its N usage (Musacchio et al., Reference Musacchio, Re, Mas-Pla and Sacchi2020). Impending regulations may see further restrictions on N fertilizer use and reduced allowances on a per hectare basis. The current experiment demonstrated the likely impact this would impose on herbage production potential. The 250 kg N/ha treatment is at the upper limit of the current EU Nitrates Directive for Ireland. When the N rate was reduced by 100 kg N/ha, total herbage production was reduced significantly by 2148 kg DM/ha across the 10 site-years regardless of fertilizer type, with similar reductions in crude protein content and increases in WSC content and with the yield loss consistently evident within each site-year. Martin et al. (Reference Martin, Edwards, Bryant, Hodge, Moir, Chapman and Cameron2017) observed similar effects under irrigation, with annual herbage yield and protein contents decreasing linearly with each N fertilizer rate decrease, from an initial N fertilizer rate of 450 kg N/ha. De Klein et al. (Reference De Klein, Monaghan, Alfaro, Gourley, Oenema and Powell2017) defined N Surplus as the difference between N inputs (including fertilizer, concentrate and atmospheric deposition) and N outputs (including milk, herbage grown and transfer of N to the lanes and milking shed via excreta (Peyraud et al., Reference Peyraud, Le Gall and Lüscher2009)), and is a commonly used metric for assessing the risk of environmental losses. Although farm gate N surplus cannot be calculated from this plot scale experiment, N surplus due to N fertilizer can be estimated. On a fertilizer input to herbage grown output basis, for the 150 kg N/ha treatments mean N uptake was 41.4 kg N/ha by the herbage, resulting in a 108.6 kg N/ha surplus. For the 250 kg N/ha treatments mean uptake was 50.6 kg N/ha by the herbage with a 199.4 kg N /ha surplus. The 250 kg N/ha treatments have almost double the N surplus of the 150 kg N/ha treatments, which would imply a substantially larger N footprint (De Klein et al., Reference De Klein, Monaghan, Alfaro, Gourley, Oenema and Powell2017) and potential N losses.
Dry weather conditions affecting fertilizer type
In areas of Western Europe and in Ireland, drought or prolonged dry weather conditions are likely to be an increasing problem, reducing potential herbage growth significantly during these events. During the current study when dry weather conditions were identified, reduced pre-grazing yields were recorded but there were no significant differences in yield or nutritive value between the three fertilizer types. Notably, urea remained at 97% of the herbage yield of CAN and urea + NBPT. As these weather conditions would be ideal for NH3 volatilization (Chambers and Dampney, Reference Chambers and Dampney2009) it is likely that there was enough available N in the soil to support the reduced growth rates while the herbage was drought stressed. It cannot be assumed and was not measured that NH3 volatilization was equal between the three fertilizer types. However, there was a notable difference in N uptake when background N was accounted for with a mean 32.5% reduction in N uptake during the dry rotations compared to the remaining non-dry rotations for the 10 site-years.
Conclusion
There was a small overall benefit detected over the 10 site-years from using urea + NBPT v. using urea, implying that more of the N is available for the plant to use under grazing. Similar herbage production was observed for CAN and urea + NBPT, at all sites and providing further evidence of the efficacy of urea + NBPT. Given that this was a comprehensive study from multiple sites and years, with actual cattle/sheep grazing involved, farmers and industry should have confidence that urea + NBPT will reliably deliver herbage yields and nutritive value that matches CAN and exceeds urea yield, except under relatively dry conditions. This reliability in performance and reduction in GHG emissions of urea + NBPT paired with a cost saving for farmers using CAN fertilizer should help to promote a greater uptake in its usage. There is also the option for farmers using urea to switch to using urea + NBPT and have the same herbage production with a 12% reduction in application of fertilizer. This has the potential to allow farmers to have fewer applications which may suit some grazing systems.
Supplementary material
The supplementary material for this article can be found at https://doi.org/10.1017/S0021859623000126
Acknowledgments
The authors would like to gratefully acknowledge the work and the invaluable assistance of the farm and technical staff based at Clonakilty Agricultural College, Teagasc Moorepark, Ballyhaise Agricultural College and Mellows Campus Athenry. The authors would also like to extend a thanks to the numerous placement students that helped in the data collection over the duration of the study. Finally, the authors would also like to thank Luis Lopez-Sangil for carrying out the soil texture classifications for each site.
Author contributions
ÁM: Conceptualization (supporting); Data curation (lead); Formal analysis (lead); Investigation (lead); Methodology (lead); Validation (equal); Visualization (supporting); Writing- original draft (lead); Writing- review & editing (lead). TJG: Project administration (supporting); Supervision (equal); Writing- original draft (supporting); Writing-review & editing (supporting). LD: Conceptualization (supporting); Formal analysis (supporting); Methodology (supporting); Validation (supporting); Writing- original draft (supporting); Writing- review & editing (supporting). DP: Data curation (supporting). PC: Data curation (supporting). PF: Formal analysis (supporting); Validation (supporting); Writing- review & editing (supporting). BMcC: Conceptualization (lead); Funding acquisition (lead); Methodology (supporting); Project administration (lead); Supervision (equal); Writing- original draft (supporting); Writing- review & editing (supporting).
Financial support
This research was funded by Dairy Research Ireland – Irish Dairy farmers levy funding and the Teagasc Walsh Scholarship Programme.
Conflict of interest
All authors declare no conflicts of interest with the subject matter or materials discussed in this manuscript.
Ethical standards
Not applicable.


 Open access