


Introduction
Introduction of new improved soybean (Glycine max L. Merrill) genotypes to smallholder farmers in Southern Africa region aims at increasing productivity. However, yield continue to fall below the varieties production potentials due to climate change regardless of continuous expansion of cultivated land areas, introduction of improved varieties and use of plant nutrients inputs for soybean production (Khojely et al., Reference Khojely, Ibrahim, Sapey and Han2018). Vicissitudes in the regional climatic patterns is threatening future production of soybean. Recently, cropping-seasons have been characterized by frequent events of irregular rainfall and drought both mid- and/or end-season (Ngcamu and Chari, Reference Ngcamu and Chari2020) that warrants better water-use efficiency (WUE) for yield improvement. Technologies for combating irregular rainfall patterns and drought are numerous, chief being water harnessing in reservoirs (during heavy rains) and irrigation. However, smallholder farmers in sub-Saharan Africa (SSA) rarely adopt these due to a plethora of challenges. Instead, they rely heavily on rainfed production of crops. Despite irrigation being key, other agronomic technologies such as: adjusting or changing planting dates, crop varieties, plant density, nutrient and soil moisture management practices can suffice to improve yield.
Judicious management of soil moisture in this changing climate also entails effective and efficient water use by crops. It is projected that soybean production in eastern part of Africa spanning from Ethiopia, Kenya, Malawi, Mozambique, Rwanda, Tanzania, Uganda and Zambia could decline by 12% by 2090 due to water stress if climate change is not mitigated (Tatsumi et al., Reference Tatsumi, Yamashiki, Valmir da Silva, Takara, Matsuoka, Takahashi, Maruyama and Kawahara2011). The interaction between water supply, temperature and other environmental conditions affects the relationship between WUE and yield which is not necessarily linear and differ with crop species (Condon et al., Reference Condon, Richards, Rebetzke and Farquhar2002; Irmak and Specht, Reference Irmak and Specht2014). Although some studies have reported WUE impacting yield, it depends on the prevailing abiotic conditions at each growth stage and the affected plant physiological process. For instance, restricting maximum transpiration rate improved WUE leading to 9–13% increase in sorghum yield (Sinclair et al., Reference Sinclair, Hammer and van Oosterom2005). Greater yield losses occur when WUE is low due to water stress or higher losses coinciding with the reproductive stage especially between flowering and full seed in soybean. Anda et al. (Reference Anda, Simon, Soós, Teixeira da Silva and Kucserka2018) reported a yield loss in two soybean varieties, one water stress-tolerant and the other bred for ‘average’ weather conditions due to low WUE in both irrigated and rainfed systems. When water was supplied at 50% of the requirement at vegetative stages, the leaf area index (LAI) reduced hence affecting bloom and pod-filling of the soybean. Other researchers have worked on the mechanism of plant response to water and heat stress in relation to WUE. The results from barley, soybean and wheat have shown that response to water and heat stress which impact on WUE is genotypically distinct and can be modified through gene manipulation (Anyia et al., Reference Anyia, Slaski, Nyachiro, Archambault and Juskiw2007; Hufstetler et al., Reference Hufstetler, Boerma, Carter and Earl2007; Siahpoosh et al., Reference Siahpoosh, Dehghanian and Kamgar2011; Rizza et al., Reference Rizza, Ghashghaie, Meyer, Matteu, Mastrangelo and Badeck2012).
Transpiration is important in mass-flow movement of plant nutrients as well as cooling the plant, and some of the elements are key in photosynthesis. These two processes; transpiration and photosynthesis, have a bearing on plant WUE. A ratio between photosynthesis and transpiration is used to estimate WUE (Medrano et al., Reference Medrano, Tomás, Martorell, Flexas, Hernández, Rosselló, Pou, Escalona and Bota2015). The processes take place in active leaves depending on atmospheric temperature and soil water content. If either or both are limiting at any plant development stage, then fewer and/or smaller organs are formed impacting on transpiration, photosynthesis rate and yield. Higher temperatures result in increased transpiration to a certain threshold before the stomata closes. Plants close their stomata to reduce transpiration which impedes photosynthesis rate and might cause heat-damage (Lobell and Gourdji, Reference Lobell and Gourdji2012). On the other hand, moisture stress reduces crop reproductive stage, leaf area and enhances stomatal closure to minimize water loss. These plant adaptation characteristics have a negative effect on crop yield (Thornton et al., Reference Thornton, Jones, Alagarswamy and Andresen2009). Studies have demonstrated that both water stress and increased heat decrease the length of the growing season and loss of productive arable land especially along boundaries of arid and semiarid regions in Africa (Conway, Reference Conway2009). With the current harsh weather conditions resulting from climate change, plant WUE will determine its capability to adapt to specific agroecologies through alterations in the phenological and physiological characteristics. Physiological processes within plant tissue that respond to climate change are transpiration, carbon assimilation and photosynthesis affecting WUE hence overall yield. For instance, in drier environments, a high WUE increases yield unlike in wetter environments where it leads to proliferation of vegetative parts at the expense of reproductive organs.
Proper utilization of soil and water enhances the effectiveness of available moisture, fertilizer and improved seeds in crop production. There are organizations involved in the development of soybean improved seed and accompanying agronomic practices such as inoculants, fertilizer regimes especially phosphorus and agroecologically suitable planting times. For instance, inoculation and P fertilizer application increased cowpea grain yield and above-ground plant dry matter at harvest in Mozambique (Kyei-Boahen et al., Reference Kyei-Boahen, Savala, Chikoye and Abaidoo2017) and soybean in locations of Kenya (Majengo et al., Reference Majengo, Okalebo, Lesueur, Pypers, Ng'etich, Misyoki and Mburu2011), Ghana (Akpalu, Reference Akpalu2014), Malawi (Phiri et al., Reference Phiri, Kausiwa, Omollo, Muindi and Yegon2016) and Rwanda (Rurangwa et al., Reference Rurangwa, Vanlauwe and Giller2018) among others. Majengo et al. (Reference Majengo, Okalebo, Lesueur, Pypers, Ng'etich, Misyoki and Mburu2011) showed that inoculation of promiscuous medium-maturity soybean variety TGx1740-2F increased dry matter by 27% and average grain yield by 15–30% in Bungoma Kenya. These studies focused on the growth and development characteristics that led to the yield observed following N and P application but not the physiological, phenological and WUE changes due to agronomic practices. Inoculants contain effective rhizobia that enhance symbiotic biological nitrogen fixation (BNF) in soybean (Sanginga et al., Reference Sanginga, Okogun, Vanlauwe and Dashiell2002; Zimmer et al., Reference Zimmer, Messmer, Haase, Piepho, Mindermann, Schulz, Habekuß, Ordon, Wilbois and Heß2016; Savala and Kyei-Boahen, Reference Savala and Kyei-Boahen2020). Similar to P, supply of N either through BNF or mineral fertilizer promote plant growth that stimulates increased photosynthesis activity in plant leaves. Nitrogen is a key element in photosynthesis process as it affects leaf chloroplasts size, number and composition (Bassi et al., Reference Bassi, Menossi and Mattiello2018). Inoculation promotes BNF process that avails more N for plant uptake resulting in better leaf development creating a larger surface area that maximizes the photosynthesis process in plants hence increasing N use efficiency. Therefore, N deficiency in soils could lead to reduced photosynthesis process that affect soybean growth and development (Uprety and Mahalaxmi, Reference Uprety and Mahalaxmi2000).
High yielding drought tolerant soybean genotypes that use water and nutrient efficiently are required to mitigate effects of climate change. Development and dissemination of drought tolerant and specific agroecologically adapted varieties could also help minimize the climate change impact in drought-prone areas (Adhikari et al., Reference Adhikari, Nejadhashemi and Woznicki2015). Agronomists and producers use some technologies such as nutrient amendments, inoculation, planting time alteration and plant population that impact on legume response to temperature and available water. However, smallholder farmers in SSA hardly deploy a fusion of these agronomic technologies in production of legumes such as soybean, due to various reasons, example resource incapability. In this study, we seek to determine how soybean WUE and production is affected by inoculant, nitrogen and phosphorus application. The objectives were to evaluate the effect of nutrient application on soybean WUE and yield through evaluation of nodulation, physiological processes at three reproductive stages, growth and yield components.
Materials and methods
Site description
Field studies were conducted in 2017 and 2018 growing seasons at two high potential soybean growing areas in Mozambique (Angonia 14 ° 32′ S, 34 ° 11′ E, 1202 metres above sea level (m a.s.l.) and Ruace 15 ° 21′ S, 36 ° 47′ E, 772 m a.s.l.). In each season, fields under maize for previous two growing periods were used. According to the Soils Atlas of Africa, the predominant soil type at the sites in Angonia and Ruace are Chromic Luvisols (Jones et al., Reference Jones, Breuning-Madsen, Brossard, Dampha, Deckers, Dewitte, Gallali, Hallett, Jones, Kilasara, Le Roux, Micheli, Montanarella, Spaargaren, Thiombiano, Van Ranst, Yemefack and Zougmoré2013). Six soil samples were taken from 0 to 20 cm soil layer using a soil auger in a W pattern across the field for the trial before ploughing or harrowing. Soils from each site were combined into a composite sample and four subsamples drawn for chemical and particle-size analysis (Table 1). The pH was determined using a high impedance voltmeter on 1:2 soil–water suspension. Total organic carbon was determined by Walkley–Black Method, total N by The Kjeldahl method, P by Olsen's method and K using ICP-OES after extraction with Mehlich 3.
Table 1. Amount of rainfall for the growth stages of Safari and Wamini soybean varieties recorded in the 2017 and 2018 cropping seasons at Angonia and Ruace

Experimental layout
Two early maturity group soybean varieties: TGx 1740-2F (promiscuous) locally known as ‘Wamini’ released by the Instituto de Investigação Agrária de Moçambique (IIAM) (National Agricultural Research Institute of Mozambique) and Safari (non-promiscuous Seed Co. variety) were used in the experiment. Commercial Bradyrhizobium diazoefficiens strain USDA110 formerly known as Bradyrhizobium japonicum (Delamuta et al., Reference Delamuta, Ribeiro, Ormeño-Orrillo, Melo, Martínez-Romero and Hungria2013) inoculant product NitroZam was obtained from Zambia Agricultural Research Institute (ZARI), Lusaka, Zambia for the study. The experimental design was randomized complete block with four replications. A factorial arrangement of treatments consisted of no inputs (check), inoculation with NitroZam, split application of 100 kg N/ha as Urea (50 kg N/ha each at planting and flowering), application of 40 kg P2O5/ha as single superphosphate, and inoculant plus 40 kg P2O5/ha applied together at planting. Plots consisted of seven rows of 8 m in length, 0.50 m row-spacing and 0.1 m between plants within rows. Land preparation was accomplished with disc ploughing followed by two passes with a disc harrow. Both seasons’ experiments were planted between 12 and 18 December depending on the onset of rains in each location.
To avoid contamination, the non-inoculated and fertilizer receiving plots were planted first before the inoculated ones. Inoculation was done in the field under a shade by weighing 1.0 kg of seeds of each cultivar into separate plastic bags and adding 5 ml of 3% (w/v) gum arabic solution as sticker. The seeds and gum arabic solution were mixed thoroughly and 10 g of the peat-based inoculant (according to the manufacturer's recommendation) was applied to the seeds in each bag and mixed thoroughly until all the seeds were completely covered with inoculant. The inoculant was applied to supply approximately 106 rhizobia cells/seed. The seeds were planted immediately. Planting and weeding (twice) were done manually, although scheduling was site specific. The experiment was conducted under rainfed conditions for both seasons (Fig. 1). To control pests, 100 ml of Cypermethrin (200 g active ingredient/l) and 50 ml of Lambda Cyhalothrin (50 g active ingredient/l) were used in 15 l once at beginning of flowering.

Fig. 1. Colour online. Rainfall and atmospheric temperature during the experiment in (a) Angonia and (b) Ruace.
Data collection
Data on growth, physiological, phenological characteristics and plant tissue content were collected. At R3 (flowering to podding) growth stage before second N dose was applied and when pods had reached 10–12 mm long at one of the four uppermost nodes on main stem, five soybean plants were randomly selected from each plot and all the roots were excavated using a hoe and spade. The soil was carefully washed out from the roots to ensure that all the nodules were recovered as much as possible. The nodules were plucked from the roots by hands, counted and subsequently placed in envelopes then dried in an oven at 60 °C for 48 h to determine nodule dry weight. The remaining plant biomass were dried in an oven at 60 °C for 72 h and dry weight was determined. Later the biomass was ground to pass a 2-mm mesh sieve for plant tissue N, P and K analysis using Inductively coupled plasma – optical emission spectrometry (ICP-OES) after extraction with nitric acid and hydrochloric acid. Photosynthesis and transpiration using LCpro+ photosynthesis system were determined in Angonia and Ruace at flowering, podding and grain filling. At each growth stage, the photosynthesis system was used to take measurements between 09:00 and 12:00 h, on one third recently mature fully expanded leaf on three plants in each plot. At maturity, an area of 1 m2 (two 1 m long from the middle rows) was randomly selected and harvested for determination of above ground biomass, pod density and seed weight. Pods from each plot were threshed manually and grain yield was determined. The moisture content of grain samples from each plot was measured using Farmex MT-16 grain moisture Tester (AgraTronix LLC, Streetsboro, Ohio, USA) and grain yield in kg/ha was adjusted to 13% moisture content. After harvesting the pods, the above-ground plant biomass from the 1 m2 plot area were sun-dried to 10% moisture content for 10 days to determined dry matter yield. Except for land preparation, all field activities were done manually.
Data analysis
Analyses of variance (ANOVAs) were performed using PROC GLM in Statistical Analysis System (SAS)® 9.4 (SAS Institute, 2018). A combined analysis across locations and cropping seasons was performed. Since location and season effects were dominant, the variables were combined to form environment. Firstly, a factorial ANOVA was performed, to evaluate the effects of environment, variety, treatment and their interactions. Environments effects were significant for all the variables. Secondly, a two-way ANOVA of varieties and treatments factors considered as fixed effects was performed for each environment. Environment and replication were treated as random effects (Moore and Dixon, Reference Moore and Dixon2015). Means were determined for treatments, and comparisons done using Tukey adjustment at P ≤ 0.05 significance level based on the standard error of means (s.e.m.) (SAS Institute, 2018). Plant growth variables analysed included nodulation, shoot biomass, N, P and K contents at R3 stage, number of pods/m2, number of seed per pod, 100-seed weight, grain yield and plant dry matter at harvest. Also, data on days to flowering (R2), podding (R3) and maturity (R8) were collected (data not reported). Photosynthesis, transpiration, WUE, photoactive radiation intercepted (PAR) and LAI between flowering and full seed was also analysed. The ecologies of the locations were different and dominant for the variables analysed, thus the effects associated with the seasons were confounded with the weather within seasons (Moore and Dixon, Reference Moore and Dixon2015) making seasons a random effect for the purpose of estimating variability of treatment differences for the locations across seasons. Therefore, location and treatment were considered fixed effects, whereas cropping season and blocks nested within locations were considered as random effects.
Results
Development of soybean was distinct between the two seasons, sites, varieties and treatments in relation to the weather conditions. At Ruace, rainfall was high in 2018 notably increasing in frequency and amount towards the end of the season (Table 1) leading to better yield unlike in 2017. Temperature was comparable between the sites but declined towards the end of the seasons in Angonia creating favourable conditions for soybean rust (Fig. 1). In 2018, there was a late season attack of soybean rust which led to lower yield than the 2017 season for both varieties in Angonia. However, three steps were taken to combat the infestation in our test plots. First a contact fungicide Bravo (Chlorothalonil 500 g/l) ‘weatherstik’ was sprayed upon early detection. Then 7–14 days later a systemic fungicide Trister EC (triadimenol/trizoles 250 g/l) was applied before repeating the contact fungicide after 14 days. These fungicides reduced the severity of the rust damage in our experimental plots.
Physiological processes changes
Transpiration, photosynthesis and WUE
Transpiration, photosynthesis and WUE were distinct by variety, growth stage and input within each environment (Figs 2–5). In 2017 season, mean transpiration rate between podding and grain filling stage was 6.8 and 3.8 mmol/m2/s in Angonia and Ruace, respectively. In the second season, soybean at Angonia transpired at 5.7 v. 4.6 mmol/m2/s for Ruace between flowering and grain filling stage. When averaged across environments, varieties and inputs, transpiration increased from flowering stage 4.9 to 5.4 mmol/m2/s at podding before declining to 5.0 mmol/m2/s during grain filling stage (Fig. 2) although different trends were observed at the two locations. At Angonia in 2018, transpiration increased from flowering to podding then considerably declined towards grain filling stage. At all the three growth stages, differences in transpiration rate were observed either numerically or statistically between the inputs in both locations. In contrast to Angonia where a drop in temperature led to a reduced transpiration rate, at Ruace, the rate and amount of water loss through leaves continually increased from flowering to grain filling stage (Fig. 2). The rate at which soybean was losing water through the leaves at Ruace was significantly higher for the check than all the other inputs at podding while at Angonia, between podding (6.9 mmol/m2/s) and grain filling stage (4.2 mmol/m2/s), the magnitude of change in transpiration rate indicated by the slope was steep for check unlike for inoculant, N and P treatments.

Fig. 2. Colour online. Transpiration rate at growth stages of soybean in Angonia (a) and Ruace (b) at P < 0.05 significance level between the treatments at each growth stage. The error bars are ± s.e.m.

Fig. 3. Colour online. Photosynthesis rate of two soybean varieties at three growth stages Angonia (dotted lines) and Ruace (solid lines). Significance level at P < 0.05 between the varieties at each growth stage. The error bars are ± s.e.m.

Fig. 4. Colour online. Influence of nutrient amendments on WUE of soybean at different growth stages in (a) Angonia and (b) Ruace at P < 0.05 significance level between the treatments at each growth stage. The error bars are ± s.e.m.

Fig. 5. Colour online. Transpiration (dotted lines) and WUE (solid lines) of Safari and TGx 1740-2F at three growth stages in (a) Angonia and (b) Ruace at P < 0.05 significance level between the varieties at each growth stage. The error bars are ± s.e.m.
Photosynthesis was distinct at flowering but not podding and grain filling stage of the varieties within the environments (Fig. 3). Photosynthesis of both varieties declined at Angonia and Ruace from flowering to podding before slightly increasing as the grains filled. Varietal photosynthesis rate was statistically distinct at flowering and numerically different at podding stage in Angonia. Soybean at Angonia photosynthesized more than at Ruace at flowering and grain filling for both varieties. The relationship between photosynthesis and transpiration was used to determine WUE (Medrano et al., Reference Medrano, Tomás, Martorell, Flexas, Hernández, Rosselló, Pou, Escalona and Bota2015). WUE is a measure of plant dry matter or yield production per unit of water used. The WUE was dissimilar at different stages of plant development at both locations (Figs 4a and b). The WUE was not significantly different within growth stages between inputs. A declining trend of WUE was observed between flowering and podding stages in both locations, which later increased from podding to grain filling stage at Angonia unlike at Ruace where it continued on a reducing trajectory. However, at grain filling stages, there was better water utilization by soybean following application of inputs that contained inoculant at both locations. At Angonia the WUE increased from podding to grain filling stage mainly due to reduced transpiration that increased at Ruace (Figs 4a and b). The increase in transpiration at Ruace, on the other hand, led to a reduction in WUE. For both locations, there was an inverse relationship between transpiration and photosynthesis that affected the WUE. Similarly, the relationship between transpiration and WUE was inverse for both varieties at the three stages of growth (Figs 5a and b). Transpiration increased at Angonia from flowering to podding then decreased towards grain filling while, the WUE's response was inverse between the growth stages for both varieties Safari and TGx 1740-2F. On the contrary, photosynthesis had similar response as WUE, although the rate of change between growth stages were distinct when averaged across varieties and inputs. For instance, the magnitude of increase or decrease in photosynthesis was different between growth stages. This signifies that if the magnitude of an increase in photosynthesis is higher than the change in transpiration, then WUE will potentially improve.
Photosynthetically active radiation and LAI
The PAR values declined in Angonia as the plant developed with significant inputs differences between flowering and grain filling stage (Fig. 6a). While at Ruace PAR values slightly increased to podding before declining at grain filling stage with numerical differences observed between inputs and growth stages (Fig. 6b). The percent PAR values representing the light intercepted by soybean that received P fertilizer at podding stage were significant from the other inputs while those with N and inoculant were only numerically different from the check at Angonia. At this location, percent PAR intercepted for the inputs decreased from flowering to grain filling stage at different magnitudes. For instance, the rate of decrease in percent PAR intercepted between podding and grain filling stage by P+-inoculated field was faster than all other inputs. The change in PAR intercepted signify a decrease in the amount of leaves developed or change in the leaf angle orientation as the soybean plant matures. Similar to PAR intercepted trend between podding and grain filling stage, LAI of P+-inoculant treatment declined at a faster rate too (Fig. 6c). The LAI was significantly lower for the check than the other treatments at grain filling stage in Angonia. At the same site, inoculated soybean LAI insignificantly changed from the phenological stage of flowering to grain filling stage. Soybean that received inoculant and N at Angonia resulted in a higher LAI at grain filling stage. The rate at which the LAI increased between flowering and podding before declining towards grain filling stage at Ruace was different (Fig. 6d). Notably at this site, P+-inoculant resulted in a denser canopy at grain filling stage. The leaf canopy LAI results suggest that perhaps soybean development at Angonia is more restricted by the availability of N while at Ruace both P+inoculant is required to improve growth and productivity through increased leaf surface area that captures more light necessary for the photosynthesis process.

Fig. 6. Colour online. Photosynthetically active radiation (PAR) intercepted at (a) Angonia and (b) Ruace and LAI of soybean at (c) Angonia and (d) Ruace at different growth stages as influenced by nutrient amendments at significance level of P < 0.05 between the treatments at each growth stage. The error bars are ± s.e.m.
Biomass quality at R3 stage
Besides nodule characterization at R3 stage, samples were also collected from both sites Angonia and Ruace to ascertain the quality of biomass through determination of N, P and potassium (K) amount accumulated in the plant tissue. The amount of N (kg/ha) in the plant tissue at R3 stage was numerically higher than all the other inputs with application of N fertilizer (Fig. 7). Also, at this stage for all treatments except P, the amount of plant tissue N content was significantly higher for TGx 1740-2F than Safari. The varietal difference in the N content for P input treatment was numerically higher for TGx 1740-2F than Safari but not significant. This signifies that TGx 1740-2F had accumulated more N/ha than Safari. In both varieties, the amount of N in plant tissue showed that use of inoculant, N and P fertilizer was significantly higher than the check. When R3 plant tissue N is related to the production (Fig. 8), Safari yielded numerically more than TGx 1740-2F meaning that there is no direct relationship with the amount of nutrient in the plant tissue at one stage with the yield. In addition, use of inputs in both varieties yielded significantly higher than the check with the combination of P+inoculant having overall synergetic effect on production. The amount of P and K in plant tissue at R3 stage was also analysed. Accumulation of P and K in plant tissue at R3 stage was significant with variety within each site but not with treatment (Table 2). In both locations, there was higher N and P accumulated in the tissue of TGx 1740-2F while more K was stored in plant tissues of Safari at Angonia.

Fig. 7. Colour online. The effect of nutrient amendments on N in the biomass at soybean flowering stage at the two sites-Angonia and Ruace. Means are significantly different at P < 0.05 between the treatments and varieties. The error bars are ± s.e.m.

Fig. 8. Colour online. The interaction of grain yield at the two sites-Angonia and Ruace. Means are significantly different at P < 0.05 between the treatments and varieties across the seasons. The error bars are ± s.e.m.
Table 2. The amount of total N, P and K in biomass at R3 growth stage

Means compared using s.e.m. of variety per site at P ≤ 0.05 significant level between varieties for each variable per site
Nodulation, yield components and yield
Formation of nodules in soybean requires an association of the plant with the appropriate rhizobia strain. Our results showed that inoculant and P fertilizer applied either singly or in combination promoted nodulation leading to higher nodule numbers per plant than the check for the two soybean varieties (Table 3). Inoculating soybean at Angonia led to more nodule numbers per plant than when combined with P. The increase in the number of nodules per plant upon application of P+inoculant was statistically higher than inoculant or P alone for TGx 1740-2F at Ruace in 2018 while in 2017 significant differences were between individual input rather than the combinations. On the other hand, N application seemed to depress formation of nodules in both varieties and locations. There was no direct relationship between the number and the weight of the nodules although a similar trend as that observed with nodule population was depicted with the weights except at Angonia where there were heavier nodules following application of P fertilizer in 2017 season (Table 3). The nodules from P treatments plots in the two sites were relatively larger compared to the other inputs.
Table 3. Nutrient amendments effect on the number of nodules and weight at Angonia and Ruace
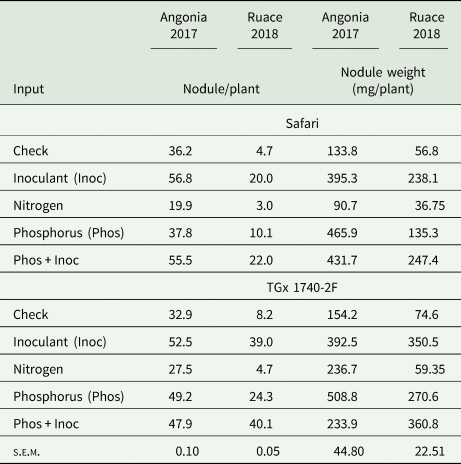
Input and variety differences within each environment compared using s.e.m. at P ≤ 0.05 significant level between inputs and across varieties for each variable within the environment (location × season).
Data were collected on three yield components namely; number of pods/m2, seeds/pod and 100 seed weight. These components varied among inputs both within and between sites. Results indicate that the pods/m2 and seeds/pod increased when inputs were used (Table 4). For instance, at Angonia 2017, application of N on Safari had the highest pods/m2 (2182) with the lowest seeds/pod (2.4) among the inputs (Table 4). At the same location, application of P+ inoculant on Safari resulted in more seeds/pod and the highest yield of 3615 kg/ha. The number of pods/m2, seeds/pod and 100 seed weight were distinct by location and treatment and different from the check in all sites, Safari had generally heavier seeds than the TGx 1740-2F and there exists a slight relationship of the number of seeds per pods being inverse to 100 seed weight for Safari at Angonia (Table 4). There is no direct relationship between and individual yield component and yield since their interaction is additive or counteractive in a complex manner to result into yield. An increase in one component could lead to a reduction or complimentary effect in another during plant growth.
Table 4. Yield and yield components of soybean varieties under nutrient amendments

The variety and input differences denoted by letters at P ≤ 0.05 significant level between inputs and across varieties for each variable
Regardless of location, all treatments resulted in a higher yield than the check for both varieties (Fig. 8). At Angonia, Safari a determinate variety had a numerically higher yield than TGx 1740-2F in both seasons for all treatments but not for P+-inoculant. At the same location in 2018 season, due to the rust attack, both varieties had a comparable yield for each treatment. At Ruace in the same season and a site with high initial P (Table 5), fields of TGx 1740-2F soybean that received inoculant gave higher yield than Safari unlike the check, N and P alone that posted opposite results between the varieties. Our results show that there is a potential to increase soybean yield through application of inoculant, N and P over the check. The yield increase potential ranges were N (108–927 kg/ha), inoculant (12–1145 kg/ha), P (114–955 kg/ha) and P+ inoculant (16–1401 kg/ha). These potential ranges derived from the two season's results for Angonia and Ruace locations in Mozambique indicate increase in yield one could get when using the different amendments in soybean production. It is evident that handling of inoculant is crucial in determining the final soybean yield. There is a wide potential yield increase range for the treatments that contained inoculant over singly applying N or P fertilizer.
Table 5. Soil properties (0–20 cm) and texture at Angonia and Ruace study sites

Discussion
Nutrient demand by soybean is elevated during the reproductive stage. Above ground biomass analysis showed more N and K accumulation in the plant tissue at R3 stage. Since both N and K are essential elements for photosynthesis and transpiration, they are expected to be in high amounts in biomass of actively growing soybean. From our experiment, promiscuous variety TGx 1740-2F accumulated more N and K in the above ground biomass at R3 stage than the non-promiscuous, Safari. Accumulation of N and K was also documented at R3 stage in cowpea that were either inoculated or received P fertilizer (Kyei-Boahen et al., Reference Kyei-Boahen, Savala, Chikoye and Abaidoo2017) and soybean (Savala and Kyei-Boahen, Reference Savala and Kyei-Boahen2020). Accumulation of N and K in TGx 1740-2F could be related to elevated transpiration. The transpiration rate of TGx 1740-2F was higher than that of Safari, except at grain filling stage in Angonia (Fig. 5a). Transpiration-driven mass-flow has a correlation with plant nutrient accumulation (Cramer et al., Reference Cramer, Hoffmann and Verboom2008; Matimati et al., Reference Matimati, Verboom and Cramer2014; Houshmandfar et al., Reference Houshmandfar, Fitzgerald, O'Leary, Tausz-Posch, Fletcher and Tausz2018). Similar to N, P must be supplied to biological N fixing plants to maintain nodule tissue and provision of energy ATP required for biochemical processes. As a result, roots and nodules become an important P sink in N fixing plants (Jakobsen, Reference Jakobsen1985; Hart, Reference Hart1990). BNF imposes a high phosphorus demand and therefore can only occur when the nutrient is sufficient in soil (Tefera et al., Reference Tefera, Kamara, Asafo-Adjei and Dashiell2010). Supplying N and P to soybean is important for canopy development that captures more radiation for the photosynthesis process. The nutrients are found in varied amounts in plant tissue to facilitate essential biochemical processes. Nitrogen and K accumulated more in the above ground matter than P which has been reported to be stored more in the roots. Results from our study show low P values in the above ground biomass at R3 stage. Perhaps the P element accumulated in the plant roots and nodules tissues (not analysed in our study) unlike in the above ground biomass. Therefore, it is important to provide N, P and K nutrients in soybean production to improve productivity. Inoculation and application of N and P fertilizer in soybean production improves plant development and biochemical processes that improved WUE especially during podding which leads to an increase in the final yield. The key in realizing the benefits of supplying these nutrients lies in the timing and judicious application of inoculants, organic and inorganic fertilizers in soybean production. Other activities that improve nutrient exploration and uptake by plants roots from the soil such as mychorrizal associations (not evaluated in this study) could offer additional agronomic information on input utilization. Improving soybean growth characteristics and enhancing efficient N and P assimilation through formation of mychorrizal associations that promote biochemical processes could be attained through breeding. In future, information on related mychorrizal associations that promote P extraction from the soil by soybean could also be evaluated alongside inoculants to select for agroecologically suitable fungi. These improved varieties can be adapted to a wide range of changing climatical conditions within numerous agroecologies and be adopted by farmers who will increase production of soybean per unit area.
Inputs that supply N and/or P promoted soybean development and improves yield production. Our study shows that using inputs in production of soybean in different sites leads to distinct yield increase potentials. The yield increase potentials are dependent on the availability of nutrients in an agroecological zone, climatic conditions favouring a variety and the accompanying soybean agronomic management practices. Differences in the yield increase potential signifies variation of soybean variety suitability in a particular agroecology. Bekere and Hailemaria (Reference Bekere and Hailemaria2012) reported increase in soybean yield when singly inoculated (256–480 kg/ha) and with P fertilizer application (264–801 kg/ha) while Majengo et al. (Reference Majengo, Okalebo, Lesueur, Pypers, Ng'etich, Misyoki and Mburu2011) found out that inoculation increased soybean yield between 0.5 and 1.0 t/ha in Western Kenya. Production of soybean in Mozambique and Southern Africa in general can be improved through selection of varieties suitable for specific regions, application of cost-effective inputs and marching them with good agronomic management practices. In a good season such as at Angonia in 2017, use of inoculant, N or combining P+ inoculant was advantageous for both varieties. In this same location, use of P alone was not beneficial but performed better when combined with inoculant. High yield was realized when P+inoculant was applied on both varieties. Similar results of synergetic effect of combining P+inoculant were reported for soybean production in Pakistan (Afzal et al., Reference Afzal, Asghari and Mussarat2010). Inoculation alone on the other hand, yielded higher at Ruace especially for TGx 1740-2F. This signifies that P levels in the soil at this location were also high (Table 1) and that a lower application rate could be sufficient for soybean production. Application of these nutrient to soil act together with specific location conditions impacting on soybean development such as nodulation, number of pods and seed weight that contribute towards yield in a complex interaction. Since inoculant could easily be affordable among most smallholder farmers, their soybean yield could increase by 61% (1145 kg/ha). However, combining P with the inoculant would improve yield more by 76% (1401 kg/ha). Of course, this yield increase on P application and inoculation does not negate the importance of supplying N in low quantities as a starter fertilizer for soybean production where necessary in depleted soils. When P is adequate in the soil, inoculation will promote soybean root development enhancing P scavenging ability (He et al., Reference He, Du, Wang, Turner, Yang, Jin, Xi, Zhang, Cui, Fang and Li2017). For such locations, breeding for soybean varieties with better P scavenging abilities or promoting soil mychorrizal associations would boost the benefits of inoculation.
Inoculation of soybean and other legumes is economically justifiable in many SSA fields due to its low cost in comparison to inorganic fertilizers (Kyei-Boahen et al., Reference Kyei-Boahen, Savala, Chikoye and Abaidoo2017). However, selection of appropriate input should be done after soil analysis, which is seldom among smallholder farmers in Africa, to determine the most limiting and other deficient nutrients before deciding on the rate. Safari responded to inoculant better than TGx 1740-2F at Angonia, perhaps due to reduced ability of introduced rhizobia to form association or a result of competition from ineffective indigenous strains with the latter variety. Inoculating with the right rhizobia strain results in more N assimilation hence increased yield (Giller et al., Reference Giller, Murwira, Dhliwayo, Mafongoya and Mpepereki2011). Use of inoculants improves yield of both determinate and indeterminate varieties especially in soils with no previous history of soybean production (Sanginga et al., Reference Sanginga, Okogun, Vanlauwe and Dashiell2002; Zimmer et al., Reference Zimmer, Messmer, Haase, Piepho, Mindermann, Schulz, Habekuß, Ordon, Wilbois and Heß2016). Therefore, inoculant and P are essential for both the host plant and rhizobia in the BNF process. The symbiotic relationship between the nitrogen fixing legumes and the rhizobia strain leads to transformation of atmospheric N into forms that can be absorbed by the plant while the bacteria benefits by acquiring assimilates from the host plant.
Inoculation provides the right rhizobia strain for symbiotic association for both the promiscuous and non-promiscuous varieties leading to formation of more nodules on soybean roots. There were significantly more nodules per plant in inoculated treatments of TGx 1740-2F than Safari at Ruace. Perhaps at Ruace, apart from the introduced strains, TGx 1740-2F could have formed additional associations with resident strains that promoted more nodulation. Our findings concur with nodulation results between promiscuous and non-promiscuous varieties where nodule numbers per plant at podding stage for TGx 1893-10F were significantly higher than Gazelle when inoculated in Meru, Kenya (Gitonga et al., Reference Gitonga, Gatheri, Cheruiyot, Gitonga and Maingi2010). The relationship between the nodule numbers and their weights was not clear in all the sites despite the existence of a trend possibly because of the variation in nodule size i.e. those formed at the crown are bigger than those on the lateral roots. It was evident that from the variability in nodule weight, that the size of the nodules also varied between site. Some treatments had large nodules that resulted in a higher weight. For instance, comparable nodule numbers at Angonia between P and P+inoculant corresponded to different weights. Several studies have reported high nodule number when inoculant is applied together with P fertilizer. A high nodule number and increased BNF process was reported with inoculated soybean that received supplemental P fertilizer at Sumbrungu, Ghana (Akpalu, Reference Akpalu2014) and Bvumbwe, Malawi (Phiri et al., Reference Phiri, Kausiwa, Omollo, Muindi and Yegon2016). Although the number of nodules and weight could be an indicator of high BNF process, it is not always the case unless the nodule activity is determined.
Interaction of yield components such as pods per plant, seeds per pod and seed weight affects the final production of soybean. Increase in number of pods, seeds per pod and heavier seeds if considered singly are likely to positively correlate with higher yield. As observed in some locations, more seeds per pod corresponded to high number of seeds while less seeds per pod led to a high weight of 100 seeds. The complex interaction and differences in yield components emphasize plant compensation in response to input application and management (Pedersen and Lauer, Reference Pedersen and Lauer2004). Varietal differences play a role in the resultant seed weight. Safari had generally heavier seeds than TGx 1740-2F. There were also some varietal differences in the number of pods/m2; mostly, the indeterminate variety TGx 1740-2F had more pods/m2. This could be as a result of the TGx 1740-2F variety having longer reproductive period (60 days) v. Safari (56 days) in Ruace (data not reported). Comparable pods/m2 for promiscuous varieties have been reported when evaluating TGx 1835-10E, TGx 1904-6F and TGx 1448-2F at Samaru Zaria in the northern Guinea savanna and Samaru-Kataf in the southern Guinea savanna (Kamara et al., Reference Kamara, Ewansiha, Boahen and Tofa2014) and five TGx varieties against non-promiscuous Bossier in Tanzania (Lyimo et al., Reference Lyimo, Tamba and Madege2017). Although TGx 1740-2F variety is popular, breeders have a challenge to increase the seed size without compromising the pod seed density.
The process of transpiration, photosynthesis and WUE are affected by both biotic and abiotic factors. Biotic factors that affect these processes are plant canopy characteristics (leaf angle, size, colour and stomata) and root development while the abiotic factors include temperature, soil moisture, sunlight and wind. These factors interact to determine the rate of the processes. Agronomic management have an effect on plant characteristics and soil moisture availability. Transpiration increased from flowering to podding at different rates when inputs were applied. By the time of grain filling stage, most of the soybean had reached canopy closure covering the soil hence reducing air current movement leading to comparable transpiration rate for all the inputs. The increase was occasioned by leaf development in size and number which created a large surface area and more active stomata. As plant grows, leaf density in relation to the ground area known as LAI increases affecting PAR intercepted. As more radiation is intercepted by the actively photosynthesizing leaves, the percent PAR increases. However, there is a caveat to an increase in percent PAR and the plant productivity. A higher PAR does not necessarily translate to a more productive plant canopy but rather only indicate the amount of radiation intercepted. The productivity will depend on the amount of actively photosynthesizing leaves in the canopy. Since the PAR was determined between flowering and grain filling stage when most of the leaves are photosynthesizing, the values could be an indicator of productivity. Coupled with environmental factors such as temperature, wind and soil moisture, soybean lost water through the leaves to help cool the plant and transport nutrients by mass-flow from the roots to above ground tissues. There was a relatively low transpiration rate with inoculated fields perhaps due to some of the imbibed water being retained in the root system to maintain turgidity and BNF activity of the nodules. At flowering, fewer leaves had developed at Ruace than Angonia. However, by the time of podding, soybean in both locations had a comparable canopy with LAI between 3.5 and 4.5. It has been reported that excess increase in the LAI at flowering stage could lead to increased microclimate temperatures that cause flower abortion in soybean, hence lowering the yield. Inoculated soybean also had a low LAI than P treatments between flowering and podding stages. Inoculation reduced transpiration of TGx1485-1D and TGx1440-1E unlike in TGx1448-2E, TGx1740-2F and TGx1445-3E where it led to elevated stomatal conductance that resulted in more water loss (Pule-Meulenberg et al., Reference Pule-Meulenberg, Gyogluu, Naab and Dakora2011). Therefore, it is possible for transpiration rate to be different among genotypes of a particular crop with respect to the environment and management practices such as nutrient supply. However, high transpiration rates due to increased mesophyll over stomatal conductance has been found not to affect carboxylation that is necessary for photosynthesis in some soybean varieties (Buezo et al., Reference Buezo, Sanz-saez, Moran, Soba and Aranjuelo2019).
There were also distinct transpiration trends between podding and grain filling stages with respect to varieties and sites. At Angonia for instance, the rate declined between these stages perhaps due to cooling of the atmospheric temperatures that started in the month of April which could have reduced the activity of many biochemical processes. The declining temperatures coincided with the period between the stages. Temperature seems to have been the main factor driving the transpiration process since the other factors such as soil moisture were not limiting due to available rains. As temperature declines, the transpiration rate also decreases because the vapour pressure gradient between the leaves and the surrounding air become low (Fletcher et al., Reference Fletcher, Sinclair and Allen2007). Contrarily, the rate increased between the stages at Ruace. At Ruace, the temperature did not reduce (Fig. 1) at the period between podding and grain filling, as air remained warmer, creating a steep vapour pressure gradient. High air temperatures and low humidity conditions lead to an increase in the transpiration due to increased stomatal conductance (Habermann et al., Reference Habermann, Dias de Oliveira, Contin, San Martin, Curtarelli, Gonzalez-Meler and Martinez2019). Following the two transpiration rate scenarios between the two locations, it was also noted that soybean dried in a shorter period (98 days after emergence) at Ruace than Angonia (over 108 days after emergence). Use of N and P inputs in soybean production reduced the transpiration rate in relation to photosynthesis rate unlike for the check. The check took a longer period for the canopy to close coupled with less nutrient uptake at flowering stage and decreasing LAI between podding and grain filling stages leading to open large exposed intra-row soil surface. Open spaces between rows could have led to more wind currents that resulted in increased transpiration.
Photosynthesis differences were prominent between varieties and sites than with the inputs (Fig. 3). There were distinct differences in the photosynthesis rates between the varieties at Angonia and Ruace. At Ruace the rate did not change significantly with the TGx 1740-2F variety from flowering to podding through to grain filling stage. TGx 1740-2F continually develops new leaves which have longer life span than Safari. However, significant differences in photosynthesis between Safari and TGx 1740-2F were observed at flowering in Angonia and at podding in Ruace. The increase in the photosynthesis rate between podding and grain filling stage seem to have a bearing on yield. At grain filling stage, photosynthesis rate between Safari (21.3 μmol/m2/s) and TGx 1740-2F (20.6 μmol/m2/s) was slightly numerically different but statistically insignificant and corresponded to a yield of 2520 and 2247 kg/ha respectively at Angonia. Nagasuga (Reference Nagasuga and Kasai2019) reported that soybean yield could be improved through elevated photosynthesis that increases pod and seed numbers. Comparable soybean seasonal carbon dioxide exchange rate values that estimate photosynthesis between R1 and R6 (De Bruin et al., Reference De Bruin, Singer, Pedersen and Rotundo2010) R2 and R4 (Gai et al., Reference Gai, Zhang and Li2017) have also been documented similar to our findings between R3 and R6 growth stages.
The ratio of photosynthesis to transpiration was used to determine WUE that estimated plant productivity per unit of water spend at particular stage depended on variety and input applied. Treatments that received fertilizer or inoculant-based N had a higher WUE. Nitrogen is a major component of leaf chlorophyll and amino acids that are protein and nucleic acids (deoxyribonucleic acid-DNA) building blocks. Availability of N which leads to increased photosynthesis was reported in China (Gai et al., Reference Gai, Zhang and Li2017). The study found out that as N was applied at 0, 25 and 50 kg N/ha, the photosynthesis rate of soybean at R2 stage increased (23.54, 23.59 and 36.42 μmol CO2/m2/s), respectively. Therefore, inputs that avail more N to plants such as inoculants and organic fertilizers lead to increased photosynthesis hence increased WUE. This indicates that use of inoculant, timely application of N and P fertilizers in soybean production provide important elements necessary for photosynthesis, better WUE could translate into improved soybean yield in Mozambique and the larger southern Africa region.
Conclusion
Yield of both promiscuous and non-promiscuous soybean varieties in Mozambique can be improved by use of inoculants and application of supplemental P fertilizer. Use of inoculant that is economically justifiable due to its low cost in relation to the inorganic fertilizers, N and P either singly or in combination led to an increase in soybean yield in all the sites. Soybean plant processes such as transpiration, photosynthesis, WUE, PAR and LAI vary depending on the type of nutrient applied. As a result of increased WUE, soybean will utilize water efficiently to produce more biomass especially grain production that lead to an increase in yield per unit area.
Acknowledgements
The authors greatly acknowledge financial support from the Consortium of International Agricultural Research Centers (CGIAR) through the Research Program on Grain Legumes and Dryland Cereals (CRP-GLDC) in Mozambique. Thanks to the IITA technical staff at Angonia and Gurue stations in Mozambique for managing the trials and collecting of field-related data.
Financial support
This work was supported by the Consortium of International Agricultural Research Centers (CGIAR) through the Research Program on Grain Legumes and Dryland Cereals (CRP-GLDC).
Conflict of interest
The authors declare that the research was conducted in the absence of any commercial or financial benefits that could be construed as a potential conflict of interest.
Ethical standards
Not applicable.


 Open access