

Introduction
Soybean is an economically important crop worldwide and a major source of edible oil and protein. Improving protein content (PC) and oil content (OC) is an important objective in soybean breeding programs. These quantitative traits are controlled by multiple genes and affected by the environment. Detecting quantitative trait loci (QTLs) underlying PC and OC in soybean is helpful to improve the efficiency of soybean breeding.
Diers et al. (Reference Diers, Keim, Fehr and Shoemaker1992) identified eight QTLs PC and nine QTLs for OC by mapping a population derived from a cross between a G. max experimental line (A81-356022) and the wild soybean (G. soja) line PI468916. Since then a growing number of QTLs controlling protein and OC have been identified. As of December 2018, 241 QTLs for PC and 339 QTLs for OC have been detected according to SoyBase (http://www.soybase.org). These QTLs were detected using F2 and recombinant inbred line (RIL) populations derived from crosses between two parents (Liang et al., Reference Liang, Yu, Wang, Lian, Wang, Wei, Gong, Liu, Fang and Zhang2010; Qi et al., Reference Qi, Han, Sun, Wu, Shan, Du, Liu, Jiang, Hu and Chen2011a; Lu et al., Reference Lu, Wen, Li, Yuan, Li, Zhang, Huang, Cui and Du2013). However, this technique fails to identify some QTLs due to the relatively small differences in the additive effects of putative QTLs and the low degree of coverage of the genome, because molecular markers often exhibit little polymorphism between two parents.
To increase the power of QTL detection, Xu (Reference Xu1996, Reference Xu1998) developed a QTL mapping technique based on a four-way (FW) hybrid design. Furthermore, Ning et al. (Reference Ning, Li, Li, Xue, Li, Bai, Zhuang and Li2015, Reference Ning, Bai, Li, Xue, Zhuang, Li and Liu2016) established a FW-RILs population in soybean that was subsequently used for linkage map construction and QTL detection for PC and OC (Ning et al., Reference Ning, Bai, Li, Xue, Zhuang, Li and Liu2016) and pod number-related traits (Liu et al., Reference Liu, Xue, Zhang, Wang, Su, Li, Xu, Zhang, Qi, Fang, Li, Wang, Tian, Song, Wang, Yang, Jiang, Li and Ning2019). Because of highly polymorphic molecular markers, FW-RILs populations show more variation than common mapping populations. The construction of FW-RILs populations involves four parents, and each QTL has a maximum of four alleles. As long as there is a substantial difference in genetic effects between two alleles in a QTL, the QTL can be detected.
There is a significantly negative correlation between PC and OC in soybean (Zhang et al., Reference Zhang, Huang, Li, Hu and Dai2004). The mutual interference among these traits can affect the results of QTL mapping. Zhu (Reference Zhu1995) proposed a conditional variable method to analyse the related traits that could eliminate the mutual influence of these traits and improve the accuracy of estimating the genetic effects of QTLs. This conditional method has been used for QTL mapping in rice (Oryza sativa) (Liu et al., Reference Liu, Niu, Jiang, Sun, Chen, Guo, Fu and Hong2012), oilseed rape (Brassica napus) (Jiao et al., Reference Jiao, Huang, Wang, Zhang, Xiong, Ni and Zhao2015) and wheat (Triticum aestivum) (Tian et al., Reference Tian, Liu, Zhu, Xie and Tian2011).
The current study aimed to enhance the detection of QTLs for PC and OC and improve the accuracy of QTL mapping. The PC and OC data obtained from an FW-RIL soybean population (Ning et al., Reference Ning, Bai, Li, Xue, Zhuang, Li and Liu2016) were reanalysed by both unconditional and conditional methods. The QTLs controlling PC and OC identified in the current study will facilitate the molecular breeding of soybean.
Materials and methods
Plant materials
Four parental soybean lines that significantly differ in terms of PC and OC, i.e. Kenfeng14 (PC 39.69%, OC 20.34%), Kenfeng15 (PC 38.68%, OC 22.76%), Heinong48 (PC 44.71%, OC 19.05%) and Kenfeng19 (PC 42.52%, OC 19.26%), were mated in a four-way cross. In 2008, two single crosses, Kenfeng14 × Kenfeng15 and Heinong48 × Kenfeng19, were performed and in 2009, the progeny were crossed as (Kenfeng14 × Kenfeng15) × (Heinong48 × Kenfeng19) in Harbin (44°05′N, 125°42′E, 127.95 m a.s.l), Heilongjiang Province, China. From 2010 to 2012, the progeny were planted in Harbin in the summer and Hainan (17°50′N, 109°00′E, 130.12 m a.s.l) in the winter, and each individual was selected by the single-seed descent method. Ultimately, 160 FW-RILs were obtained, which were subjected to phenotypic and genotypic analyses.
Field experiment and evaluation of phenotypic traits
The four parental and 160 FW-RIL lines were planted in Harbin and Keshan (48°03′N, 125°53′E, 236 m a.s.l), as follows: in 2013, plants were sown on 10 May at planting densities of 2.22 × 10⁵ plants/ha and 2.80 × 10⁵ plants/ha, in Harbin (E1) and Keshan (E2), respectively. In 2014, parental lines and FW-RILs were both planted at 2.22 × 10⁵ plants/ha, in Harbin only, on 10 May (E3) and 20 May (E4). Finally, in 2015, all sowing was done on 10 May but at four planting densities: 2.2 × 10⁵ plants/ha (E5) and 3.08 × 10⁵ plants/ha (E6) in Harbin, and 2.58 × 10⁵ plants/ha (E7) and 3.51 × 10⁵ plants/ha (E8) in Keshan for parental and FW-RILs, respectively (the planting and management plan is shown in Table S1). The parents (parental traits are shown in Table S2) and FW-RILs were planted in a randomized complete block design with three replications. A plot containing three rows (3 m long × 0.65 m wide) was planted for each line. The seeds of ten mature plants from the middle row of each plot were harvested, and the PC and OC of the dry matter of seed determined using an Infratec 1241 NIR Grain Analyser (FOSS, Sweden).
Simple-sequence repeat analysis and construction of a genetic linkage map
The third tender trifoliate leaf was collected from each FW-RILs line and stored in liquid nitrogen: DNA was extracted from the samples using the cetyl trimethylammonium bromide method. A total of 638 simple sequence repeat (SSR) markers evenly distributed across the soybean genome (Cregan et al., Reference Cregan, Jarvik, Bush, Shoemaker, Lark, Kahler, Kaya, Vantoai, Lohnes, Chung and Specht1999) were selected to screen for polymorphisms among the four parents. Of these, 275 primer pairs showed polymorphism in the FW-RILs and were used for SSR genotyping. A genetic map of soybean containing 275 SSR primers on 20 linkage groups was constructed using GAPL 1.0 software (https://www.gap-system.org/Releases/4.10.1.html). Two adjacent markers in the genetic map with a genetic distance ⩾40 cM were uncoupled, reducing the length of the genetic map. The map covers a genome length of 3636.26 cM with an average length between markers of 15.47 cM. The length of each linkage group ranges from 49.36 to 319.02 cM and the number of markers varies from 6 to 20 (Ning et al., Reference Ning, Li, Li, Xue, Li, Bai, Zhuang and Li2015).
Conditional variable
The conditional effect value was calculated through the method described by Zhu (Reference Zhu1995). Specifically, conditional variables were estimated using the following formula:


where y pro|oil is the conditional variable PC (dependent on OC), calculated by subtracting the influence of OC from PC. Similarly, y oil|pro is the conditional variable OC (dependent on PC). y pro and y oil are the PC and OC of each individual, respectively, while $\mathop {\bar{y}}\nolimits_{pro}$ and $\mathop {\bar{y}}\nolimits_{oil}$
 are the mean values of these contents. C pro,oil and C oil,pro are the covariance between PC and OC, and V pro and V oil are the variance of PC and OC, respectively. The conditional variables were calculated using Microsoft Excel 2010.
Phenotypic data analysis
Based on the mean of unconditional and conditional variables of the three replicates per line in each environment, descriptive and correlation analyses were conducted, respectively. An analysis of variance (ANOVA) was carried out depending on the unconditional and conditional variables of the three replicates per line for each environment. All analyses were conducted using SAS 9.2 software (SAS Institute Inc., USA).
Heritability was estimated using the following equations:
For a single environment

For multiple environments

where h 2 indicates the broad sense heritability, $\sigma _G^2$ is the genetic variance, $\sigma _{GE}^2$
 is the variance due to the genotype × environment interaction, $\sigma _\varepsilon ^2$
 is the error variance, r is the number of blocks and e is the number of environments in the study. $\sigma _G^2$
 , $\sigma _\varepsilon ^2$
 and $\sigma _{GE}^2$
 were estimated using a mixed method implemented using Proc Mixed in SAS 9.2.
Quantitative trait loci analysis
The phenotypes of unconditional and conditional means of PC and OC for each line in every environment and the linkage map were used for QTL analysis via interval mapping (IM) (Lander and Botstein, Reference Lander and Botstein1989) and inclusive complete interval mapping (ICIM) (Li et al., Reference Li, Ye and Wang2007). The QTLs were identified using logarithm of the odds (LOD) thresholds of the empirical value generated based on 1000 permutations at 0.05 probability of type I error and the least LOD was 2.5. A QTL that was detected by two methods simultaneously was considered to be real.
Naming conventions for quantitative trait loci
QTLs were named as follows: q + trait name − chromosome name − sequence number, where q represents QTL, Pro represents PC and oil represents OC. QTLs that were mapped to the same marker region were given the same sequence number. Unified numbering was applied for both methods (IM and ICIM).
The linkage maps were exhibited using MapChart 2.1 (https://www.wur.nl/en).
Results
Phenotypic variation
For the FW-RILs, the frequency of individuals for PC and OC followed a normal distribution (Fig. 1, Table 1). For a single environment, the PC and OC for the FW-RILs (Table 2) exhibited a significant variation in all eight environments. For multiple environments, the variation among genotypes, environments and genotype × environments was significant at P < 0.01, indicating that the population was suitable for QTL mapping studies and could potentially reveal a variety of QTLs in different environments.
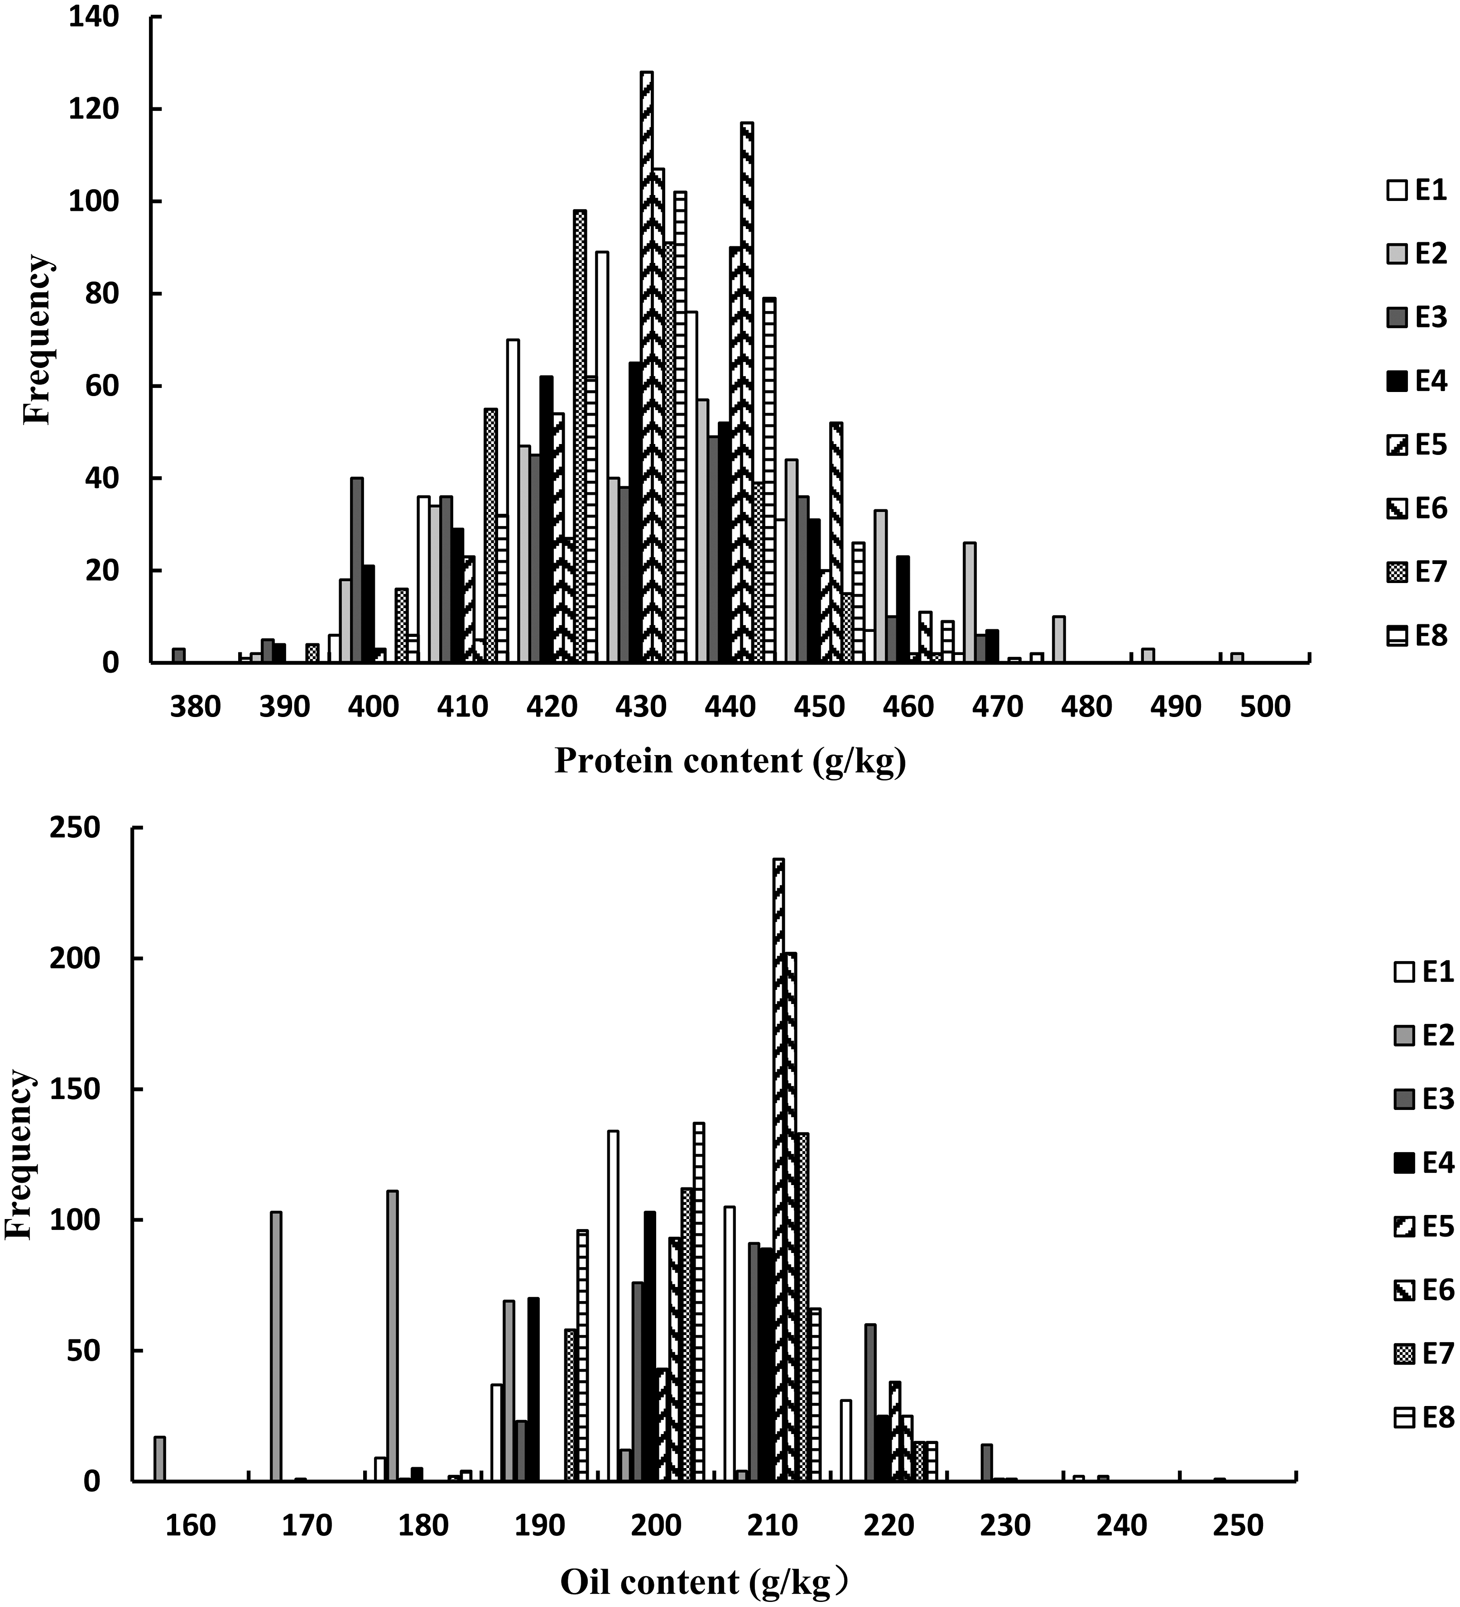
Fig. 1. Frequency distribution of PC and OC QTLs in FW-RILs. E, environment; E1, Harbin in 2013; E2, Keshan in 2013; E3, the first sowing date in Harbin in 2014; E4, the second sowing date in Harbin in 2014; E5, 2.22 × 10⁵ plants/ha in Harbin; E6, 3.08 × 10⁵ plants/ha in Harbin; E7, 2.58 × 10⁵ plants/ha in Keshan; E8, 3.51 × 10⁵ plants/ha in Keshan.
Table 1. Descriptive analysis of PC and OC under different environments
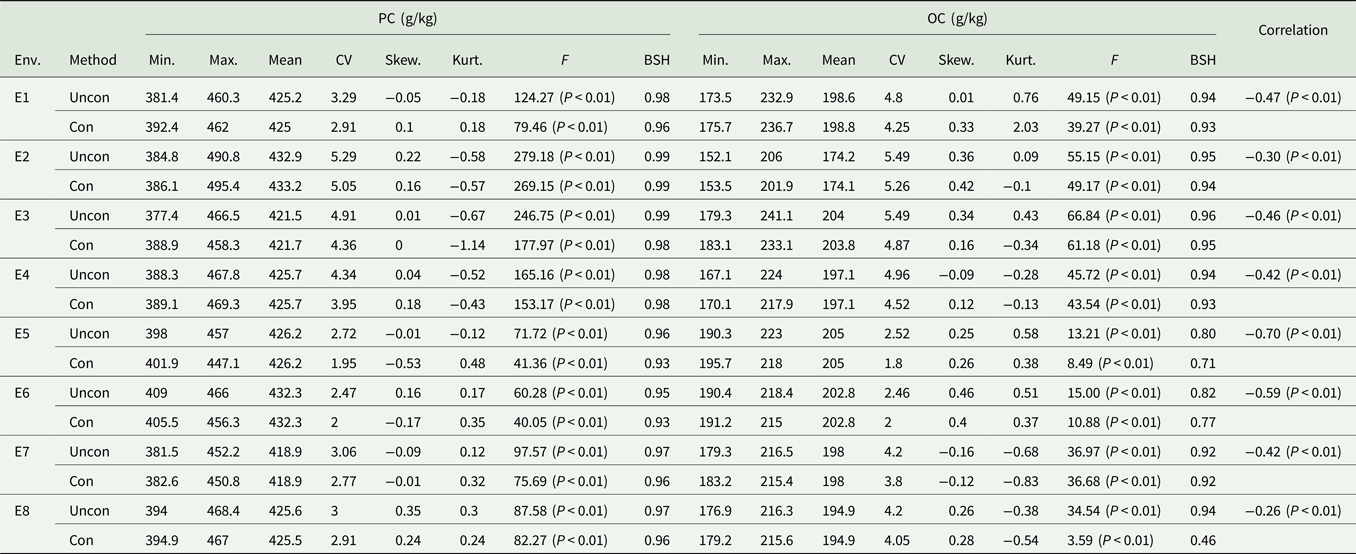
Env, environment; Uncon, unconditional variables; Con, conditional variables; Min., minimum; Max., maximum; Skew., skewness; Kurt., kurtosis; CV, coefficient of variation and the unit is %; BSH, broad-sense heritability.
Table 2. Analysis of variance and heritability of PC and OC across multiple environments in FW-RILs
PC|OC, protein content condition on oil content in eight environments; OC|PC, oil content condition on protein content in eight environments; Min, minimum; Max, maximum; CV, coefficient of variation; F E, F value for environment effects; F G, F value for genetic effects; F G×E, F value for genotype × environment interaction effects; BSH, broad-sense heritability.
Correlation and heritability analysis
The correlation between PC and OC based on unconditional and conditional variables is shown in Table 1. There was a significant negative correlation between the unconditional variables of PC and OC. The heritability of the two traits, which was estimated based on the conditional variables, was different from that of the unconditional variable, indicating that the negative correlation between PC and OC has a greater impact on the variation of each trait. The coefficient of variation, skewness and kurtosis of unconditional variables were higher than those of the conditional variables, indicating that this negative correlation influences the degree of variation of the phenotypic values of these two traits.
Quantitative trait loci associated with protein content
Among the eight environments, 34 QTLs associated with PC were identified on 16 chromosomes (A1, A2, B1, B2, C1, C2, D1b, D2, F, G, H, J, K, L, M and N) (Fig. 2, Fig. S1) in the FW-RILs, which explained 2.85–15.40% of the total variation (Table 3). Of these QTLs, 13 (qPro-A1-1, qPro-A1-2, qPro-A1-3, qPro-B2-1, qPro-C2-1, qPro-D2-2, qPro-D2-3, qPro-F-1, qPro-F-2, qPro-H-1, qPro-H-2, qPro-N-2 and qPro-N-4) were only identified by unconditional variable analysis, indicating that the expression of these QTLs was not affected by OC. Eight QTLs (qPro-A1-4, qPro-B1-1, qPro-B2-3, qPro-D1b-1, qPro-G-1, qPro-G-2, qPro-M-1 and qPro-N-1) were only identified by conditional variable analysis, indicating that the expressions of these QTLs were completely affected by OC. The 13 remaining QTLs (qPro-K-2, qPro-N-3, qPro-A2-1, qPro-A2-2, qPro-B2-2, qPro-C1-1, qPro-D1b-2, qPro-D1b-3, qPro-D2-1, qPro-J-1, qPro-K-1, qPro-K-3 and qPro-L-1) were detected by both conditional and unconditional variable analysis, indicating that the expression of these QTLs was partially affected by OC. Comparing phenotypic variation explanation (PVE) ratio and additive effects, two QTLs (qPro-D1b-2 and qPro-D1b-3) were slightly affected by OC, and 11 of the 13 QTLs (qPro-A2-1, qPro-A2-2, qPro-B2-2, qPro-C1-1, qPro-D2-1, qPro-J-1, qPro-K-1, qPro-K-2, qPro-K-3, qPro-L-1 and qPro-N-3) were partially affected by OC.
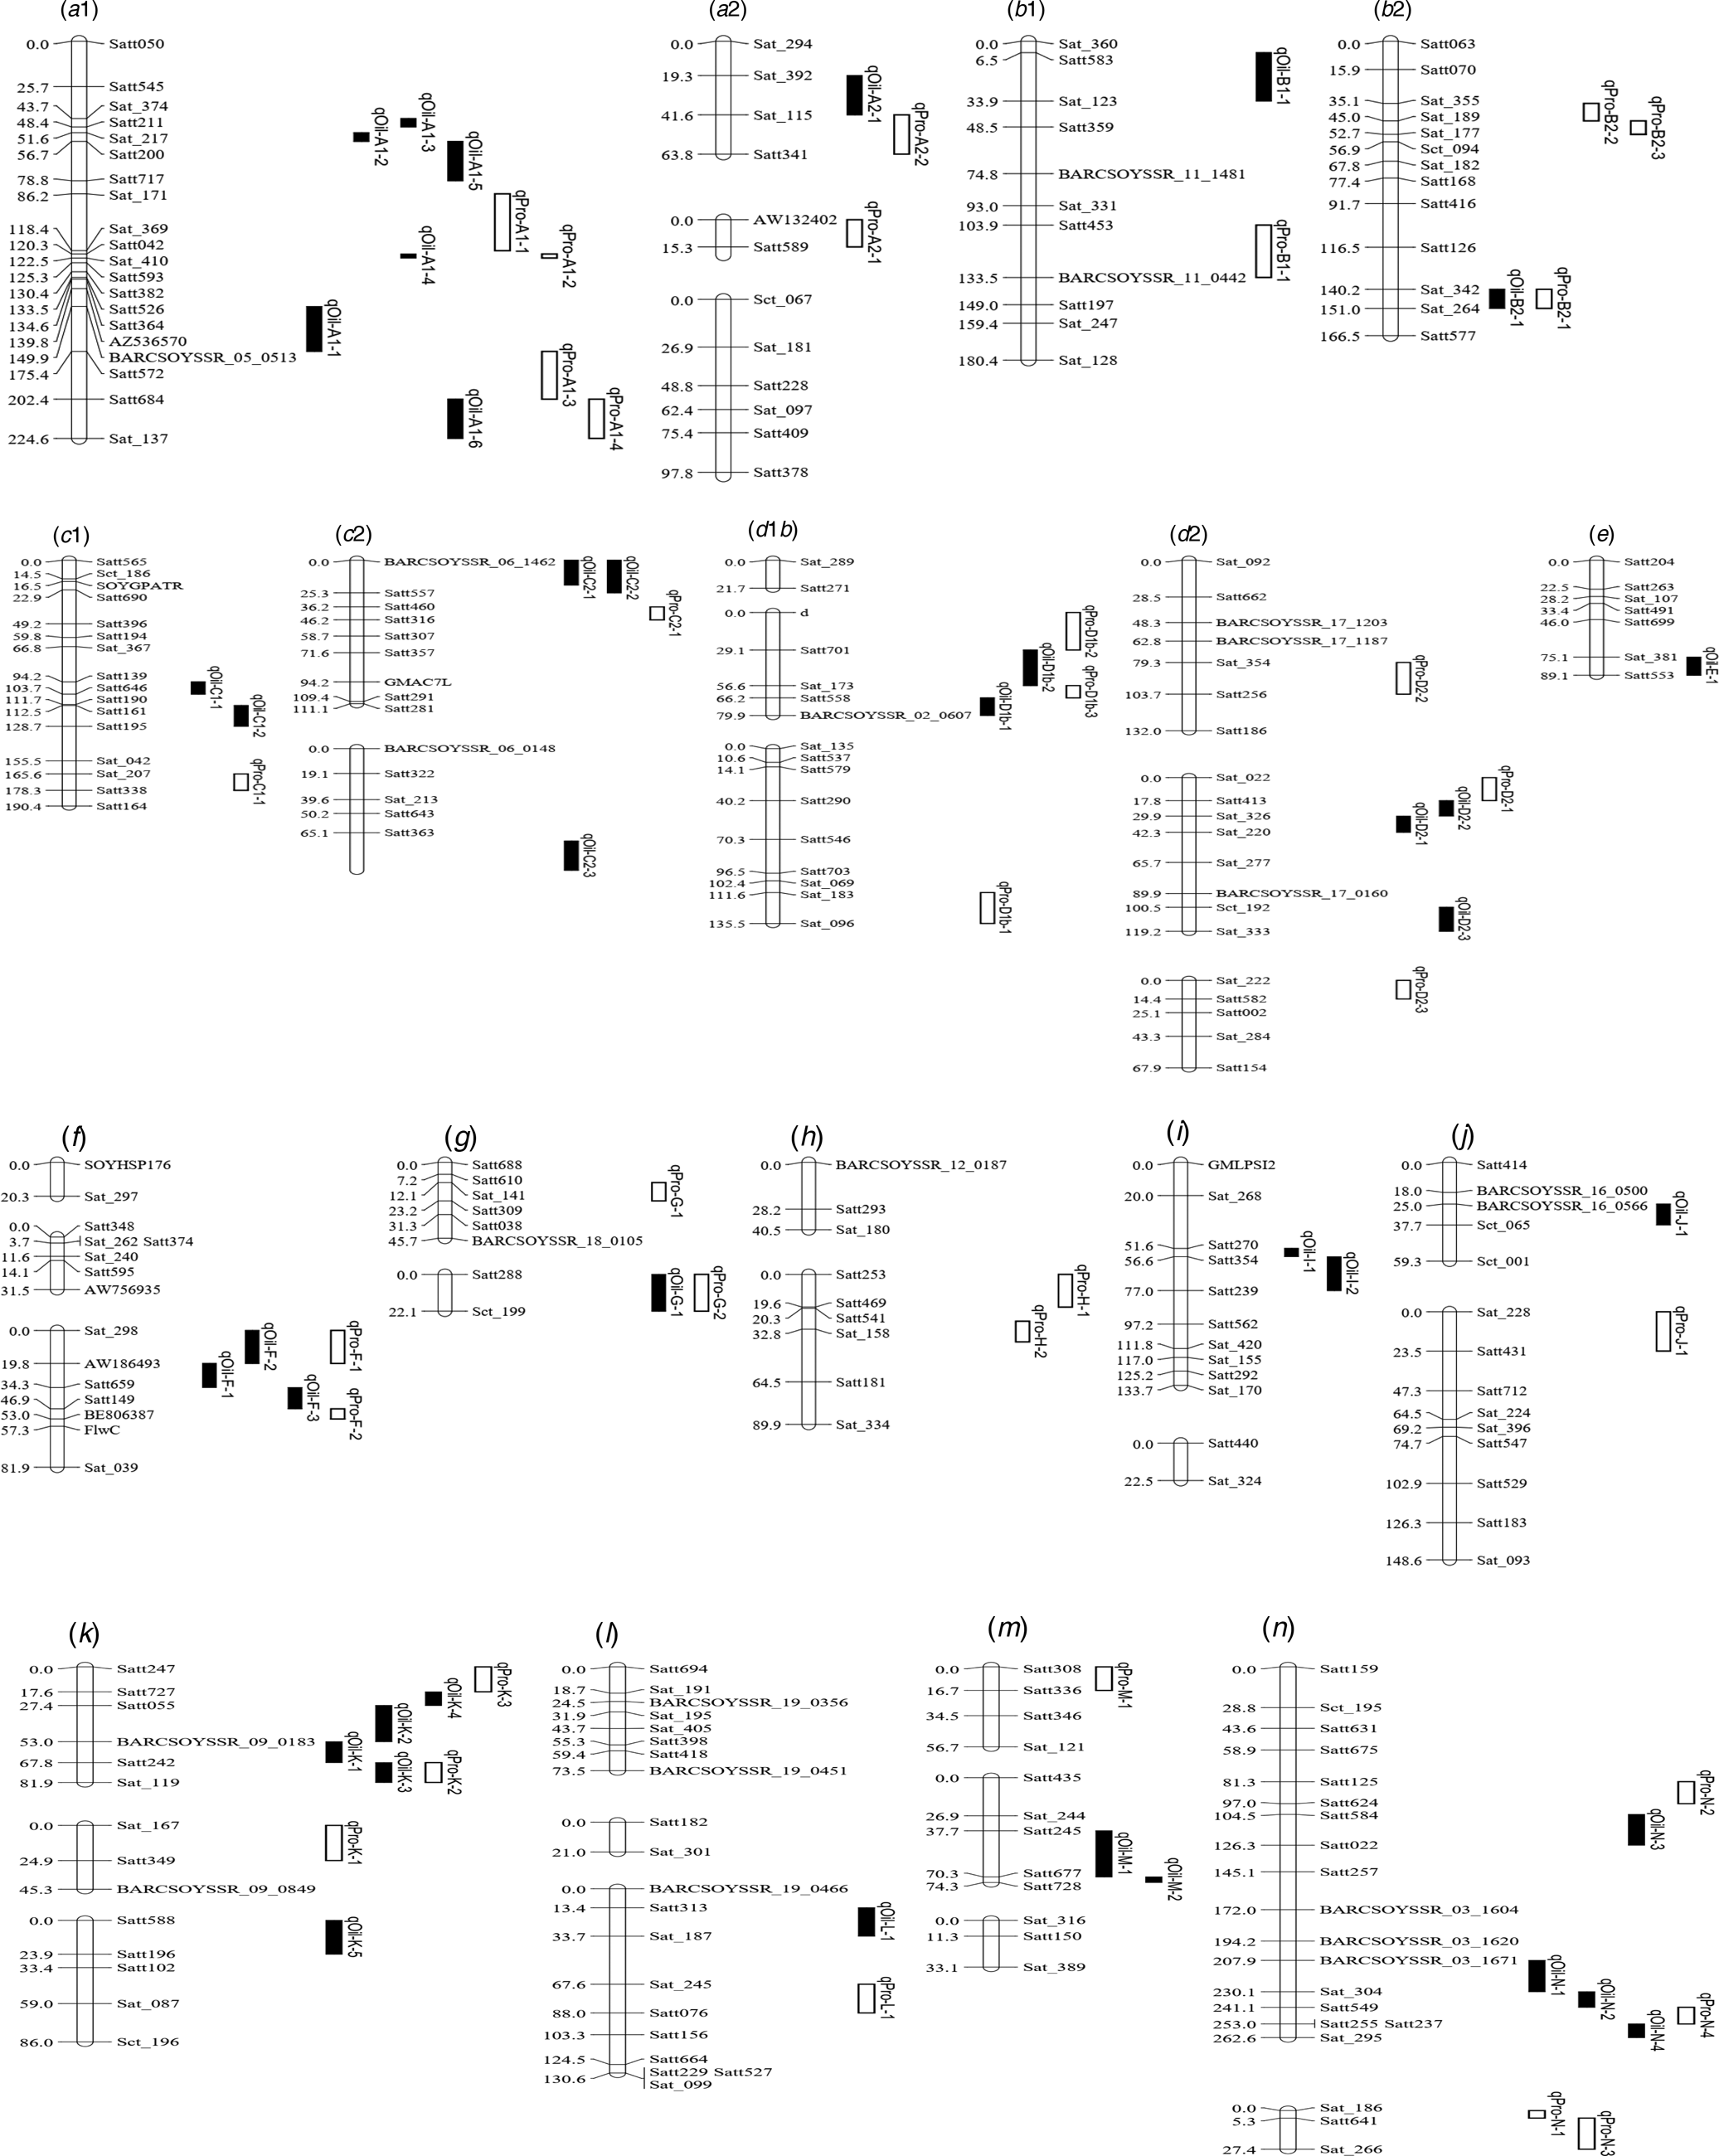
Fig. 2. Integrated linkage map of QTLs for PC and OC detected in the present study based on the positions of markers in the FW-RILs map. These QTL are distributed on left chromosome, and the size of the QTL interval is represented by the length of the QTL. Bars filled with white and black colour represent PC and OC QTL detected in FW-RILs, respectively. The chromosome unit is cM.
Table 3. QTLs underlying PC in soybean detected in eight environments
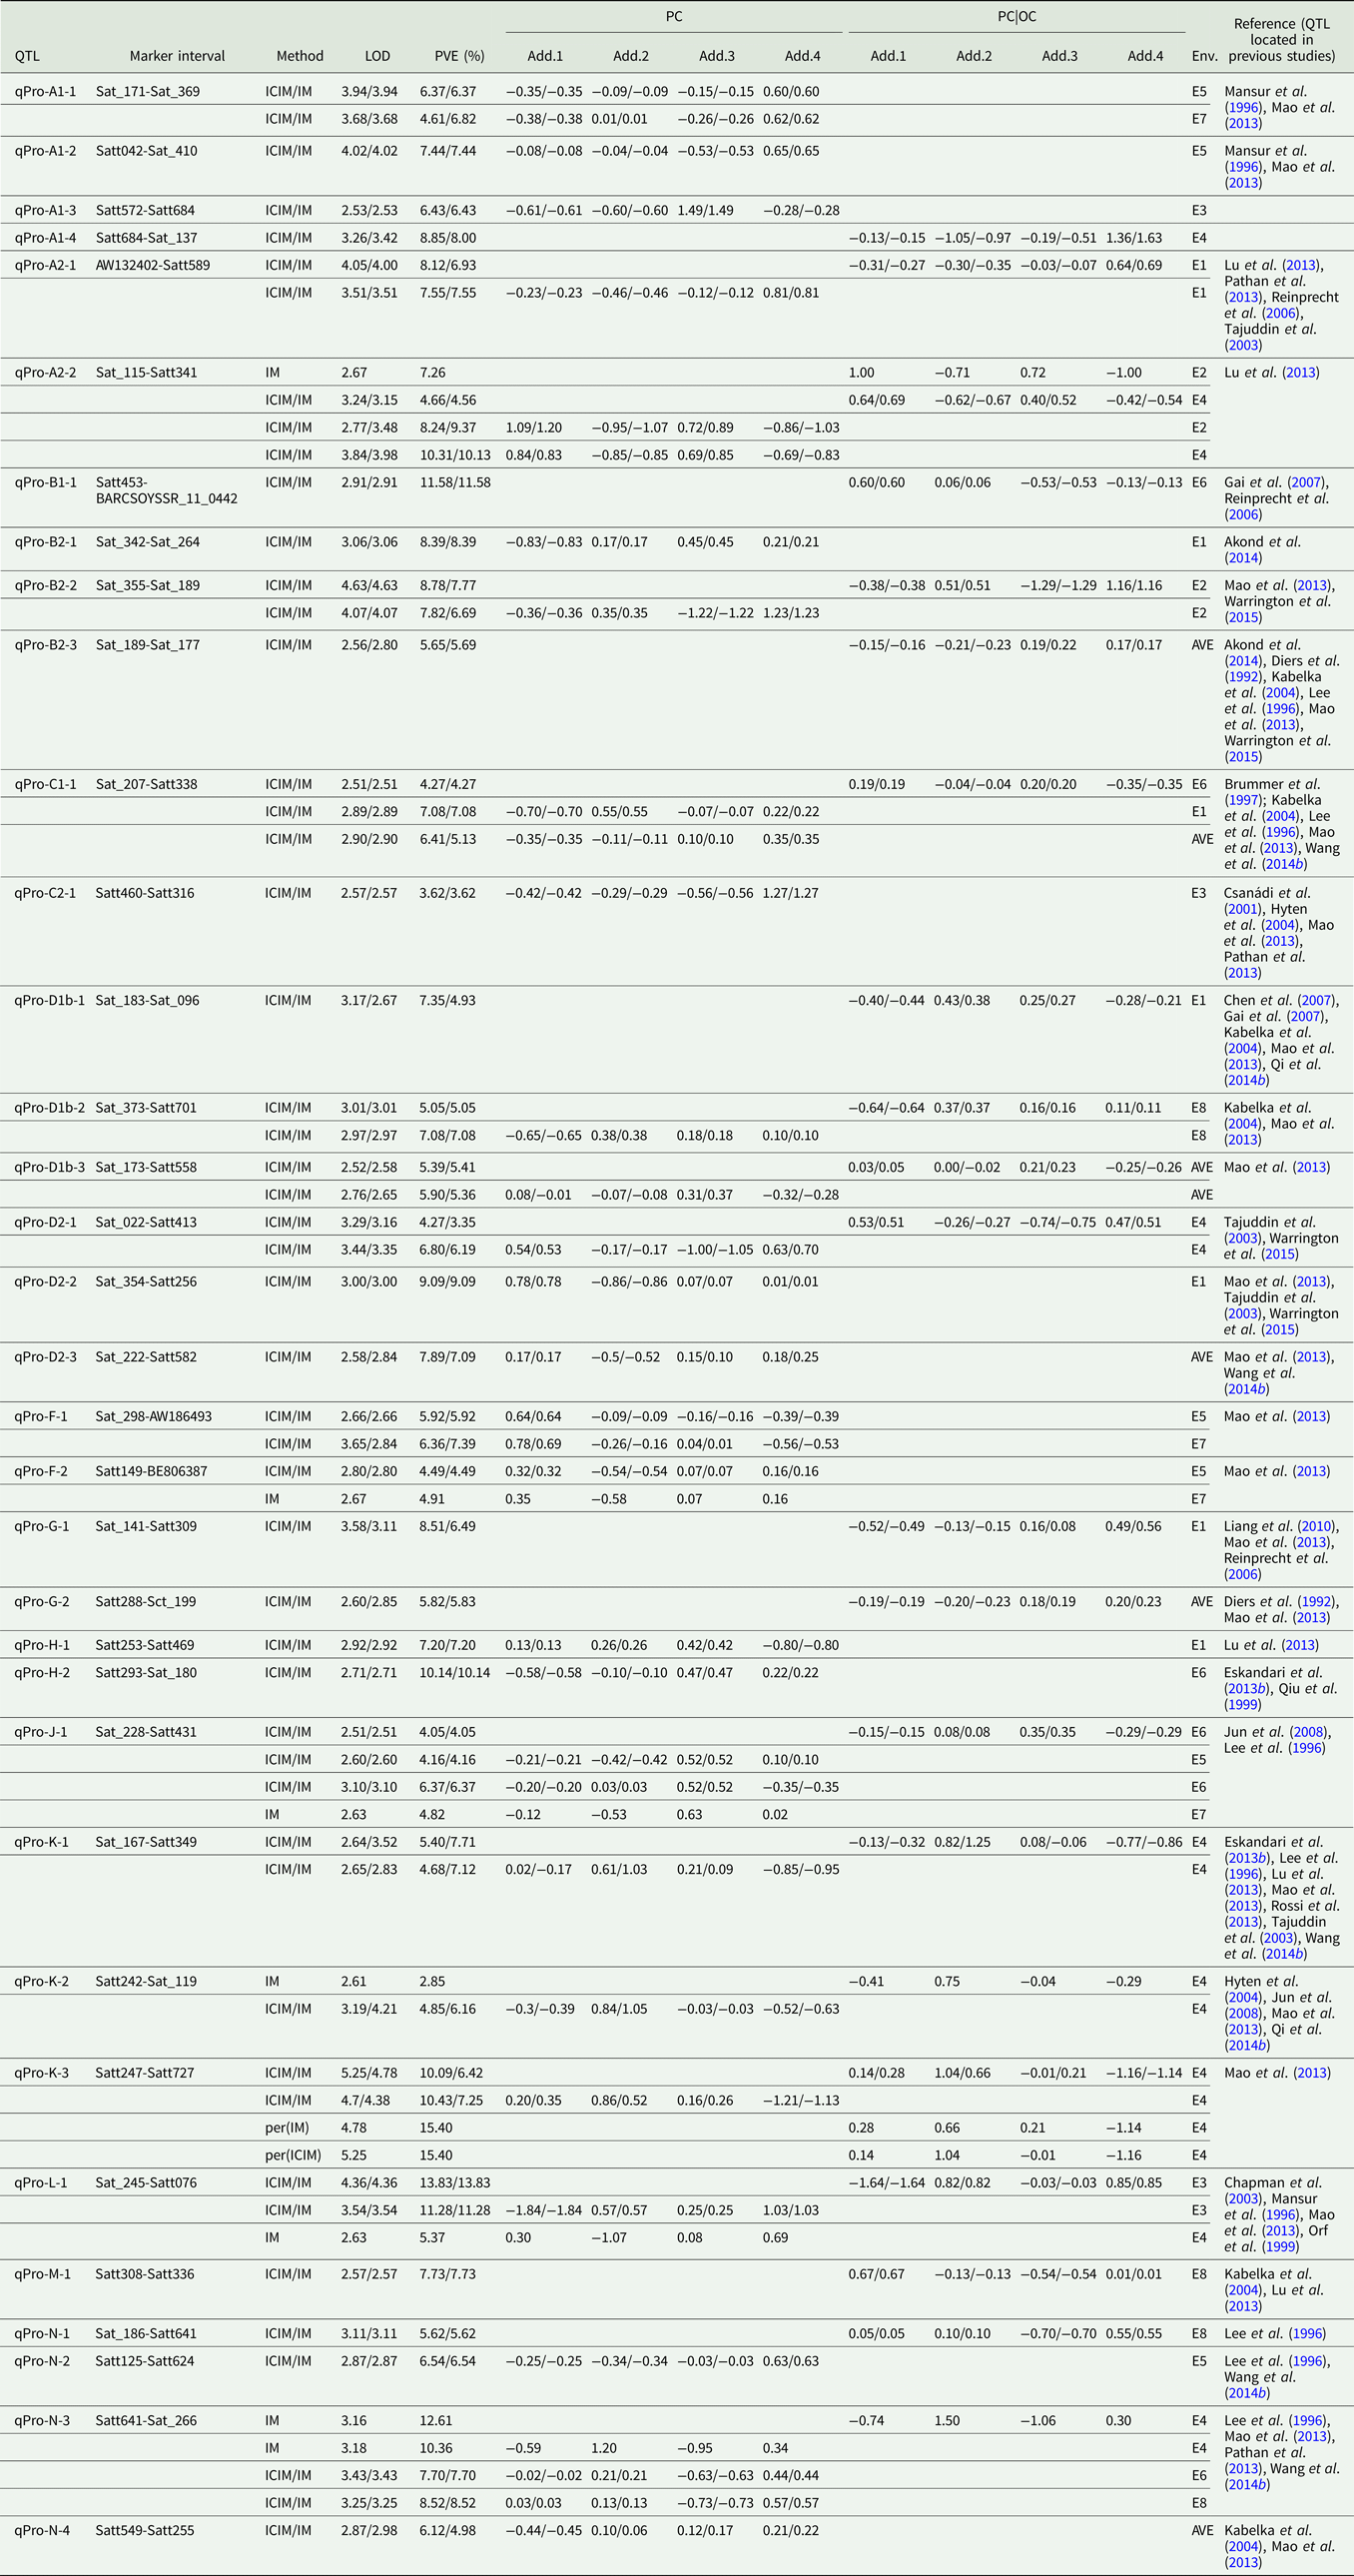
LOD, logarithm of the odds; OC, oil content; PC|OC, protein content effect on oil content, PVE, phenotypic variation explanation ratio; ICIM, inclusive complete interval mapping; IM, interval mapping; per(ICIM), permutations of ICIM; per(IM), permutations of IM; Env., environment, i.e. which environment identified QTL; AVE, mean; E1, Harbin in 2013; E2, Keshan in 2013; E3, the first sowing date in Harbin in 2014; E4, the second sowing date in Harbin in 2014; E5, 2.22 × 10⁵ plants/ha in Harbin; E6, 3.08 × 10⁵ plants/ha in Harbin; E7, 2.58 × 10⁵ plants/ha in Keshan; E8, 3.51 × 10⁵ plants/ha in Keshan; Add.1, the additive effect of Kenfeng14; Add.2, the additive effect of Kenfeng15; Add.3, the additive effect of Heinong48; Add.4, the additive effect of Kenfeng19.
Among all QTLs, the parent Kenfeng14 carried positive additive effect alleles for 11 QTLs, Kenfeng15 carried positive additive effect alleles for 12 QTLs, Heinong48 carried positive additive effect alleles for 16 QTLs and Kenfeng19 carried positive additive effect alleles for 22 QTLs (Table S3). There were 28, 27, 34 and 31 synergistic allelic genotypes with additive effects ranging from 0.02–1.20, 0.01–1.50, 0.01–1.49 and 0.01–1.63 in Kenfeng14, Kenfeng15, Heinong48 and Kenfeng19, respectively, which could increase PC.
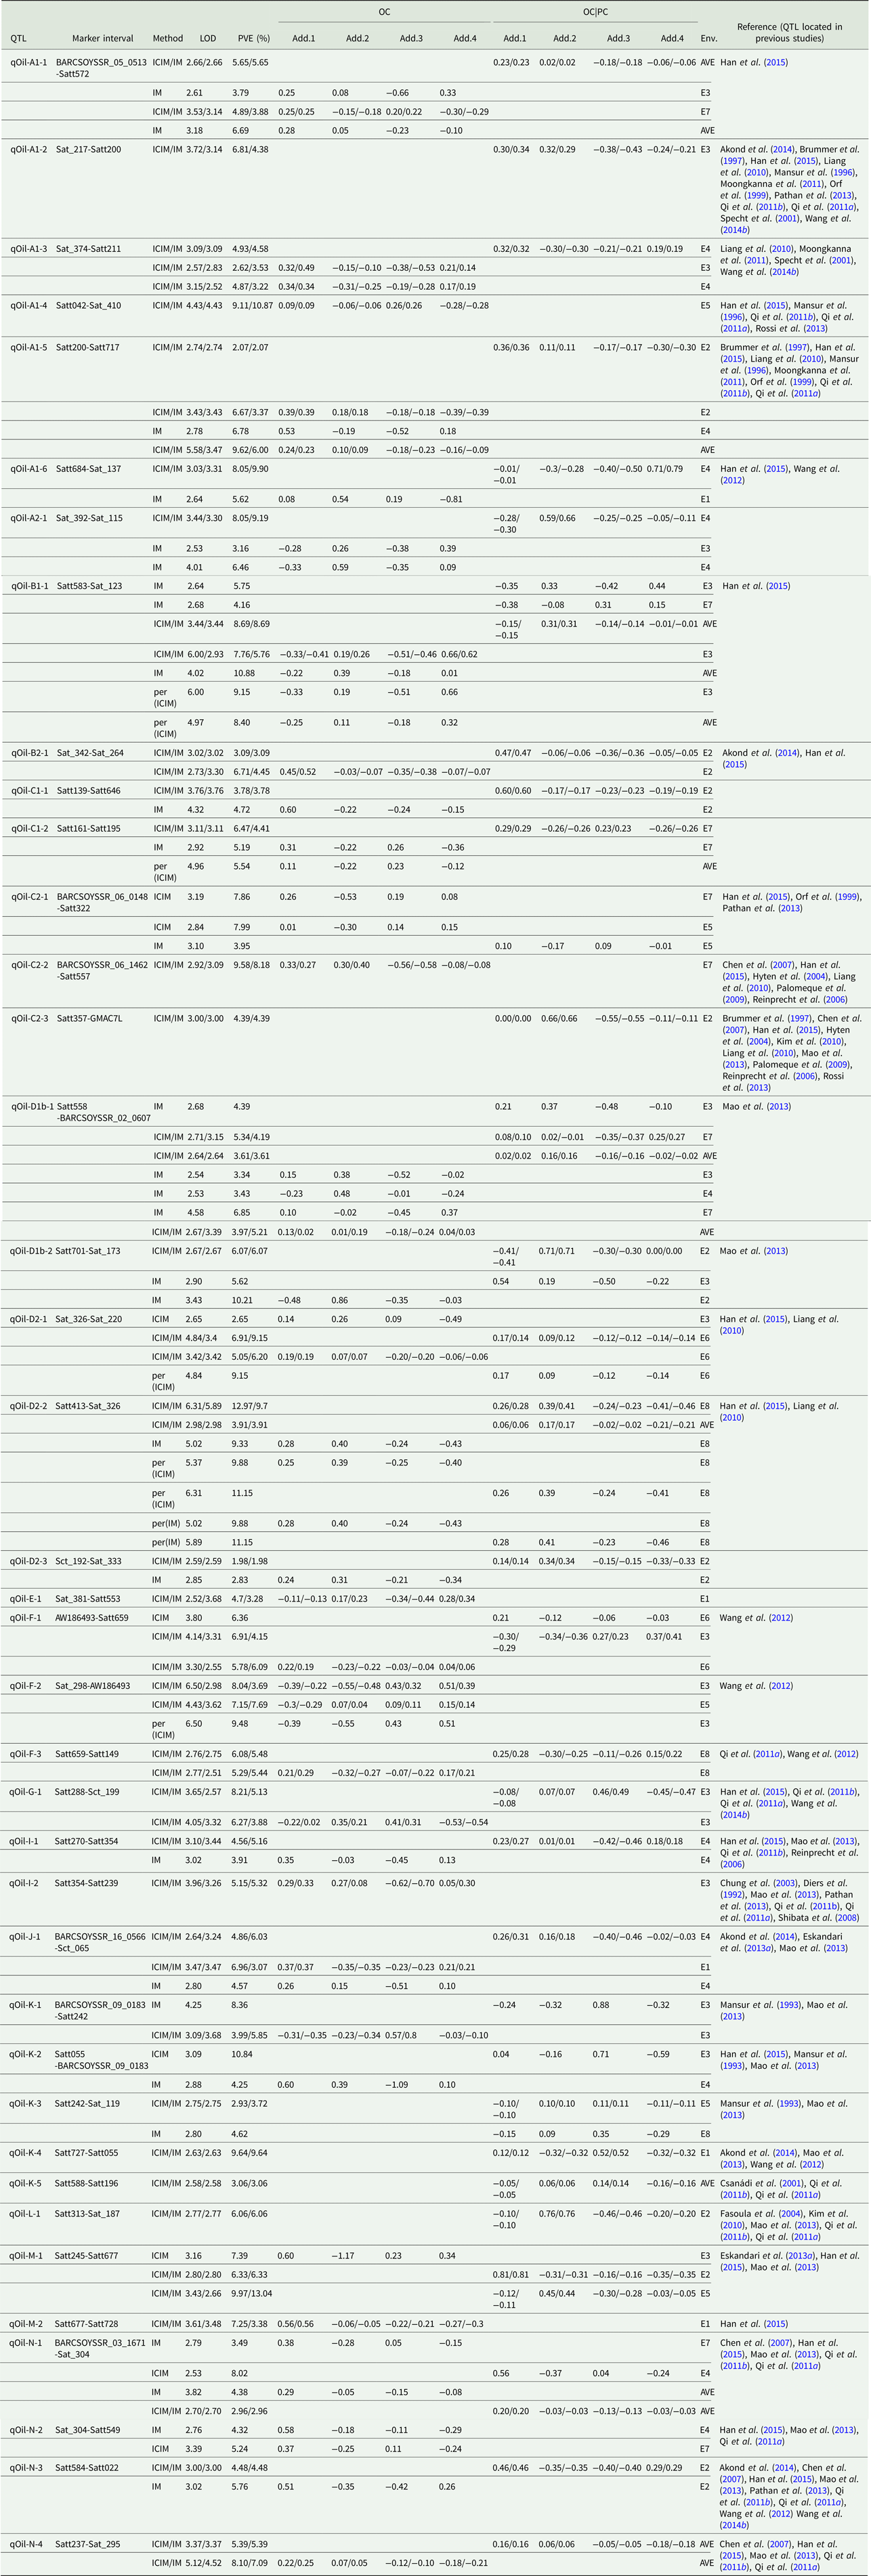
Quantitative trait loci associated with oil content
Among the eight environments, 39 QTLs associated with OC were identified on 17 chromosomes (A1, A2, B1, B2, C1, C2, D1, D2, E, F, G, I, J, K, L, M and N) (Fig. 1, Fig. S1) with a PVE of 1.98–13.04% (Table 4). Among these QTLs, seven (qOil-A1-4, qOil-C2-2, qOil-E-1, qOil-F-2, qOil-I-2, qOil-M-2 and qOil-N-2) were only identified by unconditional variable analysis, indicating that the expression of these QTLs was not affected by OC. Six of the 39 OC QTLs (qOil-A1-2, qOil-C2-3, qOil-K-3, qOil-K-4, qOil-K-5 and qOil-L-1) were only identified by conditional variable analysis, indicating that the expression of these QTLs was completely affected by PC. The 26 remaining QTLs were detected simultaneously by both conditional and unconditional variable analysis, indicating that the expression of these QTLs was partially affected by PC. Comparing PVE and additive effects, ten QTLs (qOil-B2-1, qOil-C1-1, qOil-C1-2, qOil-D2-2, qOil-D2-3, qOil-F-3, qOil-I-1, qOil-J-1, qOil-N-3 and qOil-N-4) were slightly affected by PC, while the 16 remaining QTLs (qOil-A1-1, qOil-A1-3, qOil-A1-5, qOil-A1-6, qOil-A2-1, qOil-B1-1, qOil-C2-1, qOil-D1b-1, qOil-D1b-2, qOil-D2-1, qOil-F-1, qOil-G-1, qOil-K-1, qOil-K-2, qOil-M-1 and qOil-N-1) were partially affected by PC.
Table 4. QTLs underlying OC in soybean detected in eight environments
LOD, logarithm of the odds; OC, oil content; PVE, phenotypic variation explanation ratio and the unit is %. OC|PC, oil content effect on protein content. Env., environment; AVE, mean; E1, Harbin in 2013; E2, Keshan in 2013; E3, the first sowing date in Harbin in 2014; E4, the second sowing date in Harbin in 2014; E5, 2.22 × 10⁵ plants/ha in Harbin; E6, 3.08 × 10⁵ plants/ha in Harbin; E7, 2.58 × 10⁵ plants/ha in Keshan; E8, 3.51 × 10⁵ plants/ha in Keshan. Add.1, the additive effect of Kenfeng14; Add.2, the additive effect of Kenfeng15; Add.3, the additive effect of Heinong48; Add.4, the additive effect of Kenfeng19. ICIM, inclusive complete interval mapping; IM, interval mapping; per(ICIM), permutations of ICIM; per(IM), permutations of IM.
Among these QTLs, the parent Kenfeng14 carried positive additive effect alleles for 24 QTLs, Kenfeng15 carried positive additive effect alleles for 15 QTLs, Heinong48 carried positive additive effect alleles for nine QTLs and Kenfeng19 carried positive additive effect alleles for seven QTLs (Table S3). There were 41, 39, 30 and 35 synergistic allelic genotypes with additive effects ranging from 0.02–1.20, 0.01–1.50, 0.01–1.49 and 0.01–1.63 in Kenfeng14, Kenfeng15, Heinong48 and Kenfeng19, respectively, which could increase OC.
Quantitative trait loci with multiple effects
Six intervals controlled both PC and OC (Table 5). Among the QTLs, three regions (Sat_342-Sat_264, Satt288-Sct_199 and Satt242-Sat_119) affected only one trait in one environment, while the three remaining regions (Satt042-Sat_410, Satt684-Sat_137 and Sat_298-AW186493) controlled two traits in one environment.
Table 5. QTLs with pleiotropic effects
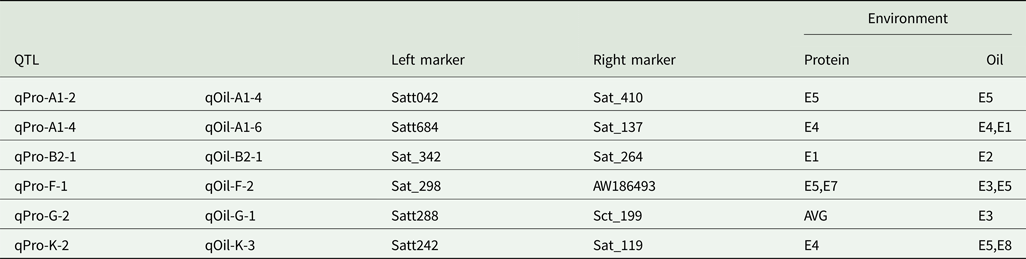
AVE, mean; E1, Harbin in 2013; E2, Keshan in 2013; E3, the first sowing date in Harbin in 2014; E4, the second sowing date in Harbin in 2014; E5, 2.22 × 10⁵ plants/ha in Harbin; E7, 2.58 × 10⁵ plants/ha in Keshan; E8, 3.51 × 10⁵ plants/ha in Keshan.
Perhaps QTLs whose allelic effects were detrimental to both PC and OC could be used to improve a single trait.
Discussion
The use of four-way recombinant inbred lines populations enhances quantitative trait loci detection
QTLs for PC and OC were previously identified using separate populations derived from biparental cross populations (e.g. F2, BC and RIL). In these populations, a single QTL contained only two alleles, its polymorphic information content was low and the mapping results could not be extended to other combinations, resulting in a narrow statistical inference space. Compared to separate populations derived from biparental crosses, the use of FW-RILs populations could increase the statistical inference space and their polymorphic information content is high, thereby increasing the density and coverage of the resulting four-way population linkage map (Ao and Xu, Reference Ao and Xu2006). Therefore, FW-RILs populations could be used to improve QTL detection.
The number of QTLs for PC and OC in soybean previously identified in biparental populations ranged from 2 to 23 (Brummer et al., Reference Brummer, Graef, Orf, Wilcox and Shoemaker1997; Chapman et al., Reference Chapman, Pantalone, Ustun, Allen, Landau-Ellis, Trigiano and Gresshoff2003; Akond et al., Reference Akond, Liu, Boney, Kantartzi, Meksem, Bellaloui, Lightfoot and Kassem2014), whereas many more QTLs can be detected using FW-RILs populations. In the current study, 73 QTLs for PC and OC in soybean were identified. The similar additive effect values between two parents also affected QTL positioning. By contrast, four-way populations contain four parents, allowing QTLs to be detected as long as the allele effects of two parents are different. For example, for qPro-A1-3 (Satt572-Satt684), the additive effects of alleles from the four parents were −0.61, −0.60, 1.49 and −0.28. Since there was little difference in additive effects between the first and second parents, this QTL would not been identified using a biparental population from the Kenfeng14 × Kenfeng15 cross; since the difference in additive effect values between other parents was large, the QTL was identified using four-way populations.
Distinctive and stable quantitative trait loci in various environments
PC and OC are quantitative traits controlled by genotype and the environment. Since these traits are affected by environments and genotypes, the expression of QTLs controlling these traits differs. Comparing to QTLs detected in the single environment, QTL positioning using data from multiple environments increases the detection ability and accuracy of estimating the location and the effect of a QTL. Wang et al. (Reference Wang, Liu, Jiang, Yao, Shen, Ma, Xin, Han, Tao Li, Hu and Chen2014a) identified two stable QTLs based on 3 years of data in three environments. Qi et al. (Reference Qi, Han, Hou, Xin, Wang, Zhu, Hu, Jiang, Li, Liu, Hu and Chen2014a) determined that among the 56 OC QTLs detected in 17 environments, eight were stable in multiple environments. Mao et al. (Reference Mao, Jiang, Han, Teng, Zhao and Li2013) identified 40 PC QTLs, with nine that exist stably in multiple environments, as well as 35 OC QTLs detected simultaneously in eight environments with four that exist stably in over two environments.
For the detection of QTLs expressed in multiple environments, in the current study QTL mapping was conducted in eight environments. Of the 73 QTLs detected, 23 were detected in two environments and four were detected in three environments. The PVE ranged from 2.65 to 13.83% in multiple environments, indicating that QTLs for PC and OC varied in different environments and were affected by non-genetic factors. QTLs located in a single environment have poor environmental stability and are susceptible to non-genetic factors, as a specific QTL might be influenced only by environmental factors.
Advantages of conditional variable analysis of quantitative trait loci
In previous studies, unconditional QTL mapping methods were used to locate QTLs for protein and oil in soybean (Mao et al., Reference Mao, Jiang, Han, Teng, Zhao and Li2013; Eskandari et al., Reference Eskandari, Cober and Rajcan2013a; Wang et al., Reference Wang, Jiang, Green, Scott, Song, Hyten and Cregan2014b). However, this method relies on final phenotypic values being affected by related traits, which would lead to a bias in estimating LOD scores and the additive effects of putative QTLs. The conditional variable method proposed by Zhu (Reference Zhu1995), which is based on a net-effect analysis, makes up for the deficiencies in the unconditional variable method.
The combination of unconditional and conditional variable analysis for mapping QTLs for PC and OC has two advantages. Firstly, conditional variable analysis corrects the bias in estimating genetic effects. The PC of soybean is negatively correlated with OC (Zhang et al., Reference Zhang, Huang, Li, Hu and Dai2004). Therefore, when the variation of the target trait is evaluated, the influence of the related trait on the target traits would lead to a deviation in the calculation of heritability. The conditional variable analysis method analysed the heritability from a single-trait perspective and avoids the effects of interaction between PC and OC. In the current study, the heritability values of PC and OC were determined to be 0.39 and 0.40, respectively, using unconditional variables. After using the conditional variable analysis method, the heritability values of PC and OC were 0.31 and 0.33, respectively.
Secondly, conditional analysis could be used to explore the interaction mechanism of related traits in a FW-RILs population. That is to say, the conditional traits enhance or decrease the allelic additive effect values. In the current study, for qOil-M-1, the absolute additive effect values of the four-way population parental lines were determined to be 0.60, 1.17, 0.23 and 0.34 in the unconditional analysis and 0.12, 0.45, 0.30 and 0.03 in the conditional analysis. Comparing the absolute additive effect values obtained from the two analytical methods, PC decreased the first, second and fourth allelic additive effect values and enhanced the third value.
Conditional variable analysis and strategies for molecular breeding
Conditional variable analysis methods have been used to analyse the molecular genetic relationships of related traits, and the results have been applied to molecular marker-assisted breeding (Zhang et al., Reference Zhang, Chen, Li, Deng, Zhang, Liu and Tian2016). Of the 73 QTLs detected in the current study, only 20 functioned independently, whereas the expression of 53 QTLs was fully or partially affected by related traits. Therefore, when designing molecular breeding strategies, the 20 QTLs that function independently could be used directly to affect the target traits, whereas when using the 53 remaining QTLs, the influence of related traits should be considered.
Comparing the quantitative trait loci identified in the current study with those reported previously
To compare QTLs detected in the present study with previously identified QTLs, the newly identified QTLs were integrated into an available publicly soybean genome map. Of the 73 QTLs examined, 66 partially or completely overlapped with previously reported QTLs and might therefore represent the same QTLs, including 14 QTLs detected only by conditional analysis. Of the seven remaining QTLs, qPro-A1-3, qPro-A1-4 and qOil-A2-1 were only identified by conditional analysis. Among them, qPro-A1-3 and qPro-A1-4 appear to be present in the same locus (Satt684), and qOil-A2-1 is located in region 81.01 cM (Sat_115)–106.29 cM (Sat_392), which is adjacent to two gene regions underlying OC, i.e. 67.33 cM (A111_1)–77.7 cM (Satt341) (Qi et al., Reference Qi, Wu, Han, Sun, Du, Liu, Jiang, Hu and Chen2011b) and 108.83–146.83 cM (Satt327) (Chen et al., Reference Chen, Zhang, Liu, Xin, Qiu, Shan, Shan and Hu2007).
In addition, qOil-C1-1 is localized in region 70.51 cM (Satt646)–74.45 cM and qOil-C1-2 is localized in region 73.38 cM (Satt161)–84.8 cM (Satt161−Satt195), which partially overlap. Two QTLs were previously detected in adjacent regions (61.88–65.08 cM) (Li et al., Reference Li, Zhao, Wang, Yu, Chen, Zhou and Gai2011) and (85.37–120.12 cM) (Han et al., Reference Han, Teng, Wang, Zhao, Wu, Li and Li2015), but whether these two QTLs are identical remains to be confirmed. Moreover, qOil-D2-3 is located in region 5.83 cM (Sct_192)–11.17 cM (Sat_333) and a QTL region near this site, at 24.52 cM (Satt458)–57.07 cM (Satt154), was previously detected (Hyten et al., Reference Hyten, Pantalone, Sams, Saxton, Landau-Ellis, Stefaniak and Schmidt2004). Finally, qOil-E-1 is located in region 64.18 cM (Sat_381)–67.91 cM (Satt553), which is adjacent to two regions underlying OC, i.e. 53.10–57.70 cM (Li et al., Reference Li, Zhao, Wang, Yu, Chen, Zhou and Gai2011) and 84.62–85.15 cM (Mao et al., Reference Mao, Jiang, Han, Teng, Zhao and Li2013), each harbouring a QTL site. These QTLs located by conditional analysis are present in the QTL enrichment region, which verifies the necessity of detecting QTLs using the conditional variable method.
Conclusions
QTLs for PC and OC were identified by both conditional and unconditional variable analysis. Among the 34 protein and 39 oil QTLs identified, 13 only affect PC and seven only affect OC. The eight remaining PC QTLs were completely affected by the oil and six OC QTLs were fully influenced by PC. The 13 PC QTLs and 26 OC QTLs were detected by both unconditional and conditional variable methods. Finally, seven QTLs (qPro-A1-3, qPro-A1-4, qOil-A2-1, qOil-C1-1, qOil-C1-2, qOil-D2-3 and qOil-E-1) were identified for the first time.
Supplementary material
The supplementary material for this article can be found at https://doi.org/10.1017/S0021859620000040.
Financial support
This research was financially supported by the National Key Research and development Program of China (2017YFD0101303) to Wen-Xia Li.
Conflict of interest
None.
Ethical standards
Not applicable.


 Open access