

1. Introduction
Information on individual preferences for reducing health risks is critical for benefit-cost analysis of environmental, health, and transportation policies. However, identifying preferences for reduced health risk is difficult without knowledge of subjective perceptions of risk. For example, if an individual’s marginal willingness to pay (MWTP) to reduce health risk depends on the level of risk she faces, evaluating MWTP at an objective risk measure that differs from her perceived risk would lead to inaccurate inferences about her marginal valuation.Footnote 1 When MWTP to reduce health risk depends on the level of risk, information on perceived risks is central to accurate benefit estimation. Before using subjective risk perceptions to estimate benefits, however, it is important to establish whether they represent valid measures of risk.
This paper examines perceived risks of future heart disease, and the relationship between objective risk factors, subjective risk perceptions, and MWTP to reduce risk. It assesses whether perceived risks provide a valid basis for valuation by examining their construct validity with two questions: (i) Are risk perceptions held before receipt of information plausibly related to objective risk information? (ii) After receiving information, do people update subjective probabilities consistently with Bayesian learning? The paper then presents two ways of using stated preferences to consistently estimate the relationship of MWTP to endogenously perceived risk. Marginal valuations of reductions in perceived and objective risk are compared. The main contributions include assessing the validity of risk perceptions and their updating, consistently estimating the relationship between MWTP and endogenously perceived risk, and demonstrating the importance of risk perception for benefit measurement.
Specifically, five empirical results are obtained. (i) Before receiving information, risk perceptions are qualitatively consistent with current knowledge about heart disease risk and risk factors, and (ii) after receiving information, updates of risk perceptions are broadly consistent with Bayesian learning. These results support the construct validity of perceived heart disease risk. (iii) Substantial heterogeneity in valuation arises from variation in risk perceptions. Estimating MWTP with aggregate objective risk masks this heterogeneity and may confound heterogeneity in preferences and perceptions.Footnote 2 (iv) An illustrative case study shows that using objective risks may understate benefits of reducing heart disease risks by 60–98 %. (v) Information influences valuation, because learning affects perceived risk and MWTP depends on risk.
The case of heart disease, the leading cause of death worldwide (World Health Organization, 2021), is relevant because prior research indicates that MWTP to reduce the risk of the disease depends on the level of risk (Gerking et al., Reference Gerking, Adamowicz, Dickie and Veronesi2017), implying that differences between subjective and objective risk estimates will affect benefit estimates.Footnote 3 Additionally, heart disease risk varies with known risk factors including personal characteristics such as gender and behavioral choices such as smoking. This allows comparing subjective risks held before receipt of information to objective risk estimates by known risk factors, and supports examining updates of subjective probabilities after receipt of information.
The validity of subjective probabilities, their response to information, and their relationship to MWTP remain incompletely resolved despite prior research. Evidence on valuation of health risk comes mainly from studies of objective risks. Research on subjective probabilities demonstrates systematic errors in assessing probability (Kahneman, Reference Kahneman2011), as well as situations when subjective probabilities are similar to objective measures and related to factors that influence probability (e.g., Hurd & McGarry, Reference Hurd and McGarry2002). Several studies find that provision of risk information moves risk perceptions toward the new information (see discussion in Rheinberger and Hammitt, Reference Rheinberger and Hammitt2018), although departures from Bayesian learning may occur with ambiguous or conflicting information (Viscusi & Magat, Reference Viscusi and Magat1992; Viscusi, Reference Viscusi1997).
In a study of climate change rather than health risks, Cameron (Reference Cameron2005) found that responses to information were close to predictions of Bayesian learning for expectations of temperature but not for variances. Studying French consumers’ perceived risks of food-borne illness before and after receiving information, Rheinberger and Hammitt (Reference Rheinberger and Hammitt2018) found that most consumers revised perceptions consistently with Bayesian learning, but 16 % of them responded in unexpected ways. Neither of these studies examined how information or subjective risks influence willingness to pay to reduce risk. Riddel and Shaw (Reference Riddel and Shaw2006) and Riddel (Reference Riddel2011) show that subjective risk and ambiguity affect willingness to accept nuclear waste transport risk, but do not examine how people update subjective risks in response to information.
The rest of this paper is organized around the idea that if marginal valuations of health risk depend on the level of risk, estimates of MWTP will better reflect individual preferences when based on valid measures of perceived risk rather than on measures of objective risk.Footnote 4 Section 2 describes the data. Sections 3 and 4 assess the construct validity of risk perceptions. Section 5 examines how MWTP to reduce risk depends on the level of risk, and compares MWTP estimates based on objective and subjective risk estimates. Section 6 concludes.
2. Data
Data consist of survey responses of 2204 adults drawn from Knowledge Networks, Inc.’s nationally representative online research panel. The panel and the sample used here were recruited by probability sampling methods. Participants were aged 18–55 years that had not previously been diagnosed with heart disease or experienced a heart attack.Footnote 5
The survey consisted of four main sections that (i) elicited initial or prior perceptions of heart disease risks, held before receiving information; (ii) provided information about heart disease risk and collected data on risk factors; (iii) elicited revised or posterior risks, made after receiving information; and (iv) collected data to support estimation of MWTP to reduce risk.
Subjects assessed the risk of contracting coronary artery disease before the age of 75 using an interactive grid containing 100 numbered squares to measure risk as chances in 100. Computerized, self-administered surveys are well suited to eliciting subjective probabilities (Manski, Reference Manski2004), and grids have been used successfully to provide or elicit probabilities in previous studies (Dickie & Gerking, Reference Dickie and Gerking2007; Hammitt & Herrera-Araujo, Reference Hammitt and Herrera-Araujo2018).
After making initial assessments of future heart disease risk, subjects were given both quantitative and qualitative risk information. Risk scales showed the average U.S. resident’s risk (27 chances in 100) as well as quantitative objective risks by gender and by presence/absence of cigarette smoking, diabetes, high blood pressure, high cholesterol, and by body mass index (BMI) in the normal, overweight, and obese range. Qualitative information was provided for three additional risk factors – family history, exercise, and diet.Footnote 6 Data were collected from each respondent on the presence/absence of each risk factor. After reviewing risk information, subjects could use the risk scale to revise their initial assessments. About 47 % of subjects made revisions, on average reducing risk by about 2 chances in 100.Footnote 7
Finally, subjects were told about symptoms and treatment of heart disease and were shown individualized hazard functions indicating how cumulative risk would increase until the age of 75, given their revised risk assessments. They were asked to state purchase intentions for hypothetical vaccines that would reduce risk by a randomly assigned percentage (10 or 70 %) of their revised risk. The vaccines are treated as new private goods that yield no direct utility and provide incremental reductions in heart disease risk.Footnote 8 Respondents were told that risk reductions would occur only with continued annual vaccinations annually through the age of 75. They were shown risk scales showing the absolute risk reduction and the risk remaining if the vaccine was purchased as well as revised hazard functions illustrating the risk reductions in each year through the age of 75. Subjects then were asked whether they would be willing to pay a randomly assigned price ($10, $20, $40, $80, or $160 based on focus groups and pretests) for the first year of vaccination and were reminded of the budget constraint.Footnote 9
3. Comparing subjective and objective estimates of heart disease risk
This section and the next assess the construct validity of subjective risks of heart disease before the age of 75, to establish whether perceived risks provide a sound basis for estimating MWTP to reduce risk. This section compares initial risk assessments, made before receiving information, to clinical and epidemiological evidence about risk, to examine whether subjective risks are reasonably related to available information about heart disease risk and risk factors.
Although subjective risks are measured individually, objective risk estimates are reported as averages with no information on dispersion. To compare the two types of risk estimates, subjective assessments are averaged within groups. The aggregation loses information because the probability of a future health outcome may be influenced by behavioral, genetic, or environmental risk factors unobserved by experts but known to individuals (Hurd, Reference Hurd2009). Furthermore, statistical tests for differences between subjective and objective risk estimates are not feasible due to the lack of information on dispersion in the objective estimates.
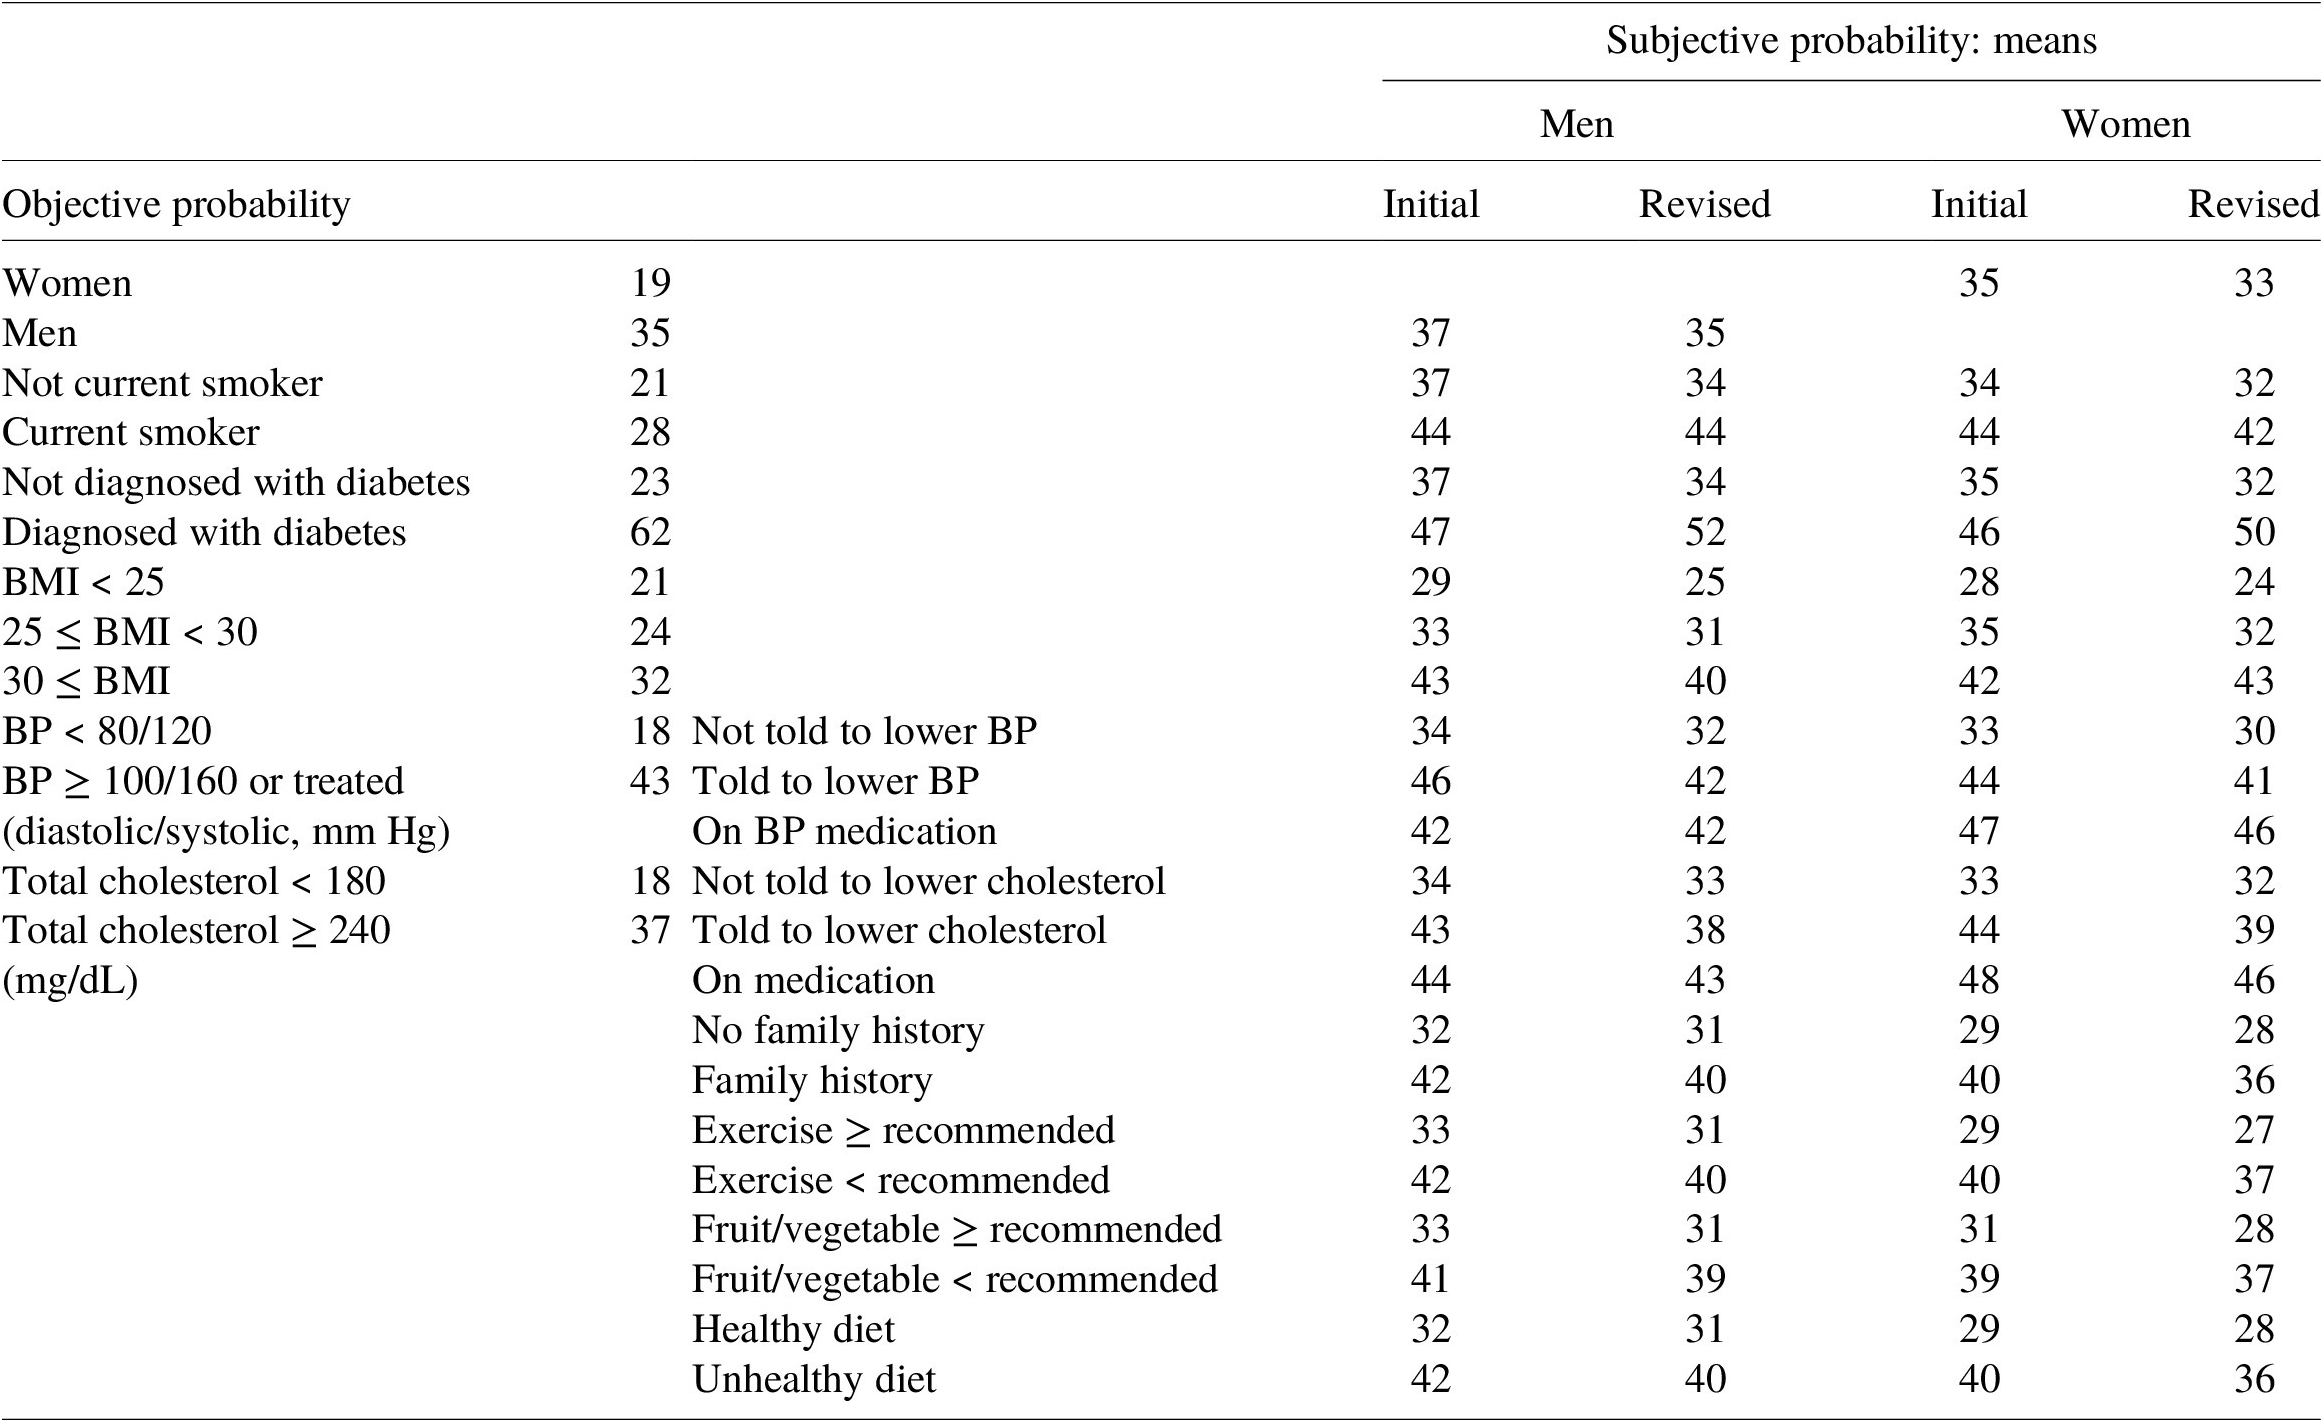
Table 1 presents the means of subjective probabilities of future heart disease along with the objective probability estimates shown to respondents, by risk factor. Means of initial subjective assessments are significantly higher in the presence of each risk factor than in its absence.Footnote 10 Thus, although means of initial risk perceptions exceed objective risks in each risk factor category except diabetes, and the gender difference is far smaller for mean perceived risk than for objective risk, results indicate that qualitative differences in perceived risks between persons with and without each of 10 risk factors match qualitative differences in objective risks. This suggests that people understand the qualitative relationship between heart disease risk and risk factors, and that perceived risks contain individual-specific information not found in an objective risk estimate for the population as a whole.
Table 1. Objective and subjective risk estimates by risk factor (chances in 100).
4. Information and learning about heart disease risk
This section examines the consistency of risk updating with Bayesian learning to evaluate further whether subjective risks provide a valid basis for estimating MWTP to reduce risk.
Comparing means of initial and revised risks by risk factor in Table 1 reveals that respondents on average revised their assessments in the direction of objective risk information, except for men who smoke or take blood pressure medication, and obese women. Additionally, as documented in Appendix A-2 in the Supplementary Material, (i) subjects revised initial risk in the direction of overall population risk (27 in 100) in 41 % of cases; (ii) about one-half (53 %) of subjects did not update initial risk when it differed from 27 in 100, and (iii) 6 % of persons making non-zero revisions updated their assessments in the opposite direction of overall objective risk. Thus, 87 % of non-zero revisions are in the direction of population risk. Rheinberger and Hammitt (Reference Rheinberger and Hammitt2018) found that 66 % of consumers, and 80 % of those making non-zero revisions of prior assessments, updated their beliefs in the direction of information provided about population average risk.Footnote 11
As described in Section 2, subjects were provided more information than just the average risk in the population. The model specified below supports investigating whether the use of each piece of risk information, net of effects of other information provided, is consistent with Bayesian learning. Initially, individual $ i $
believes her risk of heart disease equals
$ i $
believes her risk of heart disease equals $ {R}_{i0},\hskip0.35em 0\hskip0.35em \le \hskip0.35em {R}_{io}\hskip0.35em \le \hskip0.35em 1. $
She then receives
$ {R}_{i0},\hskip0.35em 0\hskip0.35em \le \hskip0.35em {R}_{io}\hskip0.35em \le \hskip0.35em 1. $
She then receives $ J $
estimates of objective risk, denoted by
$ J $
estimates of objective risk, denoted by $ {S}_j,\hskip0.35em j\hskip0.35em =\hskip0.35em 1,\dots, J, $
and updates her prior probability beliefs according to the Bayesian updating rule
$ {S}_j,\hskip0.35em j\hskip0.35em =\hskip0.35em 1,\dots, J, $
and updates her prior probability beliefs according to the Bayesian updating rule
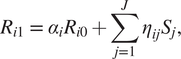 $$ {R}_{i1}\hskip0.35em =\hskip0.35em {\alpha}_i{R}_{i0}+\sum \limits_{j=1}^J{\eta}_{ij}{S}_j,\hskip1em $$
where R
i1
denotes the revised or posterior risk belief. In Equation (1), the $ {\alpha}_i $
and
$ {\alpha}_i $
and $ {\eta}_{ij} $
parameters, respectively, denote the relative precision or information content of the prior and the
$ {\eta}_{ij} $
parameters, respectively, denote the relative precision or information content of the prior and the $ j\mathrm{th} $
risk estimate. The relative precision parameters lie between zero and one and sum to unity:
$ j\mathrm{th} $
risk estimate. The relative precision parameters lie between zero and one and sum to unity: $ 0\hskip0.35em \le \hskip0.35em {\alpha}_i\hskip0.35em \le \hskip0.35em 1,\hskip0.35em 0\hskip0.35em \le \hskip0.35em {\eta}_{ij}\hskip0.35em \le \hskip0.35em 1,j\hskip0.35em =\hskip0.35em 1,\dots, J, $
and
$ 0\hskip0.35em \le \hskip0.35em {\alpha}_i\hskip0.35em \le \hskip0.35em 1,\hskip0.35em 0\hskip0.35em \le \hskip0.35em {\eta}_{ij}\hskip0.35em \le \hskip0.35em 1,j\hskip0.35em =\hskip0.35em 1,\dots, J, $
and $ {\alpha}_i+\sum \limits_{j=1}^J{\eta}_{ij}=1. $
It is convenient to use the latter constraint to rewrite the updating rule as Equation (2).
$ {\alpha}_i+\sum \limits_{j=1}^J{\eta}_{ij}=1. $
It is convenient to use the latter constraint to rewrite the updating rule as Equation (2).
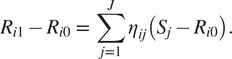 $$ {R}_{i1}-{R}_{i0}\hskip0.35em =\hskip0.35em \sum \limits_{j=1}^J{\eta}_{ij}\left({S}_j-{R}_{i0}\right). $$
According to Equation (2), the individual updates risk by comparing each new risk estimate to her prior belief and weighting the difference by the relative precision of the new information. Positive values for the $ {\eta}_{ij} $
that are less than unity imply that perceived risk adjusts to each piece of information by moving toward, but not beyond, the new risk estimate. Negative values for any
$ {\eta}_{ij} $
that are less than unity imply that perceived risk adjusts to each piece of information by moving toward, but not beyond, the new risk estimate. Negative values for any $ {\eta}_{ij} $
or values in excess of unity would be inconsistent with Bayesian learning.Footnote
12 Figure 1 shows the revision in perceived risk (left-hand side of Equation (2)) is quite heterogeneous but on average diminishes as prior risk perception increases.
$ {\eta}_{ij} $
or values in excess of unity would be inconsistent with Bayesian learning.Footnote
12 Figure 1 shows the revision in perceived risk (left-hand side of Equation (2)) is quite heterogeneous but on average diminishes as prior risk perception increases.
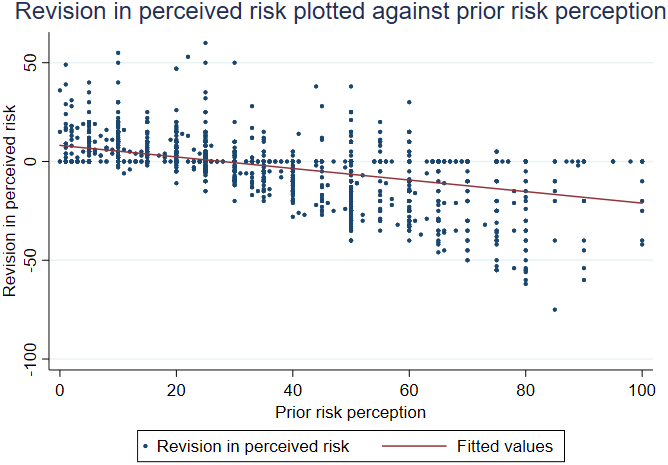
Figure 1. Scatter plot and line fit of revision in risk perception against prior risk perception.
Before presenting estimates of Equation (2), there are two issues to address concerning its specification. First, the weight given to new information may reflect its applicability to the individual as well as its information content (Viscusi, Reference Viscusi1989). To account for individual relevance of information, assume that a person uses only the information that corresponds to his/her risk factors when updating prior risks. For example, assume women use the objective risk of females but not the objective risk of males when updating; men do the reverse.Footnote
13 Thus, if $ {S}_j,\hskip0.35em j\hskip0.35em =\hskip0.35em 1,\dots, 4 $
, denote objective risk estimates for females, males, non-smokers, and smokers, then the first four terms on the right-hand side of Equation (2) are shown in Equation (3).
$ {S}_j,\hskip0.35em j\hskip0.35em =\hskip0.35em 1,\dots, 4 $
, denote objective risk estimates for females, males, non-smokers, and smokers, then the first four terms on the right-hand side of Equation (2) are shown in Equation (3).
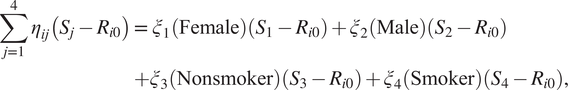 $$ {\displaystyle \begin{array}{c}\sum \limits_{j=1}^4{\eta}_{ij}\left({S}_j-{R}_{i0}\right)=\hskip0.35em {\xi}_1\left(\mathrm{Female}\right)\left({S}_1-{R}_{i0}\right)+{\xi}_2\left(\mathrm{Male}\right)\left({S}_2-{R}_{i0}\right)\\ {}+{\xi}_3\left(\mathrm{Nonsmoker}\right)\left({S}_3-{R}_{i0}\right)+{\xi}_4\left(\mathrm{Smoker}\right)\left({S}_4-{R}_{i0}\right),\end{array}} $$
where Female, Male, Nonsmoker, and Smoker denote (0,1) indicators for gender and smoking status, and $ {\xi}_j $
reflect the relative precision of the corresponding objective risk estimates.Footnote
14
$ {\xi}_j $
reflect the relative precision of the corresponding objective risk estimates.Footnote
14
Second, information gap variables for risk factors for which objective risk estimates were available (gender, smoking, diabetes, BMI, blood pressure, and cholesterol) were constructed as differences between the objective risk estimate provided in the survey (shown in Table 1) and the prior assessment of risk. Information gap variables for risk factors for which only qualitative risk information was available (family history, exercise, fruit/vegetable consumption, and healthiness of diet) were constructed so that their weights are expected to be positive.Footnote 15
Table 2 presents least-squares estimates of the Bayesian updating equation [Equation (2)]. Column 2 presents estimates for the full sample because excluding observations with zero updates would cause an overestimation of absolute magnitudes of information weights. Owing to the large proportion of zero revisions, however, column 3 estimates exclude observations with zero revisions.Footnote 16 With few exceptions, estimated coefficients take the same signs and are absolutely larger when respondents making zero revision are excluded.Footnote 17
Table 2. Updates of prior risk assessments: estimates of Equation (2).
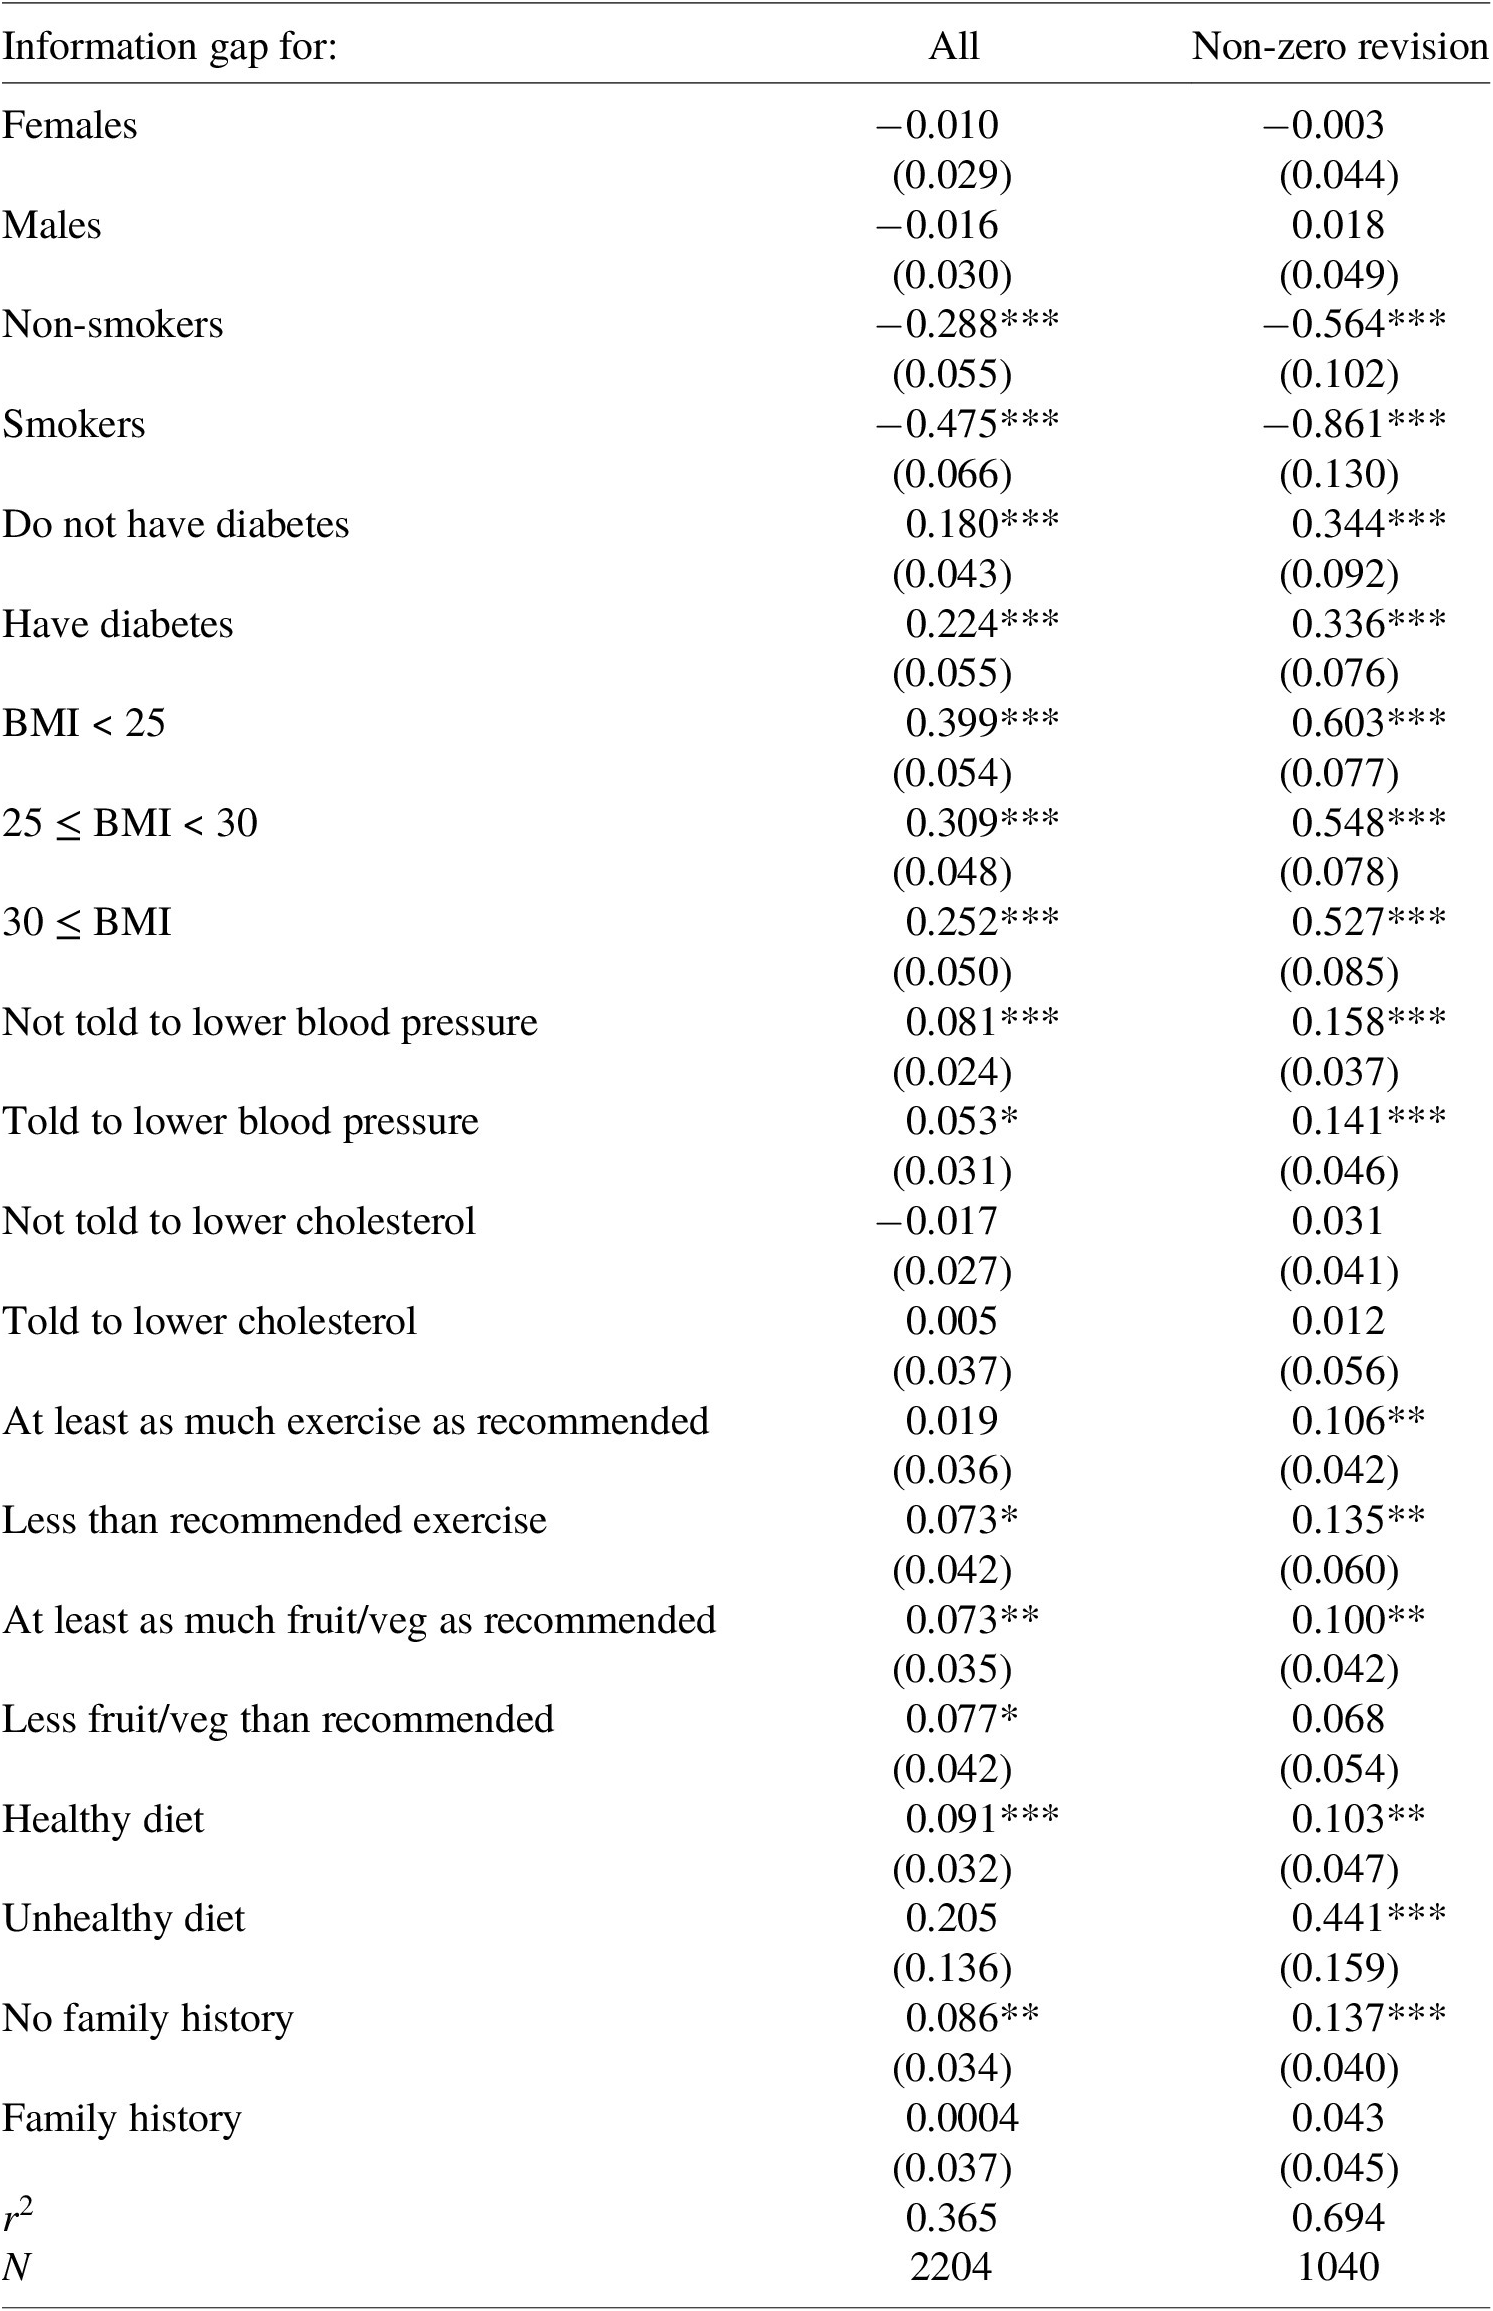
Note: ***, **, and * denote significance at the 1, 5, and 10 % levels, respectively. Heteroscedasticity-consistent standard errors are presented in parenthesis. The r2 equals the squared correlation between fitted and observed dependent variables. There is no constant term in the model.
Slope coefficients in Table 2 are interpreted as weights applied to objective risk information when updating priors and indicate the number of chances in 100 by which subjects increased their risk assessments per 1-chance-in-100 increase in each information gap variable. Bayesian updating predicts that each weight lies between zero and one.
No estimated weight is greater than one; the largest in the full sample is 0.399 and is significantly less than unity at the 1 % level. Estimated weights on objective risk information for smoking are significantly less than zero.Footnote
18 The remaining weights are consistent with Bayesian learning.Footnote
19 The estimated sum of weights on new information, $ \sum \limits_{j=1}^J{\eta}_{ij}, $
was computed at the means of risk factors and the implied weight on the prior was recovered as this sum subtracted from unity. For the full sample, the sum of information weights is 0.504 (s.e. = 0.039), implying a weight on the prior of 0.496.Footnote
20
$ \sum \limits_{j=1}^J{\eta}_{ij}, $
was computed at the means of risk factors and the implied weight on the prior was recovered as this sum subtracted from unity. For the full sample, the sum of information weights is 0.504 (s.e. = 0.039), implying a weight on the prior of 0.496.Footnote
20
5. Risk perception, information, and MWTP to reduce risks
Results in Sections 3 and 4 suggest that subjective assessments of future heart disease risks meet important standards of construct validity and provide a valid alternative to objective risk estimates for inferring MWTP to reduce risk.
Empirical analysis of MWTP to reduce risks of future heart disease is divided into four subsections. Section 5.1 discusses the consistent estimation of MWTP to reduce endogenous subjective risk. Section 5.2 demonstrates empirically that MWTP to reduce future heart disease risk depends on the risk level, implying that estimated valuations will more accurately reflect individual preferences when based on valid measures of perceived rather than objective risk. Section 5.3 compares MWTP estimates computed from objective and subjective risk estimates and illustrates the heterogeneity in MWTP that arises from variation in individual risk perceptions. This heterogeneity is lost when MWTP is estimated using aggregate objective risks. The subsection also examines how learning affects marginal valuations. Section 5.4 provides a policy example showing how estimated national benefits of heart disease risk reductions might differ depending on the use of objective or subjective risk estimates.
5.1 Consistent estimation with endogenous subjective risks
Estimates of MWTP to reduce future heart disease risk are derived from probit estimates of three functional forms of an equation describing purchase intentions for the vaccine.Footnote 21 (The underlying theoretical model is similar to models used by Gerking et al. (Reference Gerking, Adamowicz, Dickie and Veronesi2017) and Liu and Neilson (Reference Liu and Neilson2006) and is presented in Appendix A-3 in the Supplementary Material.) The first functional form treats willingness to pay for the vaccine as a function of the percentage reduction in heart disease risk the vaccine provides. Covariates measure risk reduction in percentage points and vaccine price in dollars per year. Randomization of percentage risk reductions and vaccine prices suggests that these covariates are distributed independently of the disturbance in the model and supports consistent estimation of MWTP to reduce risk by one percentage point (Gerking et al., Reference Gerking, Adamowicz, Dickie and Veronesi2017).Footnote 22 Since estimated MWTP for a proportional risk reduction is constant, MWTP to reduce risk by 1 chance in 100 – obtained by dividing estimated MWTP for a percentage risk reduction by the posterior perception of risk – graphs as a rectangular hyperbola in posterior risk level.
The second functional form treats MWTP to reduce future heart disease risk by 1 chance in 100 as constant, whereas the third treats the MWTP as a linear function of posterior risk. Willingness to pay for the vaccine is described by $ {W}_i\hskip0.35em =\hskip0.35em {\gamma}_A{\Delta}_i{R}_{1i}+{\gamma}_{AR}{\Delta}_i{R}_{1i}^2+{\gamma}_R{R}_{1i}+{v}_i, $
where
$ {W}_i\hskip0.35em =\hskip0.35em {\gamma}_A{\Delta}_i{R}_{1i}+{\gamma}_{AR}{\Delta}_i{R}_{1i}^2+{\gamma}_R{R}_{1i}+{v}_i, $
where $ {W}_i $
denotes the true willingness to pay of individual i for the vaccine,
$ {W}_i $
denotes the true willingness to pay of individual i for the vaccine, $ {\Delta}_i $
denotes the experimentally assigned proportionate reduction in risk, and
$ {\Delta}_i $
denotes the experimentally assigned proportionate reduction in risk, and $ {R}_{1i} $
denotes the posterior risk perception. Thus,
$ {R}_{1i} $
denotes the posterior risk perception. Thus, $ {\Delta}_i{R}_{1i} $
measures absolute risk reduction in chances in 100, and
$ {\Delta}_i{R}_{1i} $
measures absolute risk reduction in chances in 100, and $ {\Delta}_i{R}_{1i}^2 $
measures absolute risk reduction interacted with posterior risk. Annual MWTP to reduce heart disease risk by 1 chance in 100 equals
$ {\Delta}_i{R}_{1i}^2 $
measures absolute risk reduction interacted with posterior risk. Annual MWTP to reduce heart disease risk by 1 chance in 100 equals $ \partial {W}_i/\partial \left({\Delta}_i{R}_{1i}\right)\hskip0.35em =\hskip0.35em {\gamma}_A+{\gamma}_{AR}{R}_{1i}. $
A constant MWTP to reduce risk is obtained by restricting
$ \partial {W}_i/\partial \left({\Delta}_i{R}_{1i}\right)\hskip0.35em =\hskip0.35em {\gamma}_A+{\gamma}_{AR}{R}_{1i}. $
A constant MWTP to reduce risk is obtained by restricting $ {\gamma}_{AR}\hskip0.35em =\hskip0.35em 0. $
Finally, the disturbance
$ {\gamma}_{AR}\hskip0.35em =\hskip0.35em 0. $
Finally, the disturbance $ {\nu}_i $
summarizes tastes for risk reduction as well as other opportunities to reduce risk. It is expected to be correlated with posterior risk.
$ {\nu}_i $
summarizes tastes for risk reduction as well as other opportunities to reduce risk. It is expected to be correlated with posterior risk.
The discrepancy between true ( $ {W}_i $
) and stated (
$ {W}_i $
) and stated ( $ {W}_i^{\ast } $
) willingness to pay for the vaccine is modeled as a person-specific random effect with a non-zero mean
$ {W}_i^{\ast } $
) willingness to pay for the vaccine is modeled as a person-specific random effect with a non-zero mean $ \left({\gamma}_0\right) $
:
$ \left({\gamma}_0\right) $
: $ {W}_i^{\ast}\hskip0.35em =\hskip0.35em {\gamma}_0+{W}_i+{\omega}_i $ $ \hskip0.35em =\hskip0.35em {\gamma}_0+{\gamma}_A{\Delta}_i{R}_{1i}+{\gamma}_{AR}{\Delta}_i{R}_{1i}^2+{\gamma}_R{R}_{1i}+{v}_i+{\omega}_i. $
The constant
$ \hskip0.35em =\hskip0.35em {\gamma}_0+{\gamma}_A{\Delta}_i{R}_{1i}+{\gamma}_{AR}{\Delta}_i{R}_{1i}^2+{\gamma}_R{R}_{1i}+{v}_i+{\omega}_i. $
The constant $ {\gamma}_0 $
reflects systematic tendencies to misstate true willingness to pay. The disturbance
$ {\gamma}_0 $
reflects systematic tendencies to misstate true willingness to pay. The disturbance $ {\omega}_i\hskip0.35em =\hskip0.35em {\sigma \varepsilon}_i $
reflects influences of individual characteristics and unobserved heterogeneity in determining differences between stated and true willingness to pay for the vaccine. It is assumed to be normally distributed with zero mean and variance
$ {\omega}_i\hskip0.35em =\hskip0.35em {\sigma \varepsilon}_i $
reflects influences of individual characteristics and unobserved heterogeneity in determining differences between stated and true willingness to pay for the vaccine. It is assumed to be normally distributed with zero mean and variance $ {\sigma}^2, $
independently of
$ {\sigma}^2, $
independently of $ {v}_i $
and
$ {v}_i $
and $ {R}_{1i}. $
Subtracting the experimentally assigned vaccine price
$ {R}_{1i}. $
Subtracting the experimentally assigned vaccine price $ \left({P}_i\right) $
from both sides of the equation and dividing through by
$ \left({P}_i\right) $
from both sides of the equation and dividing through by $ \sigma $
yields Equation (4).
$ \sigma $
yields Equation (4).
 $$ \left({W}_i^{\ast }-{P}_i\right)/\sigma \hskip0.35em =\hskip0.35em {\gamma}_0^{\ast }+{\gamma}_A^{\ast }{\Delta}_i{R}_{1i}+{\gamma}_{AR}^{\ast }{\Delta}_i{R}_{1i}^2+{\gamma}_R^{\ast }{R}_{1i}+{\gamma}_P^{\ast }{P}_i+{\nu}_i^{\ast }+{\varepsilon}_i, $$
where $ {\gamma}_j^{\ast}\hskip0.35em =\hskip0.35em {\gamma}_j/\sigma, \hskip0.35em j\hskip0.35em =\hskip0.35em 0,\hskip0.35em A,\hskip0.35em AR,\hskip0.35em R,\hskip0.35em {\gamma}_P^{\ast}\hskip0.35em =\hskip0.35em -1/\sigma, $ $ {\nu}_i^{\ast}\hskip0.35em =\hskip0.35em {\nu}_i/\sigma, $
and
$ {\nu}_i^{\ast}\hskip0.35em =\hskip0.35em {\nu}_i/\sigma, $
and $ {\varepsilon}_i $
has mean zero and variance of unity. The parameters of interest in Equation (4) are
$ {\varepsilon}_i $
has mean zero and variance of unity. The parameters of interest in Equation (4) are $ {\gamma}_A^{\ast },{\gamma}_{AR}^{\ast }, $
and
$ {\gamma}_A^{\ast },{\gamma}_{AR}^{\ast }, $
and $ {\gamma}_P^{\ast }, $
because MWTP to reduce risk by 1 chance in 100 equals
$ {\gamma}_P^{\ast }, $
because MWTP to reduce risk by 1 chance in 100 equals $ -\left({\gamma}_A^{\ast }+{\gamma}_{AR}^{\ast }{R}_{1i}\right)/{\gamma}_P^{\ast } $
.
$ -\left({\gamma}_A^{\ast }+{\gamma}_{AR}^{\ast }{R}_{1i}\right)/{\gamma}_P^{\ast } $
.
The probit estimator of parameters of Equation (4) is not expected to be consistent because of the correlation between posterior risk and the disturbance $ {\nu}_i^{\ast } $
. Appendix A-5 in the Supplementary Material demonstrates, however, that if the distribution of
$ {\nu}_i^{\ast } $
. Appendix A-5 in the Supplementary Material demonstrates, however, that if the distribution of $ {v}_i^{\ast } $
conditional on posterior risk is normal, with mean linear in posterior risk and positive variance, then probit estimators of
$ {v}_i^{\ast } $
conditional on posterior risk is normal, with mean linear in posterior risk and positive variance, then probit estimators of $ {\gamma}_A^{\ast },\hskip0.35em {\gamma}_{AR}^{\ast }, $
and
$ {\gamma}_A^{\ast },\hskip0.35em {\gamma}_{AR}^{\ast }, $
and $ {\gamma}_P^{\ast } $
underestimate corresponding true values by the same multiplicative constant in the limit.Footnote
23 Thus,
$ {\gamma}_P^{\ast } $
underestimate corresponding true values by the same multiplicative constant in the limit.Footnote
23 Thus, $ -{\gamma}_A^{\ast }/{\gamma}_P^{\ast } $
and
$ -{\gamma}_A^{\ast }/{\gamma}_P^{\ast } $
and $ -{\gamma}_{AR}^{\ast }/{\gamma}_P^{\ast } $
, respectively, converge to
$ -{\gamma}_{AR}^{\ast }/{\gamma}_P^{\ast } $
, respectively, converge to $ {\gamma}_A $
and
$ {\gamma}_A $
and $ {\gamma}_{AR} $
, and MWTP to reduce risk by 1 chance in 100 is estimated consistently.Footnote
24 This approach provides a consistent estimator of the relationship of willingness to pay to subjective risk that, under the assumptions made, is simpler for the present context than full information maximum likelihood, control functions, or the strictly exogenous regressor approach used by Riddel (Reference Riddel2011).
$ {\gamma}_{AR} $
, and MWTP to reduce risk by 1 chance in 100 is estimated consistently.Footnote
24 This approach provides a consistent estimator of the relationship of willingness to pay to subjective risk that, under the assumptions made, is simpler for the present context than full information maximum likelihood, control functions, or the strictly exogenous regressor approach used by Riddel (Reference Riddel2011).
Alternatively, one might assume a lognormal distribution for willingness to pay for the vaccine and estimate a probit model for vaccine purchase intentions using natural logs of absolute risk reduction, posterior risk, and price as covariates, along with a constant term. An argument like that in Appendix A-5 in the Supplementary Material would establish that the negative of the ratio of the coefficient of log risk reduction to the coefficient of log price consistently estimates the elasticity of willingness to pay with respect to absolute risk reduction, supporting a test of the proportionality hypothesis of unit elasticity.Footnote 25 However, a lognormal model does not support consistent estimation of MWTP to reduce heart disease risk, because its estimators of mean and median MWTP depend on inconsistently estimated ratios involving the constant and the coefficient of log posterior risk. Therefore, the paper focuses on the consistent estimator of MWTP based on assuming a normal distribution for willingness to pay for the vaccine.Footnote 26
5.2 Estimates of MWTP to reduce heart disease risk
Table 3 presents probit estimates of stated vaccine purchase intentions. All estimated coefficients are statistically significant at the 1 % level. Estimates in column 2 treat willingness to pay for the vaccine as a function of percentage risk reduction. At the mean posterior risk of 33.61 chances in 100, estimates imply that the representative person is willing to pay $5.65 annually for a 1-chance-in-100 reduction in risk of future heart disease ( $ =\left(0.0081811/0.0043112\right)/\left(33.61/100\right) $
).
$ =\left(0.0081811/0.0043112\right)/\left(33.61/100\right) $
).
Table 3. Purchase intentions for vaccine to reduce heart disease risk. Probit estimates.
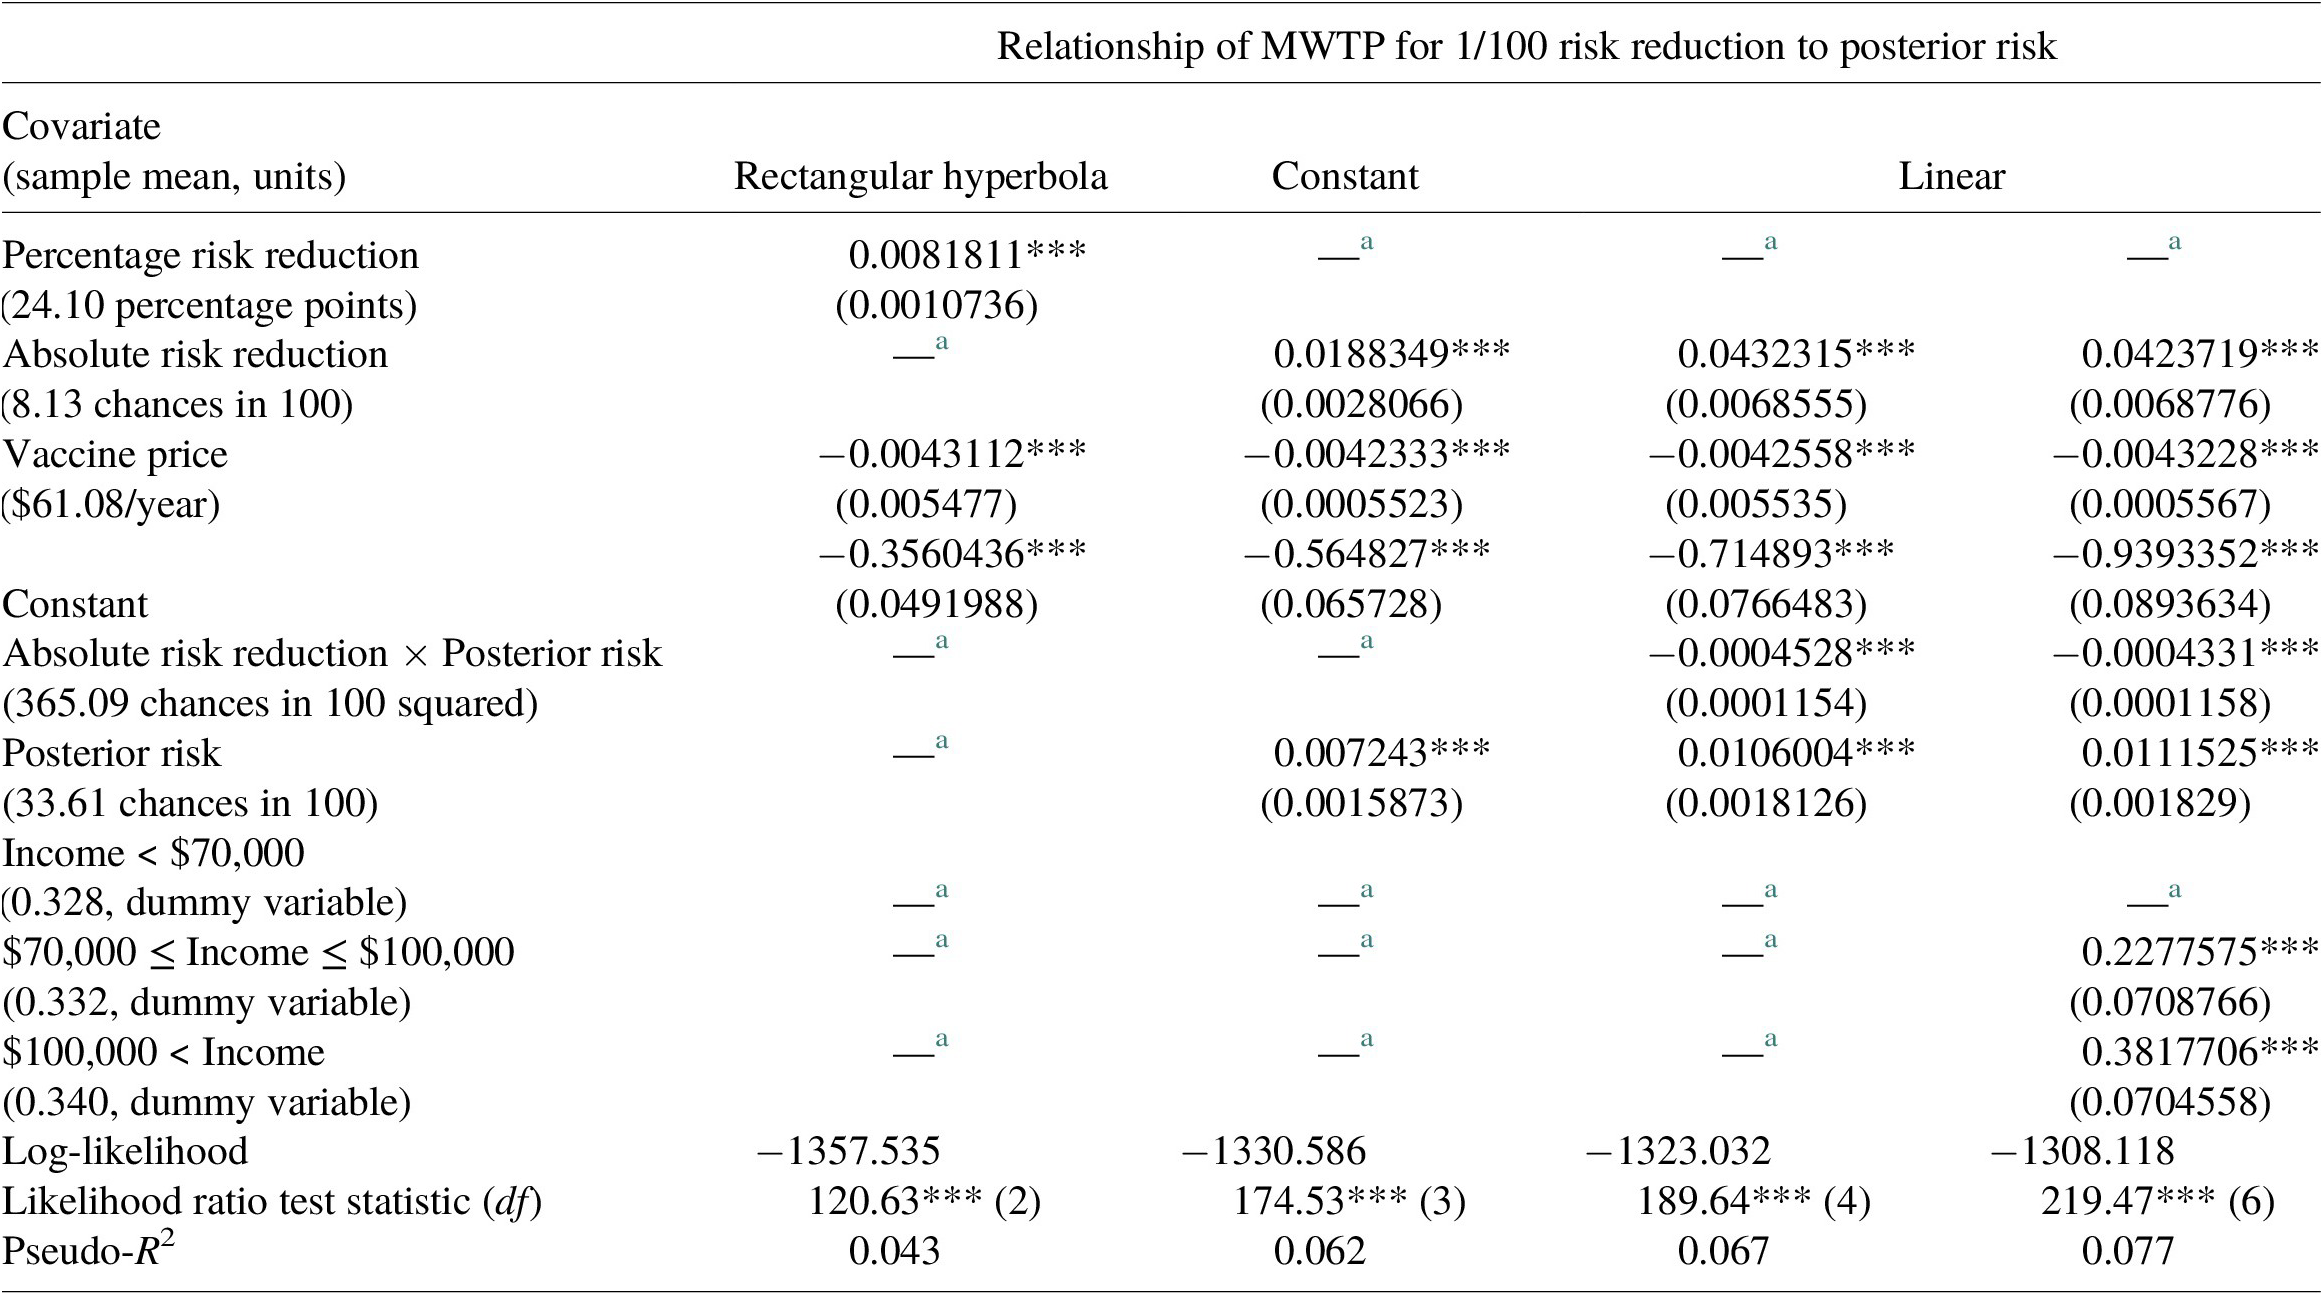
Note: ***Denotes significance at the 1 % level. Standard errors are presented in parenthesis.
a Denotes excluded variable.
Estimates in Column 3 treat MWTP to reduce risk by 1 chance in 100 as constant in posterior risk and imply an annual MWTP of $4.45 ( $ =0.0188349/0.042333 $
). Column 4 estimates treat MWTP to reduce risk as a linear function of posterior risk.Footnote
27 The negative coefficient of the interaction of absolute risk reduction and posterior risk implies that MWTP to reduce future heart disease risk by 1 chance in 100,
$ =0.0188349/0.042333 $
). Column 4 estimates treat MWTP to reduce risk as a linear function of posterior risk.Footnote
27 The negative coefficient of the interaction of absolute risk reduction and posterior risk implies that MWTP to reduce future heart disease risk by 1 chance in 100, $ -\left({\gamma}_A^{\ast }+{\gamma}_{AR}^{\ast }{R}_{1i}\right)/{\gamma}_P^{\ast } $
, diminishes as posterior risk increases.Footnote
28 The estimate of MWTP implied by column 4 at mean posterior risk is $6.58 per year (
$ -\left({\gamma}_A^{\ast }+{\gamma}_{AR}^{\ast }{R}_{1i}\right)/{\gamma}_P^{\ast } $
, diminishes as posterior risk increases.Footnote
28 The estimate of MWTP implied by column 4 at mean posterior risk is $6.58 per year ( $ =\left(0.0432315-0.0004528\times 33.61\right)/0.0042558 $
). The final column of Table 3 shows re-estimates of the linear form while controlling for annual household income. Estimates suggest that willingness to pay for the vaccine increases with income (although income coefficients are not estimated consistently) and imply MWTP to reduce future heart disease risk is $6.43.Footnote
29
$ =\left(0.0432315-0.0004528\times 33.61\right)/0.0042558 $
). The final column of Table 3 shows re-estimates of the linear form while controlling for annual household income. Estimates suggest that willingness to pay for the vaccine increases with income (although income coefficients are not estimated consistently) and imply MWTP to reduce future heart disease risk is $6.43.Footnote
29
Except for estimates in column 3, which constrain MWTP for risk reduction to be constant, results in Table 3 imply that MWTP diminishes as risk increases. Figure 2 illustrates the relationship of MWTP to posterior risk for estimates in columns 2–4. Three implications follow when MWTP to reduce health risk depends on the level of risk perceived (whether increasing or decreasing). First, when subjective and objective risks differ, evaluating MWTP for risk reduction using objective risk would misstate an individual’s valuation, because her MWTP depends on the risk she perceives. Second, when subjective risks are heterogeneous, MWTP to reduce risk will differ between persons with different risk perceptions, even if they have the same preferences. Third, when information affects subjective risk assessments, learning will affect MWTP to reduce risk. The next subsection investigates these implications empirically.
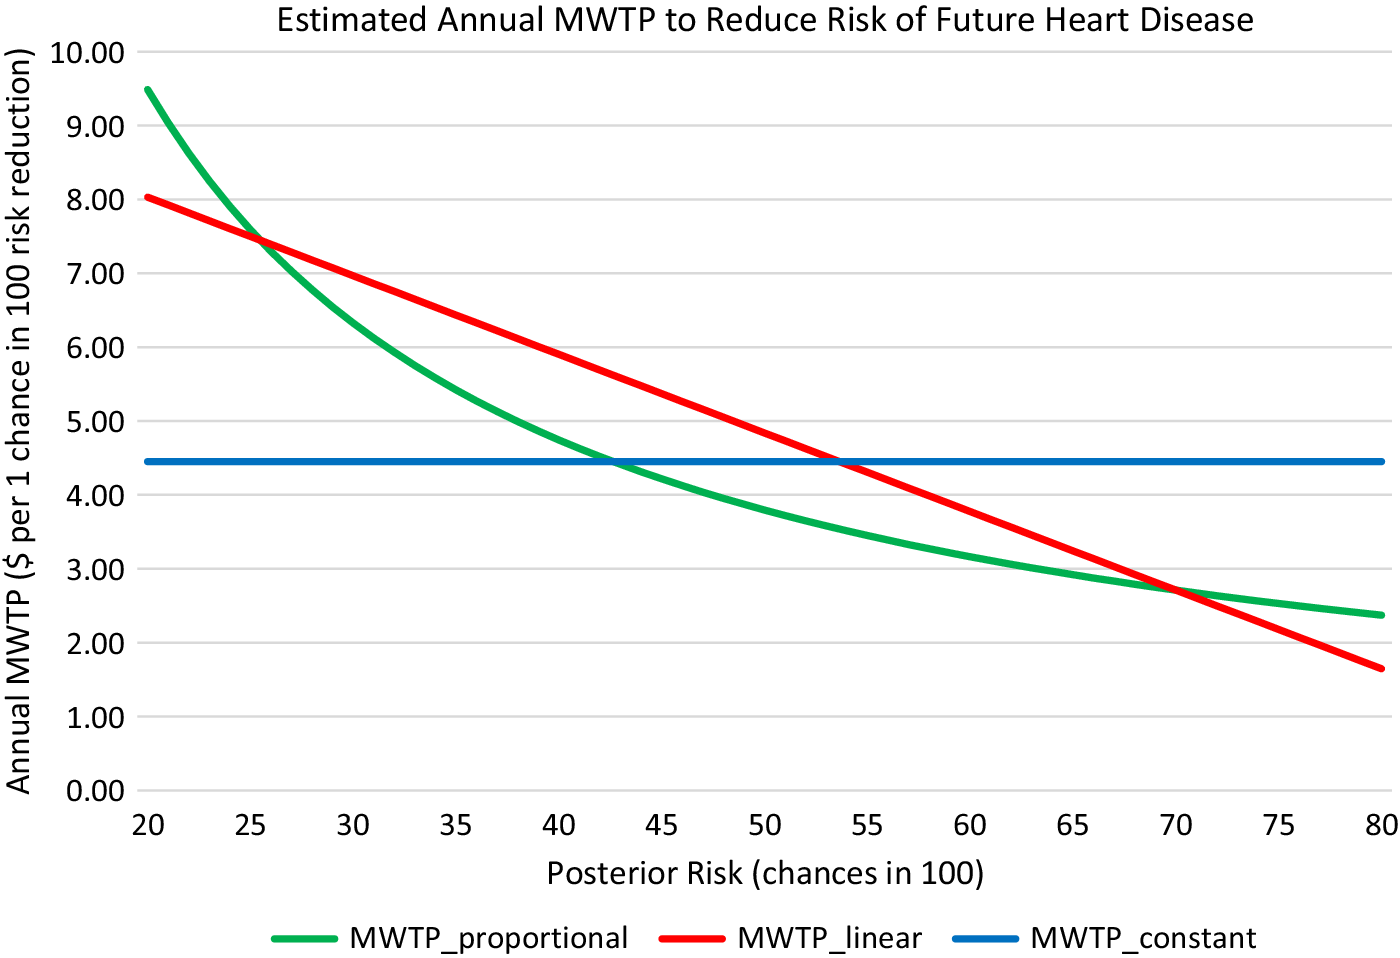
Figure 2. Estimated MWTP to reduce risk by 1 chance in 100 as a function of posterior risk.
5.3 Effects of subjective risks and information on MWTP to reduce risk
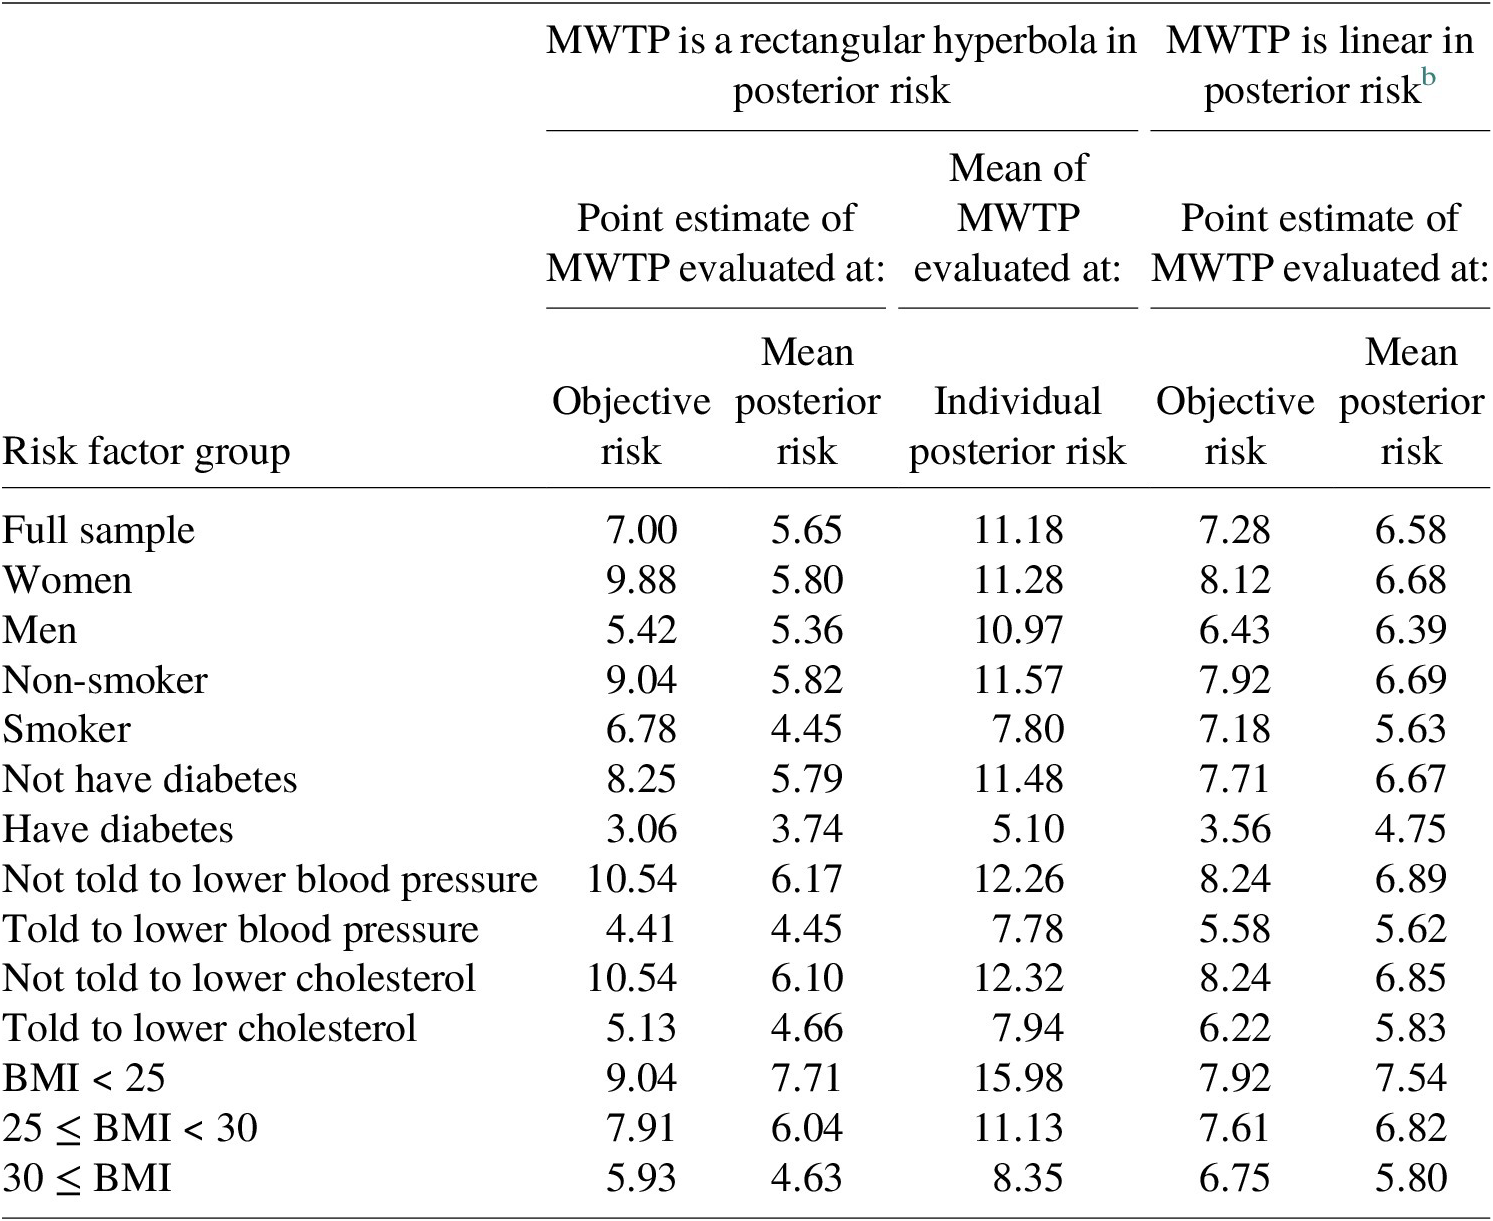
Table 4 presents estimates of annual MWTP to reduce heart disease risk by 1 chance in 100 by risk factor. Columns 2–4 are based on estimates in column 3 of Table 3 in which MWTP for absolute risk reduction is a rectangular hyperbola in risk; the columns show MWTP evaluated at objective risk (column 2) and at the mean of posterior perceived risk (column 3), as well as the mean of MWTP evaluated at each individual’s posterior risk (column 4). Columns 5 and 6 of Table 4 are based on estimates in column 4 of Table 3 in which MWTP is a linear function of risk and show MWTP at objective risk (column 5) and at mean posterior risk (column 6). (For the linear form, mean MWTP evaluated at individual posterior risk equals MWTP evaluated at mean posterior risk, and there are no differences by risk level when MWTP is constant in risk.) Comparisons in Table 4 assume that preference coefficients determining MWTP to reduce risk remain unchanged whether risk level is measured by subjective or objective risk.Footnote 30
Table 4 Annual MWTP for 1-chance-in-100 reductions in risk of future heart disease. a
Note: Standard errors were computed by the delta method in columns 2, 3, 5, and 6, and as the standard error of the mean in column 4.
a All estimates in the table are significant at the 1 % level. Monetary units are USD of the year 2011.
b When MWTP is linear in risk, the mean of MWTP evaluated at individual posterior risk equals MWTP evaluated at mean posterior risk.
The results in Table 4 illustrate the misstatement of MWTP when it is estimated based on objective rather than subjective risk. In this study, MWTP diminishes in risk and mean posterior risk exceeds the objective risk for almost all risk factor categories (see Table 1). Therefore, MWTP is smaller when evaluated at mean posterior risk than when evaluated at objective risk for all risk factor categories except: men and persons told to lower blood pressure, for whom the two estimates are about equal, and diabetics, for whom posterior risk is less than objective risk. For the remaining risk factor categories, MWTP estimated using objective risk exceeds MWTP estimated using mean posterior risk by 10–75 % based on the rectangular hyperbola form and by 7–28 % based on the linear form.
Point estimates of MWTP to reduce future heart disease risk by 1 in 100 based on either objective or mean posterior risk illustrate heterogeneity in MWTP between risk factor categories, but not heterogeneity in MWTP among individuals within risk factor categories. When MWTP is a nonlinear function of risk, heterogeneity in subjective risks causes MWTP evaluated at mean posterior risk to differ from the mean of MWTP evaluated at each individual’s posterior risk perception. As shown in columns 3 and 4 of Table 4 for the rectangular hyperbola form, in all cases except for persons with diabetes, the mean of individual MWTP exceeds MWTP evaluated at mean posterior risk by more than 70 %. In fact, the mean MWTP evaluated using individual posterior risk exceeds MWTP evaluated at objective risk. These outcomes reflect the convexity of the rectangular hyperbola and heterogeneity in posterior risks.Footnote 31
To more fully account for heterogeneity in MWTP arising from risk beliefs, annual MWTP to reduce future heart disease risk by 1 chance in 100 was computed by individual using estimates in Table 3 along with each person’s posterior risk assessment. The distribution of MWTP is widely dispersed, with the 95th percentile value exceeding the 5th percentile value by more than nine times for the rectangular hyperbola and by more than four times for the linear form.Footnote 32 This dispersion, based solely on heterogeneity in subjective perceptions of risk, is larger than the dispersion Cameron and DeShazo (Reference Cameron and DeShazo2013) report for MWTP to reduce the risk of immediate death, which varied by as much as a factor of 3 between the 5th and 95th percentiles of the distribution.
A third implication of the dependence of MWTP on the level of risk is that if the provision of information affects perceived risks, it also affects MWTP. In the present study, people on average are willing to pay more at the margin to reduce risk after learning about risk because on average they reduced prior risks after receiving information, and MWTP is diminishing in risk. The overall effect is small, however, because mean updates of prior risk perceptions were modest. MWTP evaluated at mean prior risk is 4 % smaller than when evaluated at mean posterior risk when MWTP is a linear function of risk level, and 7 % smaller when MWTP is a rectangular hyperbola in risk level.
5.4 Policy illustration: economic benefits of reducing heart disease risk
This subsection presents a simple illustration of how accounting for subjective risk might affect estimated economic benefits, focusing on (i) differences between objective and mean subjective risk levels, (ii) possible differences between objective and subjective risk changes, and (iii) heterogeneity in subjective risk levels and changes. Consider the “Healthy People 2020” goal of reducing the U.S. death rate from coronary heart disease by 20 % from its 2007 level. Suppose policies to achieve this goal aimed to reduce heart disease risk by 20 % of its overall objective level of 27 in 100, for an objective risk reduction of 5.4 in 100.
Policy analysts typically estimate benefits of health risk reductions by multiplying a single estimate of marginal value of risk by an assumed risk change. This procedure is applied using MWTP estimates derived from Table 3 and inflated to 2020 USD. Treating MWTP as a rectangular hyperbola in risk, MWTP computed from mean prior risk implies the representative person would be willing to pay $32.74 annually to reduce her future heart disease risk by 5.4 chances in 100. Being based on prior risk, this value is taken to represent valuations of people who had not received the heart disease information. Assuming for illustration that this value applies to all adults in the U.S. 2018 population, estimated annual benefits would be $8.3 billion. Estimated benefits would be 7 % higher ($8.9 billion) using MWTP estimates computed from mean posterior risks, illustrating the modest impact of information on estimated benefits in the present study. For comparison, evaluating MWTP at the aggregate objective risk level yields $11.0 billion in estimated benefits, which is 33 % higher than the estimate based on mean prior risks and 24 % higher than the estimate based on mean posterior risks.Footnote 33
Discussion thus far has assumed that although subjective and objective risk levels differ, the risk changes are the same. An alternative possibility considered by Johansson-Stenman (Reference Johansson-Stenman2008) occurs if the subjective level and change in risk differ from the objective. Furthermore, Salanie and Triech (Reference Salanie and Triech2009) show that optimal regulation based on objective risk must consider that people will respond according to their subjective perceptions. To illustrate the impact of these considerations, suppose benefits are estimated based on a risk reduction of 20 % of the mean perceived posterior risk of 33.61/100, or 6.7 chances in 100. The estimated annual benefits using the rectangular hyperbola would be $11.1 billion. This amount approximately equals the estimate based on a risk change of 5.4/100 evaluated at objective risk, because the 24 % larger subjective risk change (6.7/100 relative to 5.4/100) offsets the 24 % larger valuation based on objective risk.
Multiplying a single estimate of marginal value by a risk change does not account for heterogeneity in MWTP arising from individual variation in perceived risk. To account for heterogeneity, each person’s individual MWTP to reduce risk was multiplied by the assumed risk reduction of either 5.4 or 6.7 chances per 100. The resulting national benefit estimates are $17.6 and $21.9 billion (2020 USD). These values exceed by 60 and 98 % the estimated benefit based on an objective risk change of 5.4 in 100 evaluated at objective risk.Footnote 34
6. Conclusion
This paper has explored the idea that if marginal valuations of health risk depend on the level of risk, estimates of the value of reduced risk will reflect individual preferences more accurately when based on valid measures of perceived rather than objective risks. The study contributes to the literature by assessing the validity of risk perceptions and their updating, consistently estimating the relationship between MWTP and endogenously perceived risk, and showing the importance of employing risk perception information for accurate benefit measurement. Empirical results support the construct validity of subjective prior and posterior risks of future heart disease and show that substantial heterogeneity in the valuation of reduced risk arises from heterogeneity in risk perceptions, that learning affects MWTP for reduced risk, and that using objective risks for valuation may misstate benefits of reduced heart disease risks by as much as 60–98 %.
Supplementary Materials
To view supplementary material for this article, please visit http://doi.org/10.1017/bca.2022.14.
Acknowledgements
Helpful comments on this paper were received from Harry J. Paarsch and at presentations at the Department of Resource Economics and Environmental Sociology, University of Alberta, and at an Association of Environmental and Resource Economists session at the meetings of the Southern Economic Association, and the Society for Benefit Cost Analysis, and from participants at the conference “Pressing and Challenging Changes,” Alberta School of Business. The U.S. Environmental Protection Agency (USEPA) partially funded this research under RD-3159201-0 and RD-83326301-0. The research has not been subjected to USEPA review and may or may not reflect the views of the Agency.
Competing interests
The authors declare none.


 Open access