

1. Introduction
In 2023, the world will be at “halftime” with respect to the sustainable development goals (SDGs). This midline acts as an important milestone to review the progress of the SDGs and develop policies based on the most effective interventions. As we advance toward 2030, both funders and governments will continue to face high demands for health and social investments in order to make progress toward the SDGs and the achievement of universal health coverage while dealing with new challenges such as emerging infectious diseases, humanitarian crises, and climate change. All of these concerns present a need for further political commitment and contributions to protect the hard-won gains achieved during the first half of the SDG timeline.
Building on the previous Decade of Vaccine Economics (DOVE) Return-on-Investment (ROI) study and the subsequent Vaccine Economics Research for Sustainability and Equity (VERSE) project (Sim et al., Reference Sim, Watts, Constenla, Brenzel and Patenaude2020), this analysis aims to provide insights on the economic benefits and costs of immunization programs. Pediatric immunization is largely considered one of the most cost-effective interventions, with previous studies estimating the ROI for common pediatric vaccines to be between US$ 15 and US$ 52 per every US$ 1 invested (Ozawa et al., Reference Ozawa, Clark, Portnoy, Grewal, Brenzel and Walker2016; Sim et al., Reference Sim, Watts, Constenla, Brenzel and Patenaude2020). In addition, while immunization directly impacts health, and therefore the SDGs, it has also been found to play an indirect role in contributing toward advancements in 14 out of the 17 SDGs (Decouttere et al., Reference Decouttere, Boeck and Vandaele2021). As such, it is important to understand the benefits and costs of immunization programs in a manner that allows comparison directly across both healthcare interventions as well as nonhealth interventions targeted at other SDGs.
2. Objective
The objective of this analysis is to provide estimates of the economic costs, benefits, and benefit-cost ratios (BCRs) for interventions to attain SDG targets within 80 low-income countries (LICs) and lower-middle-income countries (LMICs) in order to advocate for more funding to the most effective interventions and policies across all sectors over the next 7.5 years. This particular evaluation shines a light on pediatric immunization, estimating total and incremental BCRs for nine different vaccines in 80 LMICs (Sim et al., Reference Sim, Watts, Constenla, Brenzel and Patenaude2020).
3. Scope
This analysis is focused on the economic benefits and costs of immunization programs in 80 low- and middle-income countries targeted by the Global Vaccine Action Plan (GVAP) from 2023 to 2030. Of these 80 countries, 27 are classified as LICs and 53 are classified as LMICs. The economic evaluation covers 9 vaccines employed against 10 antigens and delivered through both routine immunization programs and supplemental immunization activities (SIAs). The vaccines covered in the analysis include pentavalent vaccine, human papillomavirus (HPV) vaccine, Japanese encephalitis (JE) vaccine, measles (MCV) vaccine, measles-rubella (MR) vaccine, meningococcal conjugate A (Men A) vaccine, pneumococcal conjugate (PCV) vaccine, rotavirus vaccine, and yellow fever (YF) vaccine and correspond to the vaccines covered in the return-on-investment estimates presented in Sim et al. (Reference Sim, Watts, Constenla, Brenzel and Patenaude2020), which covered 94 LMICs from 2011 to 2030. Table 1 contains the full list of countries and detailed categorization of the countries according to the World Health Organization (WHO) region, the World Bank income group, and GAVI-eligibility and country-transition classification. Table 2 contains the complete list of vaccines and assumptions about corresponding immunization strategies.
Table 1. Full list of countries.
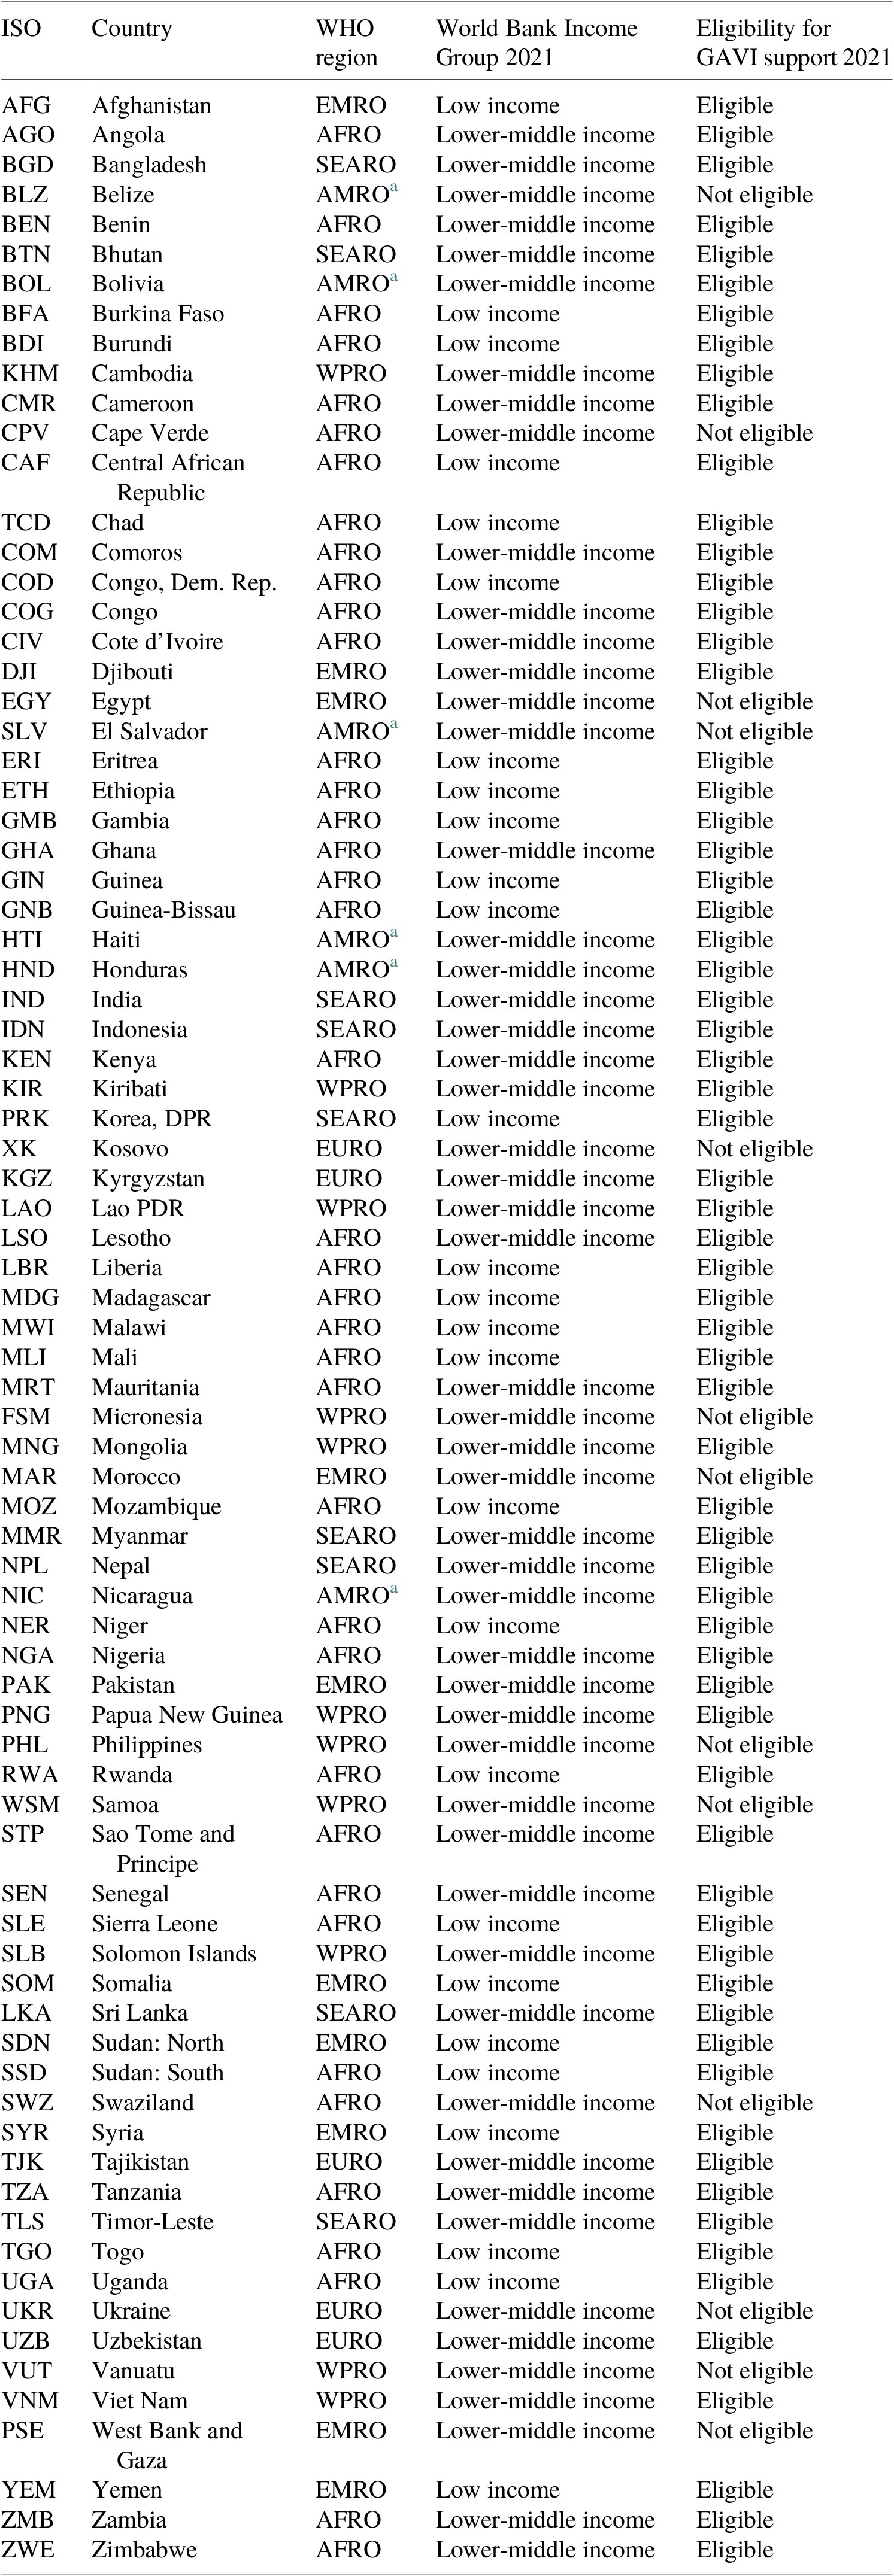
a Eligible for PAHO’s revolving fund.
Table 2. Pathogens, vaccines, and delivery strategies included in the analysis.

RI, routine immunization; SIA, supplemental immunization activities.
4. Method
4.1. Costs
4.1.1. Scope of costing analysis and components
The analysis estimates different components of immunization-program costs for routine immunization and SIAs, which are largely divided into two components: vaccine costs, which include costs to procure vaccines, including injection supplies and freight; and immunization delivery costs, which include nonvaccine commodity costs to deliver immunizations to target populations. Immunization delivery costs usually include all or any of the following components:
-
(i) Labor function: personnel costs (salaries, per diem, and travel allowances).
-
(ii) Storage function: cold chain equipment, maintenance, and overheads.
-
(iii) Transportation function: vehicles, transport, and fuel.
-
(iv) Other capital costs: buildings, utilities and other overheads, building construction, and capital equipment.
-
(v) Other recurrent costs: program management, short-term training, information, education and communication (IEC)/social mobilization, disease surveillance, wastage management, and other recurrent costs.
The analysis was conducted from the health system perspective, and it does not factor in household costs such as transportation or lost productive time due to immunization sessions.
Vaccine cost
We generated demand forecasts for each type of routine and SIA vaccine. The number of doses procured is a function of the size of target population, vaccine coverage rate, the number of recommended doses for a fully immunized person, a wastage rate, and a buffer stock rate. The Vaccine Impact Modelling Consortium (VIMC) (n.d.) secretariat provided the demographic data based on the UN World Population Prospect 2019 as well as data for each antigen based on GAVI’s operational forecast updated in 2018. For SIAs, we used separate data on target populations and the coverage rate provided by the VIMC. Vaccine-specific, time-invariant wastage rates are based on GAVI’s Detailed Product Profile (World Health Organization, 2005). Based on consultations with the GAVI market-shaping team, uniform buffer stock rates (25% for routine immunization and 0% for SIAs) were applied to all vaccines (Public Price Forecast, 2021).
 $$ \mathrm{Number}\hskip0.5em {\mathrm{of}\ \mathrm{doses}}_{ij k}={\displaystyle \begin{array}{l}{\mathrm{Target}\ \mathrm{population}}_{ij k}\times {\mathrm{Coverage}\ \mathrm{rate}}_{ij k}\\ {}\times \mathrm{Number}\ \mathrm{of}\hskip0.5em {\mathrm{recommended}\ \mathrm{doses}}_{ij}\times \left(1+{\mathrm{Wastage}\ \mathrm{rate}}_{ij}\right)\\ {}\times \left(1+\mathrm{Buffer}\hskip0.5em {\mathrm{stock}\ \mathrm{rate}}_i\right),\end{array}} $$
where i = vaccine, j = country, and k = year.
Vaccine prices are from three different sources. The GAVI provided the public price forecast information (2023–2030) for 73 GAVI countries (Pan American Health Organization (PAHO)/WHO, 2021). The other countries included both PAHO countries and non-GAVI/non-PAHO countries. Since PAHO and United Nations International Childrenʼs Emergency Fund (UNICEF) do not conduct price forecasts for future years, we generated price forecasts (2023–2030) based on the same principle applied to the GAVI price forecasts, which takes the estimates from the latest year where data are available and assumes a constant price throughout the remaining years. This assumption is made due to difficulties associated with long-term forecasts of the market landscape and corresponding vaccine prices. The historical vaccine prices for PAHO countries were obtained from the PAHO Revolving Fund price list (Pan American Health Organization (PAHO)/WHO, 2021). For the other non-GAVI and non-PAHO countries, the UNICEF vaccine price list was applied (UNICEF, 2018).
For PAHO, UNICEF, and GAVI’s forecasted prices, we took an average price per dose for each vaccine across all listed products offered by multiple manufacturers, given the uncertainty in volume procured for each product type. GAVI’s immunization supply costs (syringe, recon syringe, and safety box) and freight costs (as a percentage of the unloaded vaccine price) were applied to all 80 countries.
The number of doses was multiplied by price per dose for each vaccine, country, and year to estimate the total vaccine costs.
 $$ {\mathrm{Vaccine}\ \mathrm{costs}}_{ijk}=\sum_{k=2023}^{2030}\sum_{j=1}^{80}\sum_{i=1}^9\left(\mathrm{number}\hskip0.5em {\mathrm{of}\ \mathrm{doses}}_{ijk}\times \mathrm{price}\hskip0.5em \mathrm{per}\hskip0.5em {\mathrm{dose}}_{ijk}\right). $$
Immunization delivery cost
Routine immunization
Estimates of routine delivery cost per dose were derived from the most recent empirical results estimated by Portnoy et al. (Reference Portnoy, Vaughan, Clarke-Deelder, Suharlim, Resch, Brenzel and Menzies2020), which generated standardized delivery costs for 134 LMICs through a Bayesian meta-regression model. The study used the Immunization Delivery Cost Catalogue (IDCC) to help predict future delivery cost per dose. For Kosovo, West Bank, and Gaza – where estimates are not available through the Portnoy et al. (Reference Portnoy, Vaughan, Clarke-Deelder, Suharlim, Resch, Brenzel and Menzies2020) model, we used the estimates from the immunization costing study conducted by Sim et al. (Reference Sim, Watts, Constenla, Huang, Brenzel and Patenaude2021).
 $$ \mathrm{Immunization}\hskip0.5em {\mathrm{delivery}\ \mathrm{cost}\mathrm{s}}_{ij k}=\sum_{k=2023}^{2030}\sum_{j=1}^{80}\sum_{i=1}^9\left(\mathrm{number}\hskip0.5em {\mathrm{of}\ \mathrm{doses}}_{ij k}\times \mathrm{delivery}\ \mathrm{cost}\hskip0.5em \mathrm{per}\hskip0.5em {\mathrm{dose}}_{ij}\right). $$
Incremental cost for introducing new vaccines: The empirical studies from the IDCC provide unprecedented opportunities for estimating incremental cost for new vaccine introduction in addition to estimating total costs (Immunization Delivery Costs in Low- and Middle-Income Countries, 2020). Due to a lack of data for other vaccines, we estimated only the average incremental cost per dose for HPV, PCV, and rotavirus vaccines. We also assumed that, in the future, pentavalent and MR vaccines will slowly replace traditional vaccines against the same antigens (i.e., DTP and measles). Incremental costs include both introduction and startup costs for newly introduced vaccines, as well as recurrent costs. No distinction was made between HPV cost estimates from routine delivery via health facility and school delivery given a large degree of heterogeneity in costs of each method as well as decisions regarding HPV vaccine delivery strategies, even within countries.
Incremental delivery cost per percentage increase in coverage: Earlier modeling analyses took different perspectives on how routine immunization delivery cost per dose will change beyond baseline years. Gandhi et al. (Reference Gandhi, Lydon, Cornejo, Brenzel, Wrobel and Chang2013) assumed a constant delivery cost per dose that is not linked to the coverage rate or additional doses. Portnoy et al. (Reference Portnoy, Ozawa, Grewal, Norman, Rajgopal, Gorham, Haidari, Brown and Lee2015) applied a marginal delivery cost for additional doses derived from a regression analysis of cMYP costing tools separately for countries with DTP3 coverage rates above and below 80%. Because it is increasingly important to understand the additional costs required to increase immunization coverage rates, we have used results from several recent studies (Batt et al., Reference Batt, Fox-Rushby and Castillo-Riquelme2004; Pegurri et al., Reference Pegurri, Fox-Rushby and Damian2005; Ozawa et al., Reference Ozawa, Clark, Portnoy, Grewal, Brenzel and Walker2016).
Ozawa et al. (Reference Ozawa, Yemeke and Thompson2018) is an update to two systematic reviews (Batt et al., Reference Batt, Fox-Rushby and Castillo-Riquelme2004; Pegurri et al., Reference Pegurri, Fox-Rushby and Damian2005) that aimed to summarize evidence in peer-reviewed or grey literature that examined the cost and effect of increasing the immunization coverage. Interventions used to increase coverage differs across studies, ranging from text message reminders to education, publicity, and incentives for healthcare personnel. Unlike these two reviews that focused on low- and middle-income countries, the new study by Ozawa et al. (Reference Ozawa, Yemeke and Thompson2018) also included evidence from high-income countries and quantitatively examined the relationship between intervention cost per dose and coverage changes, which shows increasing intervention cost per dose for higher levels of coverage. We used the cost function derived from Ozawa et al. (Reference Ozawa, Yemeke and Thompson2018) to estimate the incremental cost per dose for each annual coverage rate increase for each country.
We present side-by-side the results from a constant delivery cost per dose assumption (“baseline assumption”) and from an increasing delivery cost per dose assumption (“diminishing returns to scale assumption”). However, the results under the diminishing returns to scale assumption should be interpreted with caution. Underlying data from the systematic review have inherent limitations due to lack of standardized reporting, recall bias, and heterogeneity of study settings and designs. In addition, the cost function presented is based on data from both LMICs and high-income countries, presenting the possibility of overestimation. When excluding high-income settings from the analysis, a linear relationship between coverage increases and cost per dose cannot be rejected, and as a result, the assumption of increasing delivery cost per dose across all countries and baseline coverage rates remains a subject of debate.
SIAs
Immunization delivery costs for SIAs, often referred to as “operational costs” (Gandhi et al., Reference Gandhi, Lydon, Cornejo, Brenzel, Wrobel and Chang2013), consist of nonvaccine costs to deliver vaccines to the target population and manage SIA efforts that are targeted and time-limited. SIAs were conducted for six of the nine vaccines included in this analysis. Catch-up, follow-up, or past preventive campaigns were conducted for measles, measles-rubella, MenA, JE, and yellow fever vaccines. Multi-age cohort (girls of age 10–14) for HPV is optional for countries that choose to immunize additional girls beyond the routine cohort and such efforts are also categorized as SIA.
To quantify the delivery cost per dose for SIAs, we used information from the IDCC, a systematic review by Gandhi et al. (Reference Gandhi, Lydon, Cornejo, Brenzel, Wrobel and Chang2013), and budgeted amount per dose estimates from country proposals submitted to GAVI. We collected 52 estimates from these sources and calculated the average cost per dose for each vaccine type (see Table 3). These estimates were then applied to 80 countries.
Table 3. Summary table for immunization delivery cost per dose estimates.
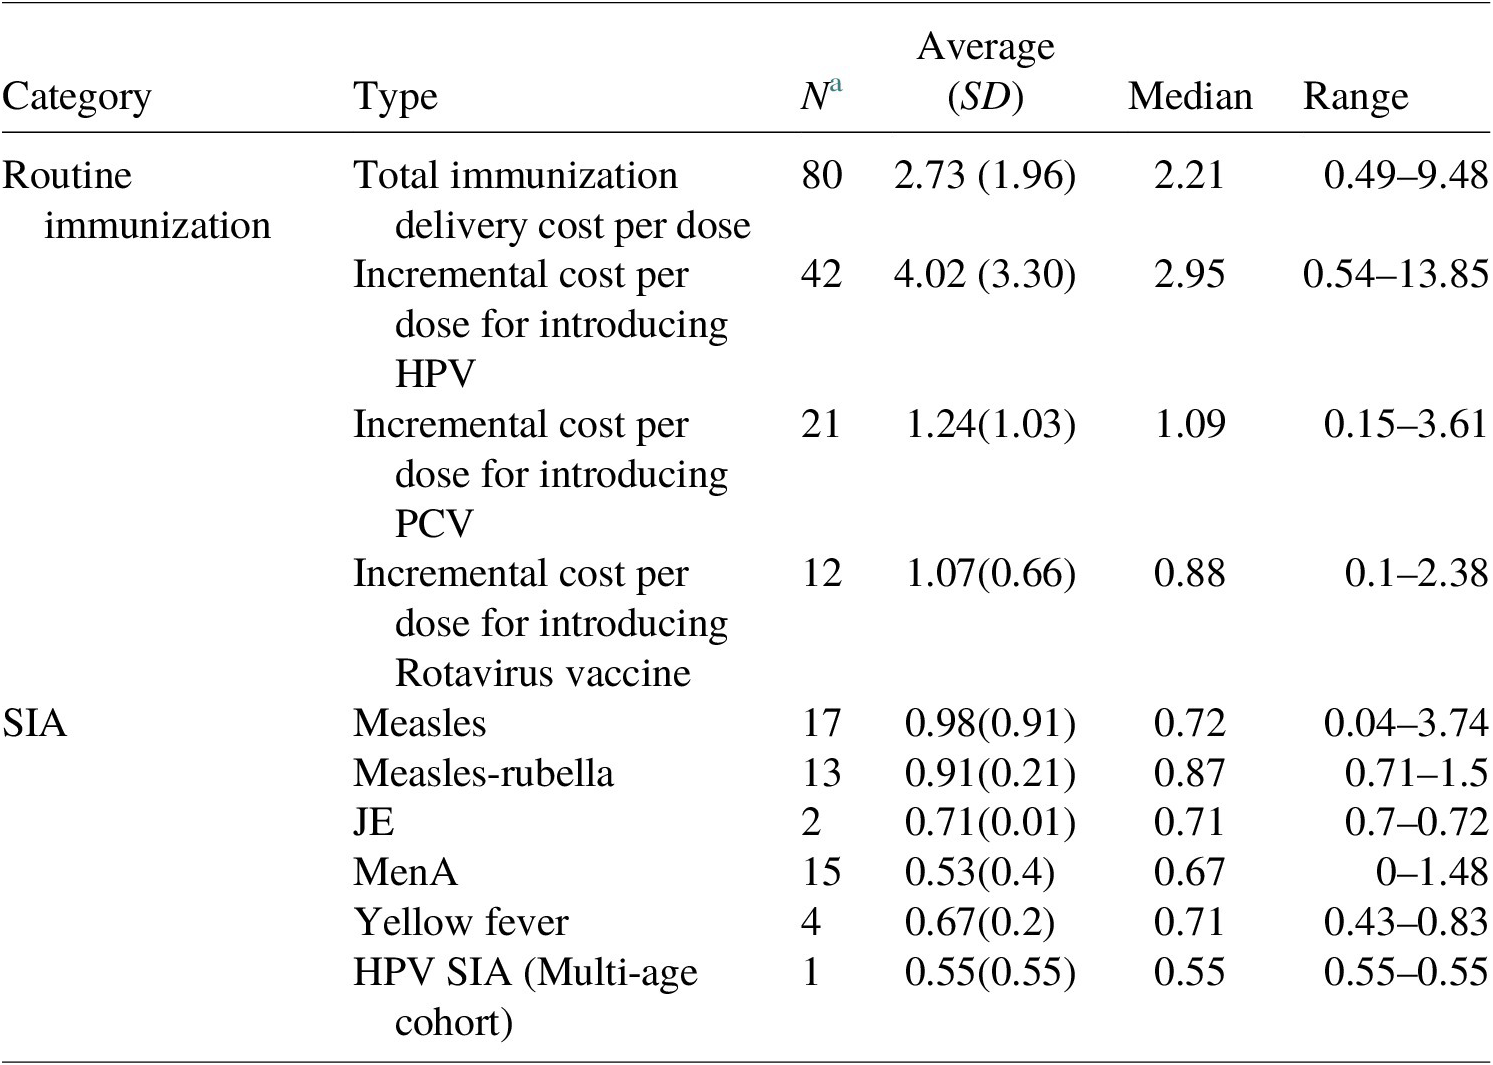
a Number of estimates in the model; all costs in US$ 2020; no distinction was made with respect to HPV cost estimates from routine delivery via health facility and school delivery given the uncertainties about country decisions regarding delivery strategies.
Sensitivity analysis
We conducted probabilistic sensitivity analysis (PSA) using Monte Carlo simulations to determine uncertainty ranges for each scenario. We varied five parameters simultaneously and performed 10,000 model runs to construct a 95% uncertainty range for total immunization program costs. We used a Gamma distribution for the cost per dose estimates from the compiled data mentioned above for three parameters – country-specific routine immunization delivery cost per dose, vaccine-specific SIA delivery cost per dose, and incremental delivery cost per dose for PCV, HPV, and RV vaccines. A uniform distribution was used for the percent change in vaccine price per year (between ±15%) (Briggs et al., Reference Briggs, Sculpher and Claxton2006).
Scenario analysis
Under the base-case scenario, we produced estimates with constant returns to scale for delivery costs at an 8% discounted rate per guidance from the Copenhagen Consensus Center. This scenario is presented as the primary result. We conducted additional scenario analyses by adopting a diminishing returns to scale assumption, using discount rates of 0 and 3% and adopting a wastage rate of 0% instead of the wastage rate based on GAVI’s detailed product profile (GAVI, 2018) to demonstrate the impact of diseconomies of scale, vaccine wastage, and discounting on immunization program costs.
In addition, we estimated the incremental cost of achieving 2030 targets by comparing the total costs of achieving the 2030 coverage targets to the cost of immunization programs if the coverage level in 2022 was held constant over time.
 $$ {\displaystyle \begin{array}{l}\mathrm{Incremental}\ \mathrm{to}\ \mathrm{achieve}\hskip0.5em 2030\hskip0.5em \mathrm{target}\hskip0.5em \mathrm{at}\hskip0.5em \mathrm{halftime}={\mathrm{Total}\ \mathrm{costs}}_{2030\hskip0.5em \mathrm{target}\ \mathrm{coverage}}\\ {}\hskip1em -\hskip2px {\mathrm{Total}\ \mathrm{costs}}_{2022\hskip0.5em \mathrm{coverage}}.\end{array}} $$
In summary, the scenarios evaluated included the following:
-
(i) The total cost of immunization programs (discounted at 8%, constant returns to scale, and GAVI DPP wastage rates).
-
(ii) The total cost of immunization program (discounted at 8%, 0% wastage rate, and constant returns to scale).
-
(iii) The total cost of immunization program (discounted at 8%, GAVI DPP wastage rates, with diminishing returns to scale).
-
(iv) The total cost of immunization program (discounted at 3%, constant returns to scale, and GAVI DPP wastage rates).
-
(v) The total cost of immunization program (undiscounted, constant returns to scale, and GAVI DPP wastage rates).
-
(vi) Incremental costs of achieving 2030 target at halftime compared to 2022 coverage level (discounted at 8%, constant returns to scale for routine immunizations, and GAVI DPP wastage rates).
-
(vii) Incremental costs of achieving 2030 target at halftime compared to 2022 coverage level (discounted at 3%, constant returns to scale for routine immunizations, and GAVI DPP wastage rates).
-
(viii) Incremental costs of achieving 2030 target at halftime compared to 2022 coverage level (discounted at 0%, constant returns to scale for routine immunizations, and GAVI DPP wastage rates).
-
(ix) Incremental costs of achieving 2030 target at halftime compared to 2022 coverage level (discounted at 8%, diminishing returns to scale for routine immunizations, and GAVI DPP wastage rates).
Furthermore, due to limited data availability and no standardized vaccine impact models, we were unable to estimate comparable economic benefits for BCG and TCV vaccines. Therefore, these two vaccines were not included in the total immunization program costs or BCRs presented in the results. Instead, we generated cost estimates for both BCG and TCV vaccines and present these estimates separately in Section 5.
4.1.2. Economic benefits
Due to the scarcity of country-specific costs and epidemiologic data and the complexity of estimating the economic burden associated with the antigens modeled, the DOVE-COI models draw upon a variety of data sources. Health impact data are drawn from the focal models of the Goldstein et al. (Reference Goldstein, Zhou, Hadler, Bell, Mast and Margolis2005, Reference Goldie, O’Shea, Campos, Diaz, Sweet and Kim2008), Chen et al. (Reference Chen, Fricks and Ferrari2012), Tartof et al. (Reference Tartof, Cohn, Tarbangdo, Djingarey, Messonnier, Clark and Kambou2013), Walker et al. (Reference Walker, Tam and Friberg2013), Garske et al. (Reference Garske, Van Kerkhove, Yactayo, Ronveaux, Lewis, Staples, Perea and Ferguson2014), Vynnycky et al. (Reference Vynnycky, Papadopoulos and Angelis2019), Quan et al. (Reference Quan, Thao, Duy, Nhat and Clapham2020), and VIMC (n.d.). The modeler and modeling teams that produced these outcomes are listed in Table 4. Key input values that are uniform across the DOVE-COI models are described in Table 5. In addition to these uniform parameters, literature reviews were conducted to identify sources of information for all model inputs that vary by antigen (see Table 6). The use of these parameters in the DOVE-COI models is illustrated in Figure 1 and described in more detail in Section 4.1.4.
Table 4. Overview of health impact models used in the economic benefits analysis (continued next page).

a Hib/PCV: Only includes impact on children under 5 years. Model estimates deaths averted using residual deaths after accounting for existing interventions, thus reducing the risk of double counting deaths averted from other (nonvaccine interventions); coverage of other interventions (sanitation, antibiotic treatment) held constant.
b HPV: Vaccine provides protection against vaccine-type (HPV 16 and 18), no cross-protection.
c MenA: Vaccination is assumed to be superior to natural immunity.
d Rotavirus: Model accounts for regional variation in the proportion of severe diarrhea caused by rotavirus; only includes protection from complete vaccination (either 2-dose or 3-dose rotavirus vaccine).
e YF: Proportion of cases leading to severe disease and the case fatality ratio has been updated to 12 and 47%, respectively for model runs following 2015. This analysis applies the lower estimates for consistency with previous analyses, therefore generating a conservative estimate of the economic impact.
Table 5. Sources of key input values used across DOVE-COI models.

Table 6. DOVE-COI model/antigen-specific sources of key input values.


Figure 1. Key parameters used in COI models by model component.
Additional input data not represented in the tables were drawn from validated, multilateral agency sources and include real gross domestic product (GDP) per capita, consumer price indices (CPI), US$ to local currency unit (LCU) exchange rates, and percentage of population living in urban areas (IMF, 2010; World Bank, 2013). Wherever possible, disease burden inputs (including the age of vaccination, age of infection, and age of death) were based on epidemiological data and assumptions provided by health impact modeling teams to ensure continuity by aligning the two sets of models as much as possible (VIMC, n.d.).
4.1.3. Antigen-specific model inputs
The parameters listed in Table 6 varied by antigen-specific model and were primarily derived from country-level surveys (DHS, SOWC) and estimates in the published literature (The DHS Program, n.d.; UNICEF, n.d.; Okanurak et al., Reference Okanurak, Sornmani and Indaratna1997; Campagne et al., Reference Campagne, Schuchat, Djibo, Ousséini, Cissé and Chippaux1999; Ehrenkranz et al., Reference Ehrenkranz, Lanata, Penny, Salazar-Lindo and Glass2001; Monath, Reference Monath2001; Hui et al., Reference Hui, Chan, Leung, Hung, Chan and Sung2002; Parashar et al., Reference Parashar, Hummelman, Bresee, Miller and Glass2003; Lanzieri et al., Reference Lanzieri, Parise, Siqueira, Fortaleza, Segatto and Prevots2004; Fischer et al., Reference Fischer, Anh, Lynn Antil, Kilgore, Thiem, Rheingans, Tho, Glass and Bresee2005; Nielsen et al., Reference Nielsen, Eugen-Olsen, Aaby, Mølbak, Rodrigues and Fischer2005; Podewils et al., Reference Podewils, Antil, Hummelman, Bresee, Parashar and Rheingans2005; Chu & Liaw, Reference Chu and Liaw2006; Akumu et al., Reference Akumu, English, Scott and Griffiths2007; Broughton, Reference Broughton2007; Isakbaeva et al., Reference Isakbaeva, Musabaev, Antil, Rheingans, Juraev, Glass and Bresee2007; Kim et al., Reference Kim, Salomon and Goldie2007, Reference Kim, Lee and Goldie2010; Rheingans et al., Reference Rheingans, Constenla, Antil, Innis and Breuer2007; Gessner et al., Reference Gessner, Sedyaningsih, Griffiths, Sutanto, Linehan, Mercer, Mulholland, Walker, Steinhoff and Nadjib2008; Hussain et al., Reference Hussain, Waters, Khan, Omer and Halsey2008; Mendelsohn et al., Reference Mendelsohn, Asirvatham, Mwamburi, Sowmynarayanan, Malik, Muliyil and Kang2008; Nokes et al., Reference Nokes, Abwao, Pamba, Peenze, Dewar, Maghenda, Gatakaa, Bauni, Scott, Maitland and Williams2008; Sinha et al., Reference Sinha, Constenla, Valencia, O’Loughlin, Gomez, de la Hoz, Valenzuela and de Quadros2008; Clark et al., Reference Clark, Walker, Mosqueira, Penny, Lanata, Fox-Rushby and Sanderson2009; Flem et al., Reference Flem, Latipov, Nurmatov, Xue, Kasymbekova and Rheingans2009; Tate et al., Reference Tate, Rheingans, O’Reilly, Obonyo, Burton, Tornheim and Adazu2009; Wilopo et al., Reference Wilopo, Kilgore, Kosen, Soenarto, Aminah, Cahyono, Ulfa and Tholib2009; Berry et al., Reference Berry, Johns, Shih, Berry and Walker2010; Giglio et al., Reference Giglio, Cane, Micone and Gentile2010; Bishai et al., Reference Bishai, Johns, Nair, Nabyonga-Orem, Fiona-Makmot, Simons and Dabbagh2011; Lee et al., Reference Lee, Connor, Kitchen, Bacon, Shah, Brown, Bailey, Laosiritaworn, Burke and Cummings2011; Atherly et al., Reference Atherly, Kristen, Tate, Parashar and Rheingans2012; Yin et al., Reference Yin, Asay, Zhang, Li, Zuo, Hutin and Ning2012; Tam et al., Reference Tam, Dat, Huu, Thi, Duc, Tu, Kutcher, Ryan and Kay2012; Center for Disease Control [CDC], 2021). If reliable estimates could not be found, assumptions were made based on a review of the available data. In certain cases, given the similarity in disease outcome (i.e., Hib and PCV) and a lack of antigen-specific data, it was also necessary to incorporate the same antigen-specific inputs/assumptions across different models. Where multiple disease outcomes are associated with a single antigen, separate estimates for each outcome are listed below the applicable antigen.
4.1.4. Methodology
All model costs are presented in 2020 US$ and represent the net present value at year of vaccination, calculated using the discount rates applied in the costing scenarios. Costs were adjusted to US$ 2020 through an initial conversion of all nonlocal currency unit (LCU) data to LCU, followed by an application of Consumer Price Index (CPI) growth in LCU, and then a conversion between 2020 LCU and US$ 2020 using IMF (2010) exchange rates. Costs for antigens where disease onset occurred at or before age one were not discounted and antigens with disease onset occurring past 1 year were discounted accordingly. If information was not available for a country-specific model input, a WHO region and World Bank country group-specificFootnote 1 average for the relevant parameter was calculated and applied. For parameters where cost estimates were abstracted from country-specific studies, these costs were extrapolated out to all model countries using WHO-CHOICE inpatient bed-day costs at a secondary facility as a weighting factor, as illustrated below:
 $$ {\mathrm{Cost}}_{\mathrm{country}\;\mathrm{X}}={\mathrm{Cost}}_{\mathrm{Study}\ \mathrm{country}}\times \left(\mathrm{WHO}\hbox{-} {\mathrm{CHOICE}}_{\mathrm{country}\;\mathrm{X}}/\mathrm{WHO}\hbox{-} {\mathrm{CHOICE}}_{\mathrm{Study}\ \mathrm{country}}\right). $$
Additional disease burden/epidemiological assumptions
To properly account for long-term disability and convalescence resulting from acute disease, some additional epidemiological assumptions and parameters were incorporated into the DOVE-COI models. These assumptions are listed in Table 7.
Table 7. Additional disease burden/epidemiological parameters.

Short-term costs
Treatment costs: To measure treatment costs averted that are attributable to immunization, it was necessary to determine how many vaccine-averted cases would have sought care, from where, and how much it would have cost. The number of cases that would have sought care during an illness episode was calculated by applying country- and symptom-specific care-seeking rates to total cases averted estimates provided by the health impact modeling teams (UNICEF n.d.; World Bank, 2013). Parameters for the rate of hospital admittance based on disease severity and the percentage of outpatients seeking care from hospitals were then applied to the overall number of care-seeking cases to determine the facility level at which these cases would have received care. In order to reflect the differential costs of treatment at facilities located in different areas (rural vs. urban), the number of cases seeking outpatient, health center, or hospital care was further stratified by the percentage of the population living in rural versus urban areas (World Bank, 2013). Each estimate of care-seeking cases by location and facility level was then multiplied by WHO country-specific costs of care at each facility level to estimate treatment costs (World Health Organization, n.d.-a). A diagrammatic depiction of treatment cost calculation is provided in Figure 2.
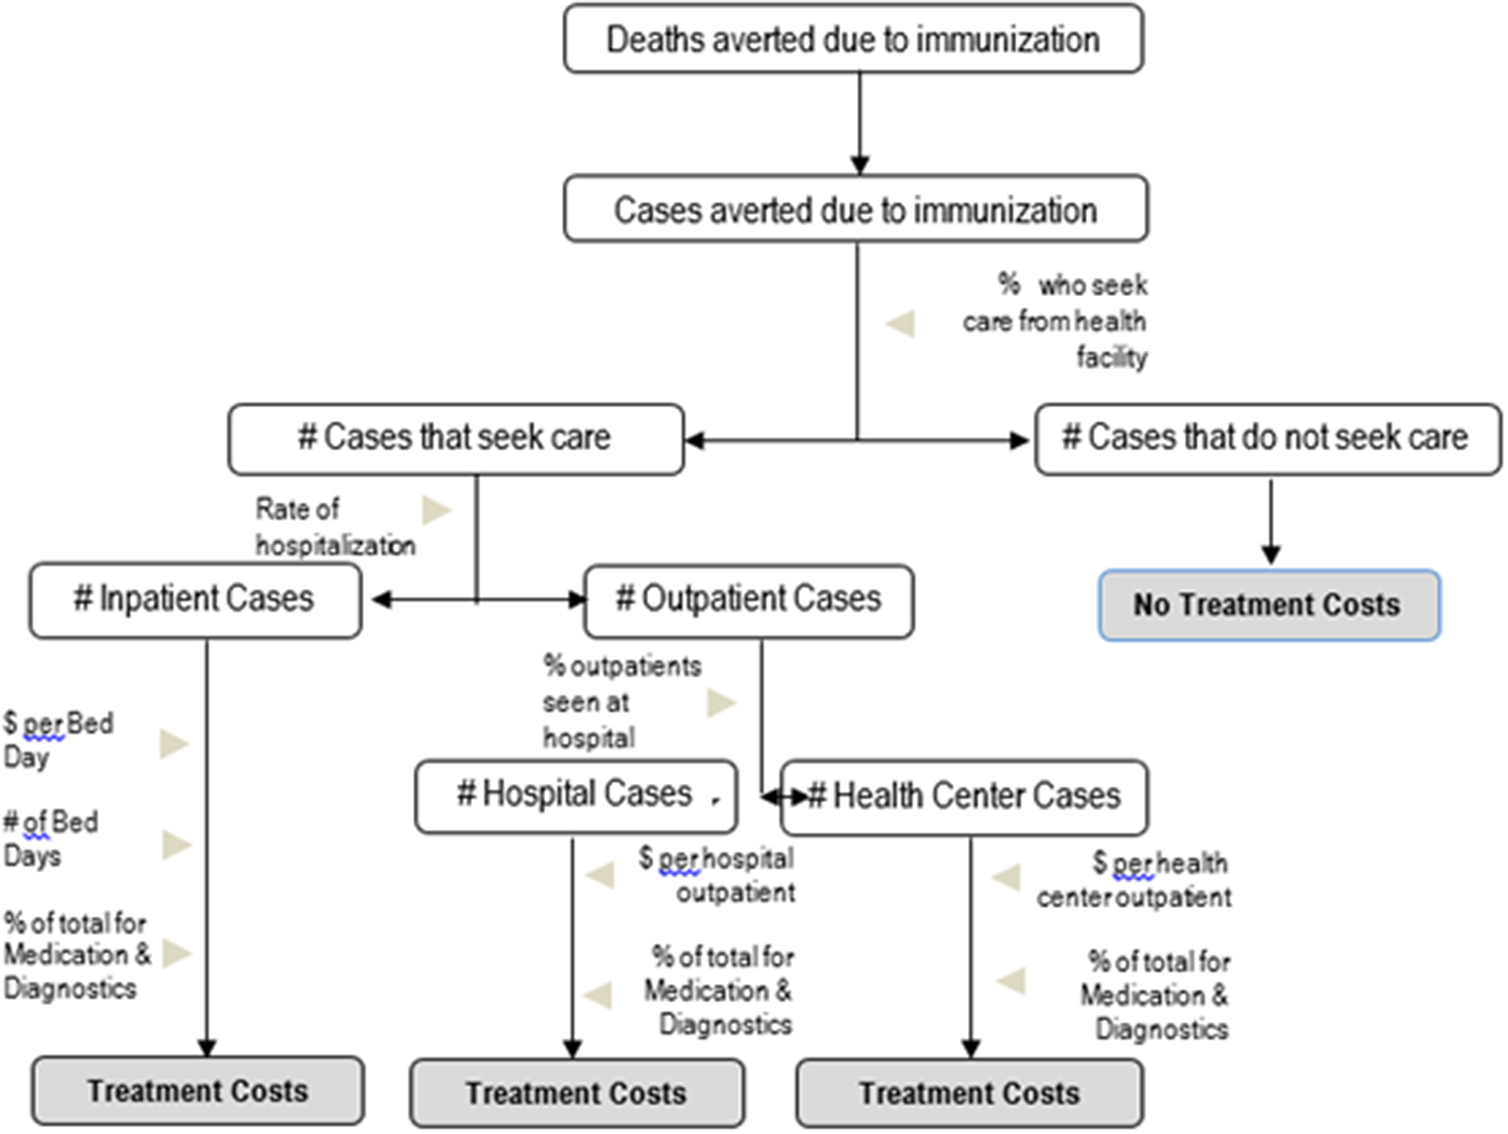
Figure 2. Decision tree model for treatment costs.
Due to wide-ranging uncertainty and a lack of available data on long-term treatment costs for the antigens modeled, only short-term acute and first-year disability treatment costs are estimated in the models. Care-seeking for children suffering from acute disease managed at the outpatient level alone was allocated one outpatient visit, regardless of the antigen (Table 8).
Table 8. Antigen-specific treatment cost assumptions.

Transportation costs: Acute illness transportation costs were estimated by applying a country-specific cost per trip to a healthcare facility (described in Table 5) to each acute outpatient visit and hospital stay (Kim et al., Reference Kim, Sweet, Slichter and Goldie2010). Long-term disability transportation costs in the first year of life were estimated using the same method, but it was assumed that these cases would require two round trips to a health facility. For antigens like hepatitis B, where disease outcomes occur later in life, transportation costs were discounted from discount rates varying from 0 to 8%, dependent on the scenario, from the year of care-seeking to the year of vaccination.
Caregiver wages: Caretaker productivity loss was calculated by multiplying an estimate of a caretaker’s daily productivity by the number of days lost due to care-seeking (hospital bed days). Given that individuals responsible for caretaking in GVAP countries may be predominantly working either in the home or employed in an informal or low-wage sector of the economy, U.S. State Department estimates of the legal minimum or lowest wage in these countries were used to approximate the value of a lost day of work (Country Reports on Human Rights Practices, 2015).
The loss of caregiver wages was only calculated for individuals seeking treatment under the age of 15, as this was the maximum age at which care-seeking would require supervision/the presence of a guardian in GVAP countries. After this age, it was assumed that care would be sought independently with no associated caretaker wage loss. For each bout of illness, we estimated that caretakers would lose 50% of one day’s wages for seeking outpatient care and 100% of their daily wage multiplied by the number of hospital bed-days per illness for hospitalized cases.
Long-term costs
A human capital approach was used to determine the economic impact of lost productivity due to disability and death under the COI scenario. For this value, we take the discounted lifetime earnings of an individual, assuming that the individual is in full health (Johannesson, Reference Johannesson1996). In the DOVE-COI models, GDP per capita was used as an analogue for the economic contribution of affected individuals in each year (Watts et al., Reference Watts, Sim, Constenla, Sriudomporn, Brenzel and Patenaude2021). We assumed that work/economic productivity began at age 15 and that labor participation was 100%.
Productivity loss due to disability: To estimate the number of productive life years lost due to disability, total cases of disability were multiplied by life expectancy at age 16 and discounted back to the year of vaccination. This discounted life expectancy was then multiplied by projected GDP per capita, calculated using the IMF’s estimated GDP per capita for the years 2011–2018 and extrapolating these estimates out for the years 2019–2020 using projected GDP per capita growth based on data from the years 2011–2018. Disability weights representing the severity (estimated on a 0–1 scale, with 1 being equivalent to death and 0 being equivalent to perfect health) of each disease outcome were then applied to adjust for the impact of illness on productivity over the duration of an individual’s life.
In cases of acute illness, the discounted duration of illness was used in place of discounted life expectancy and multiplied by the number of acute cases. Age-specific survival rates were incorporated in the calculation of productivity loss for antigens where disease onset occurred before age 15. Due to a lack of data for 15–16 year old children in many countries, we use age 15 data as a proxy for age 16 in order to calculate the number of children that would have reached productive age due to competing risks (WHO, n.d.-b).
Productivity loss due to death: The same human capital approach used to estimate productivity loss due to disability was used in the estimation of productivity loss due to premature death. Total deaths for each country were initially multiplied by the probability of survival to age 15 because we do not have this probability of survival for age 16, and then this number was multiplied by the disease-specific life expectancy at death (discounted to year of vaccination) and finally by GDP per capita.
Value of statistical life and VSLY: As an alternative to COI, a value of statistical life (VSL) approach was also adopted to estimate the economic benefits of cases and deaths averted. For these calculations, we rely upon VSL averages for LICs and LMICs, as provided by the Copenhagen Consensus Center. The VSL, derived from the marginal rate of substitution between willingness-to-pay and mortality risk reduction, represents the average value to society of reducing mortality, without respect to wage or productivity (Klose, Reference Klose1999; Viscusi, Reference Viscusi2004). In the United States, VSL is derived from both willingness-to-pay surveys and wage-risk studies. In previous applications of the Decade of Vaccines Economics (DoVE) model, VSL was allowed to vary between country and was estimated using a value-transfer, or benefits-transfer, approach as given by the following equation (Robinson et al., Reference Robinson, Hammitt, Jamison and Walker2019):
 $$ {\mathrm{VSL}}_{\mathrm{LMIC}}={\left(\frac{\mathrm{GDP}\hskip0.5em \mathrm{per}\hskip0.5em {\mathrm{capita}}_{\mathrm{LMIC}}}{\mathrm{GDP}\hskip0.5em \mathrm{per}\hskip0.5em {\mathrm{capita}}_{\mathrm{U}.\mathrm{S}.}}\right)}^{1.5}\times {\mathrm{VSL}}_{\mathrm{U}.\mathrm{S}.}. $$
This approach assumes an income elasticity of 1.5 and uses GDP per capita values for the USA and LMICs calculated using long-term growth forecasts modeled by the Institute of Health Metrics and Evaluation (IHME, 2022).
However, this report presents a VSL calculated using the standardized Copenhagen Consensus Center VSL for low- and lower-income settings ( $ {\mathrm{VSL}}_{\mathrm{LIC}/\mathrm{LMIC}\left(\mathrm{CCC}\right)}\Big) $
and applies it directly to all LMICs using the following formula:
$ {\mathrm{VSL}}_{\mathrm{LIC}/\mathrm{LMIC}\left(\mathrm{CCC}\right)}\Big) $
and applies it directly to all LMICs using the following formula:
 $$ \mathrm{Benefits}={\mathrm{VSL}}_{\mathrm{LIC}.\mathrm{LMIC}\left(\mathrm{CCC}\right)}\times {\mathrm{Deaths}\ \mathrm{averted}}_{\mathrm{LMIC}}. $$
In addition to the VSL approach, we also adopt a value of statistical life-year (VSLY) approach. VSLY is defined based on the marginal rate of substitution between willingness-to-pay and changes in life expectancy and therefore places a larger weight on the value of children’s lives, who have a greater life expectancy as compared to older adults (Kniesner & Viscusi, Reference Kniesner and Viscusi2019). In previous iterations of the DoVE model VSLY was calculated as:
 $$ \mathrm{VSLY}=\frac{\mathrm{VSL}}{\mathrm{Discounted}\ \mathrm{life}\ \mathrm{years}\ \mathrm{remaining}}. $$
For the purposes of this report, the model was adjusted to compute VSLY based on the Copenhagen Consensus Center’s standardized halftime estimates and so the $ {\mathrm{VSLY}}_{\mathrm{LMIC}\left(\mathrm{CCC}\right)} $
takes on the formula:
$ {\mathrm{VSLY}}_{\mathrm{LMIC}\left(\mathrm{CCC}\right)} $
takes on the formula:
 $$ {\mathrm{VSL}\mathrm{Y}}_{\mathrm{LIC}/\mathrm{LMIC}\left(\mathrm{CCC}\right)}=\frac{{\mathrm{VSL}}_{\mathrm{LIC}/\mathrm{LMIC}\left(\mathrm{CCC}\right)}}{0.5\times \mathrm{Life}\ \mathrm{expectancy}\hskip0.5em \mathrm{at}\hskip0.5em {\mathrm{birth}}_{\mathrm{LIC}/\mathrm{LMIC}}}. $$
Similarly to the total VSL impact, that of VSLY is calculated by multiplying the VSLY for LMICs by the total number of life years averted:
 $$ \mathrm{Benefits}={\mathrm{VSLY}}_{\mathrm{LIC}/\mathrm{LMIC}\left(\mathrm{CCC}\right)}\times \mathrm{Life}\hskip0.5em {\mathrm{years}\ \mathrm{averted}}_{\frac{\mathrm{LIC}}{\mathrm{LMIC}}}. $$
Scenario analysis: Under the base-case scenario, we produced estimates for economic benefits using an 8% discount rate. This scenario is presented as the primary results. We also conducted additional analyses for discount rates of 0 and 3%.
In addition, we estimated the incremental benefits of achieving 2030 target by taking the difference between the total economic benefits of achieving 2030 targets and the benefits of immunization programs assuming the level of cases and deaths averted in 2022 were held constant over time.
In total, 12 benefit estimation scenarios were conducted:
-
(i) The total COI of immunization programs (discounted at 8%).
-
(ii) The total COI of immunization programs (discounted at 3%).
-
(iii) The total COI of immunization programs (undiscounted).
-
(iv) The total VSL of immunization programs (discounted at 8%).
-
(v) The total VSL of immunization programs (discounted at 3%).
-
(vi) The total VSL of immunization programs (undiscounted).
-
(vii) The total VSLY of immunization programs (discounted at 8%).
-
(viii) The total VSLY of immunization programs (discounted at 3%).
-
(ix) The total VSLY of immunization programs (undiscounted).
-
(x) Incremental benefit of achieving 2030 target at halftime compared to 2022 level through the COI approach.
-
(xi) Incremental benefit of achieving 2030 target at halftime compared to 2022 level through the VSL approach.
-
(xii) Incremental benefit of achieving 2030 target at halftime compared to 2022 level through the VSLY approach.
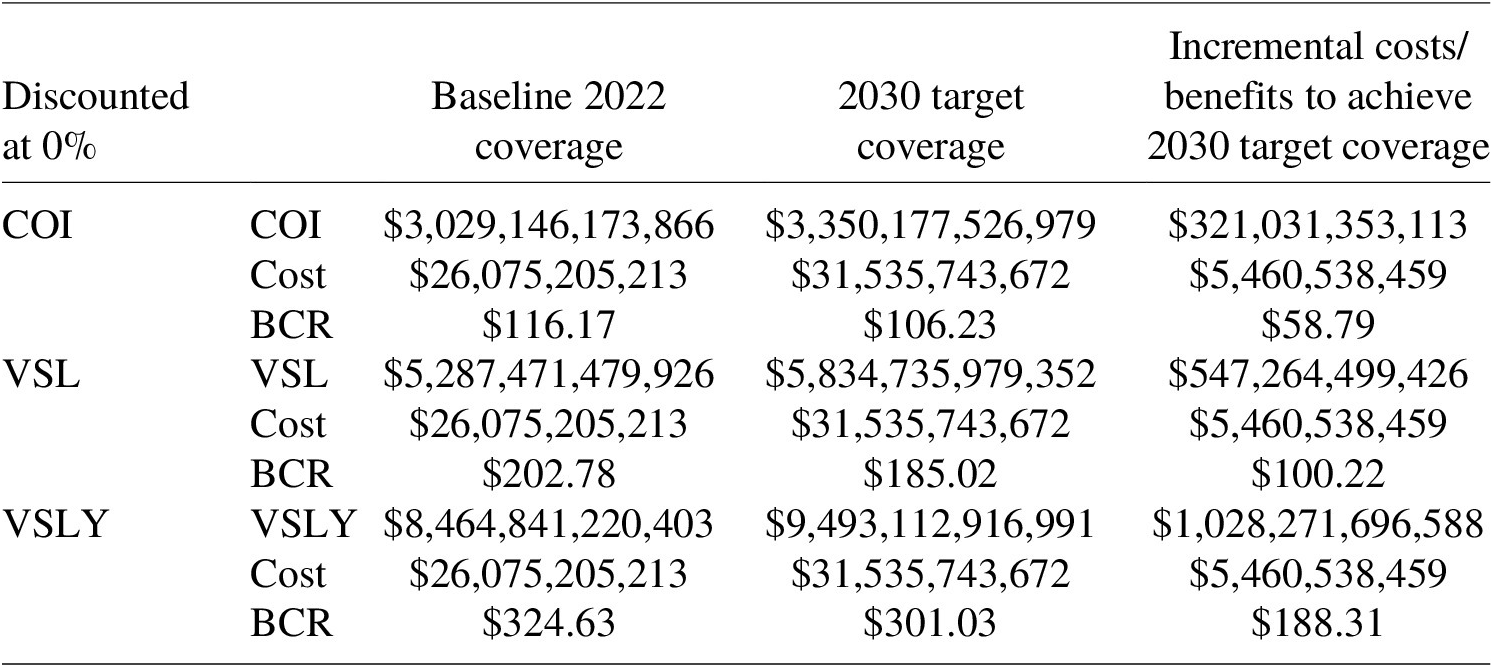
4.1.5. BCR
The BCR compares the present value of all benefits with that of the costs and investments in the immunization program. This is shown in the following equation:
 $$ \mathrm{BCR}=\frac{\mathrm{PV}\hskip0.5em \mathrm{benefits}}{\mathrm{PV}\hskip0.5em \mathrm{costs}}, $$
where PV benefits, present value of benefits and PV costs, present value of cost.
Please note that while the DOVE programmatic costing model accommodates BCG and TCV vaccines, these vaccine antigens are absent from the benefits model as their health impacts have yet to be estimated. Therefore, the costs of BCG and TCV vaccination programs are presented separately in Section 5.
5. Results
5.1. Economic benefits: COI
Through the COI approach, the total economic benefits of vaccines in 80 LICs and LMICs were projected to exceed US$ 254 billion from 2023 to 2030, assuming a discount rate of 8%. The largest share of economic benefits from vaccination is owed to productivity loss due to deaths averted, accounting for 93.7% of the total benefits. Productivity loss due to disability averted comprises the second most influential component, responsible for 4.5% of the estimated economic benefits (Tables 9 and 10).
Table 9. Total COI averted (2020 US$) from vaccination programs for 2023–2030, using VIMC health impact estimates.

Note: These are total impacts for vaccines administered in the indicated year in US$.
Table 10. Incremental COI (2020 US$) averted from vaccination programs for 2023–2030, comparing estimates from Table 8 to base case COI assuming constant VIMC health impact estimates from 2022 for all years.

Note: These are total impacts for vaccines administered in the indicated year in US$.
5.2. Economic benefits: VSL/VSLY
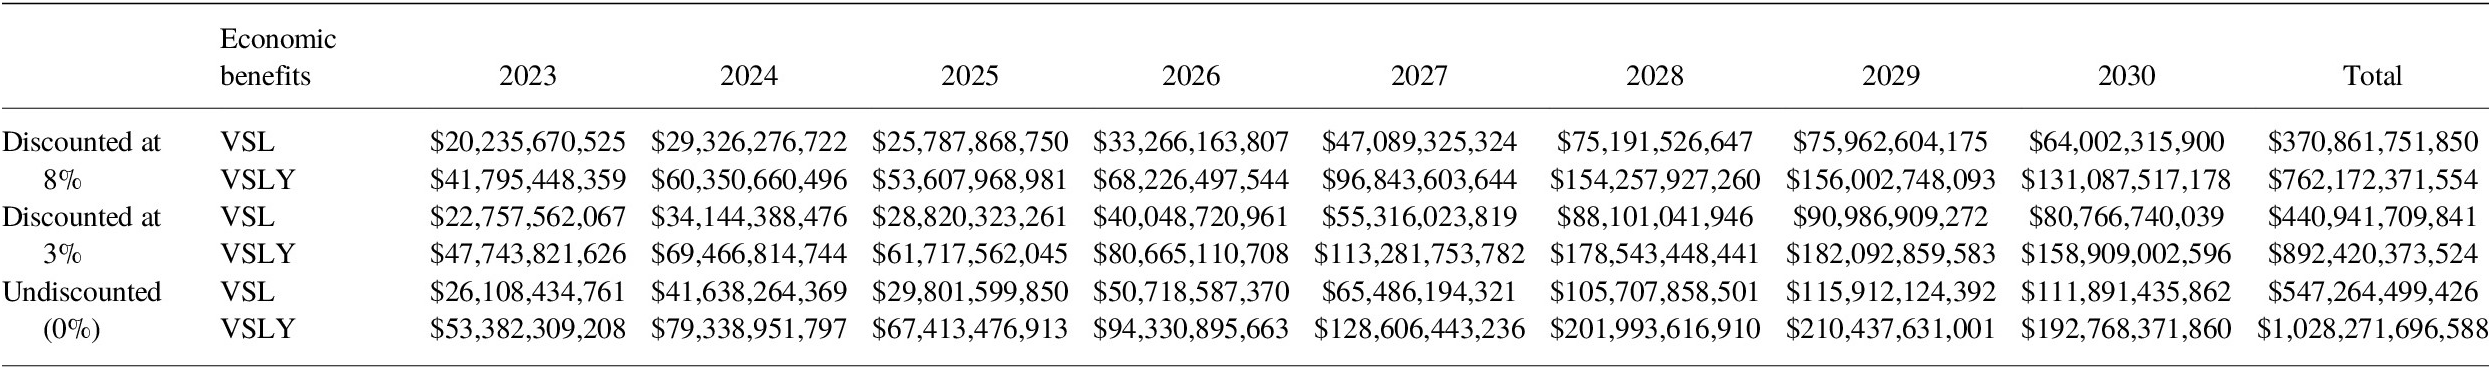
Using a discount rate of 8%, total economic benefits of vaccination for all pathogens for 2023–2030 via the VSL approach for all 80 countries totals over US$ 2.8 trillion. When applying the same parameters for the VSLY method, the benefits of vaccination are nearly US$ 5.7 trillion (Tables 11 and 12).
Table 11. Total economic benefits (2020 US$) using VSL and VSLY from vaccination programs for 2023–2030, using VIMC health impact estimates.

Note: These are total impacts for vaccines administered in the indicated year in US$.
Table 12. Incremental economic benefits (2020 USD) from VSL and VSLY from vaccination programs for 2023–2030, comparing estimates from Table 9 to base case COI assuming constant VIMC death impact estimates from 2022 for all years.
Note: These are total impacts for vaccines administered in the indicated year in US$.
5.3. Immunization program costs
Under the base assumption of an 8% discount rate, the total programmatic costs of vaccination in 80 LICs and LMICs from 2023 to 2030 were estimated to be US$ 20.9 billion (see Table 13). Immunization delivery costs accounted for the greatest proportion of future total immunization program costs at 56.6%, with vaccine costs comprising the remaining costs 43.4% of costs.
Table 13. Total immunization program costing (2020 US$) for 2023–2030 (95% CI).
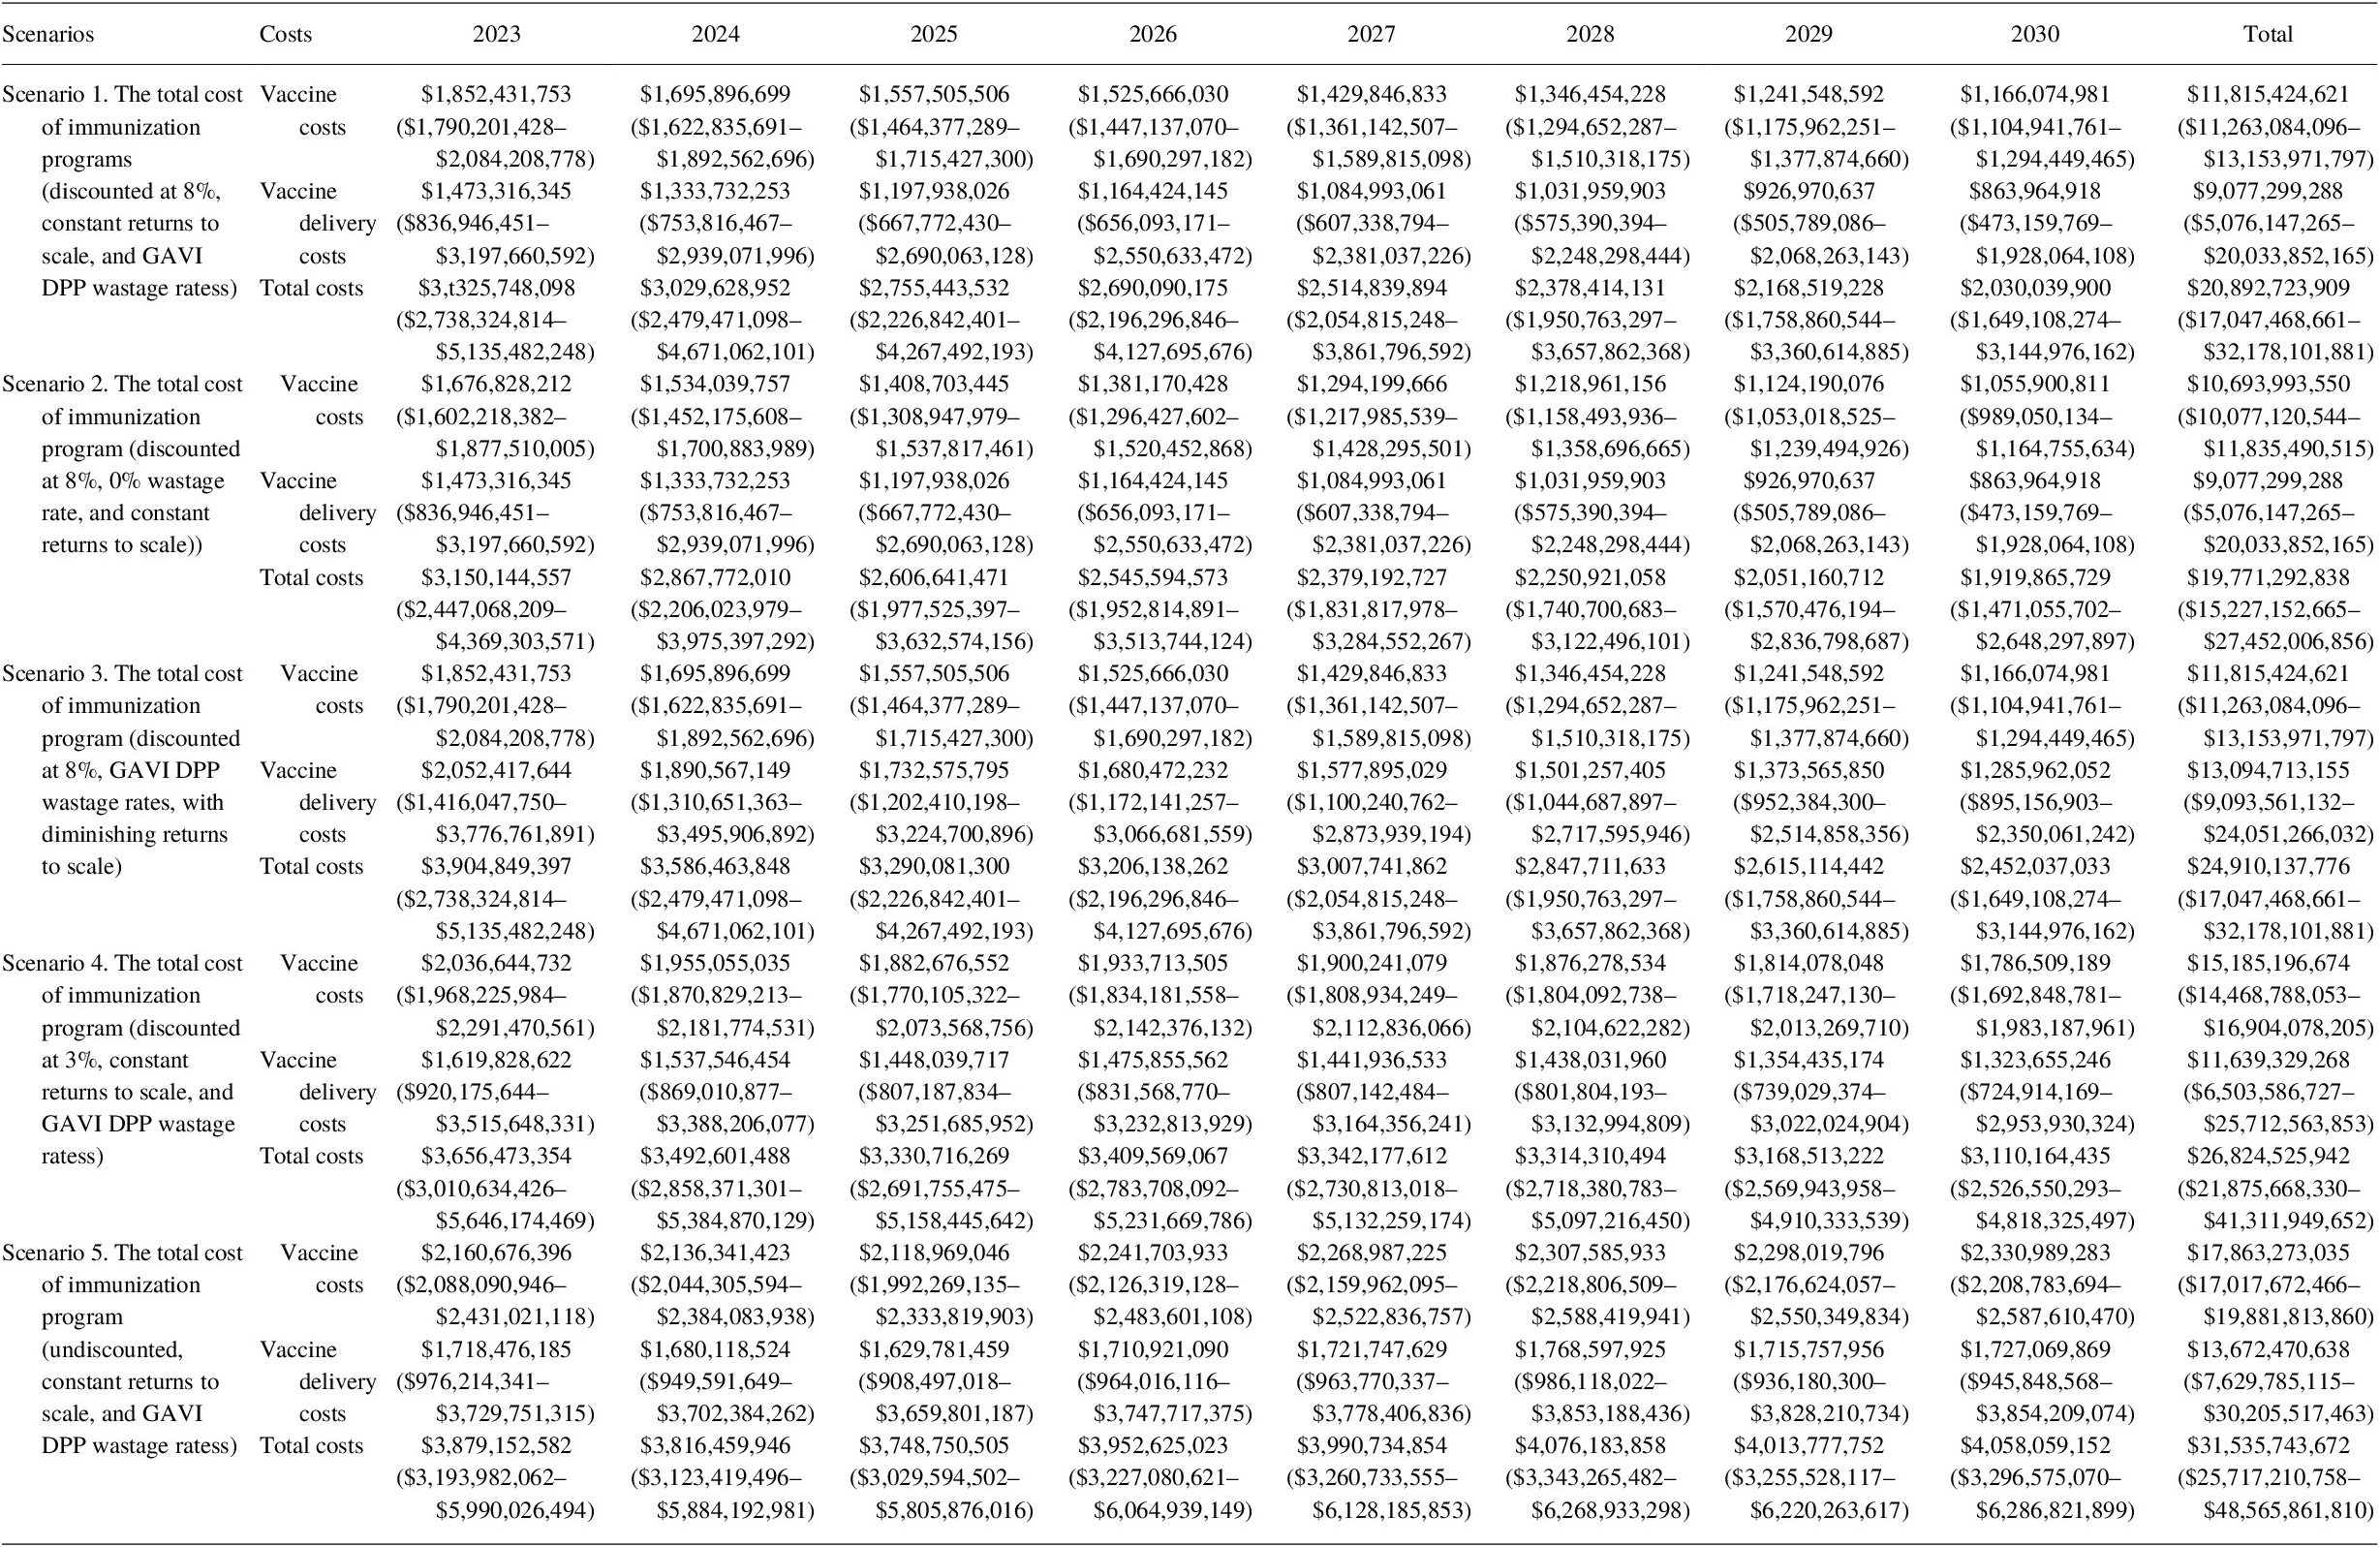
We estimated that under a diminishing returns to scale scenario, delivery costs increased by US$ 24.9 billion (19.2%) over the period of 2023–2030. Under the 0% wastage rate scenario, the total vaccine costs decreased by US$ 1.1 billion (9.5%). The results for the different discount rate scenarios are presented annually in Table 13.
Incremental cost calculations show that the costing gap of achieving 2030 target coverage rates for routine immunization compared to the 2022 coverage level is significant. Under constant returns to scale with an 8% discount rate, the incremental costs were estimated at US$ 2.3 billion for vaccines and US$ 1.3 billion for immunization delivery (see Table 14). In other words, it would cost a total of US$ 3.6 billion to reach the 2030 target.
Table 14. Incremental cost (2020 US$) of immunization programs for 2023–2030 to achieve 2030 target coverage under constant and diminishing returns to scale scenario.
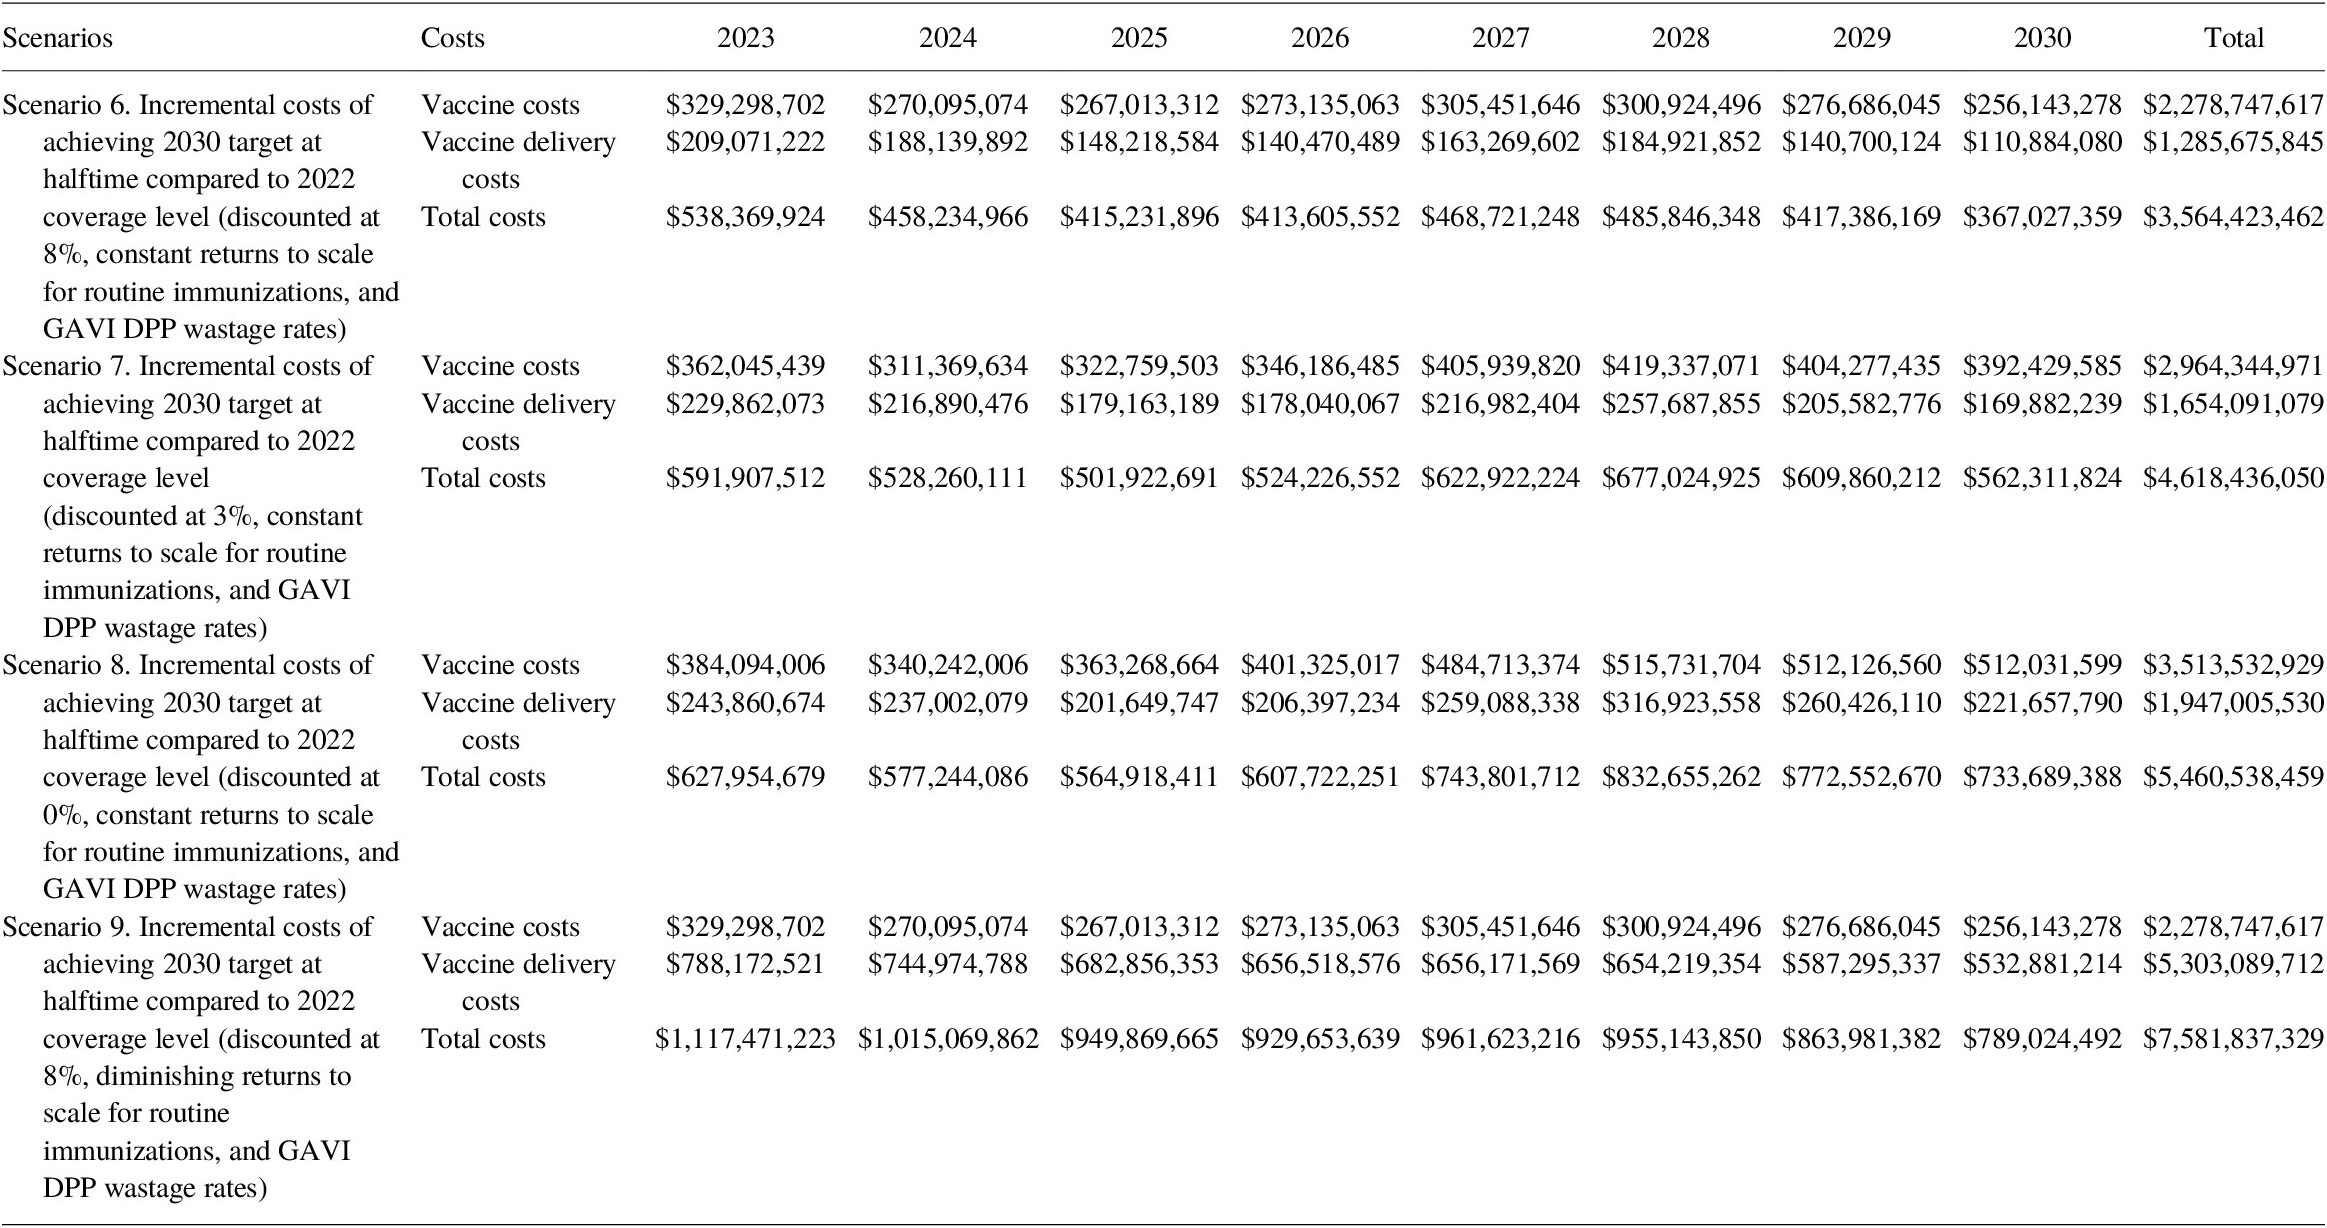
For the diminishing returns to scale scenario with 8% discounted rate, an additional US$ 7.6 billion is needed to reach the 2030 target (US$ 2.3 billion for vaccines and US$ 5.3 billion for immunization delivery, an increase of US$ 4.0 billionFootnote 2 compared to constant returns to scale).
5.3.1. BCG and TCV vaccine costs
Per Copenhagen Consensus Center request, we also estimated the vaccine-specific commodities and delivery costs for Bacille Calmette-Guérin vaccine (BCG) and typhoid conjugated vaccine (TCV). Note that the costs associated with BCG and TCV are omitted from the BCR calculation as benefits models for these two vaccines are still under production. Under the base-case scenario with an 8% discount rate, the cost of BCG and TCV programs would add an additional US$ 3.85 billion to the total vaccination costs between 2023 and 2030 (Tables 15 and 16).
Table 15. Total BCG vaccine costing (2020 US$, routine only) for 2023–2030.
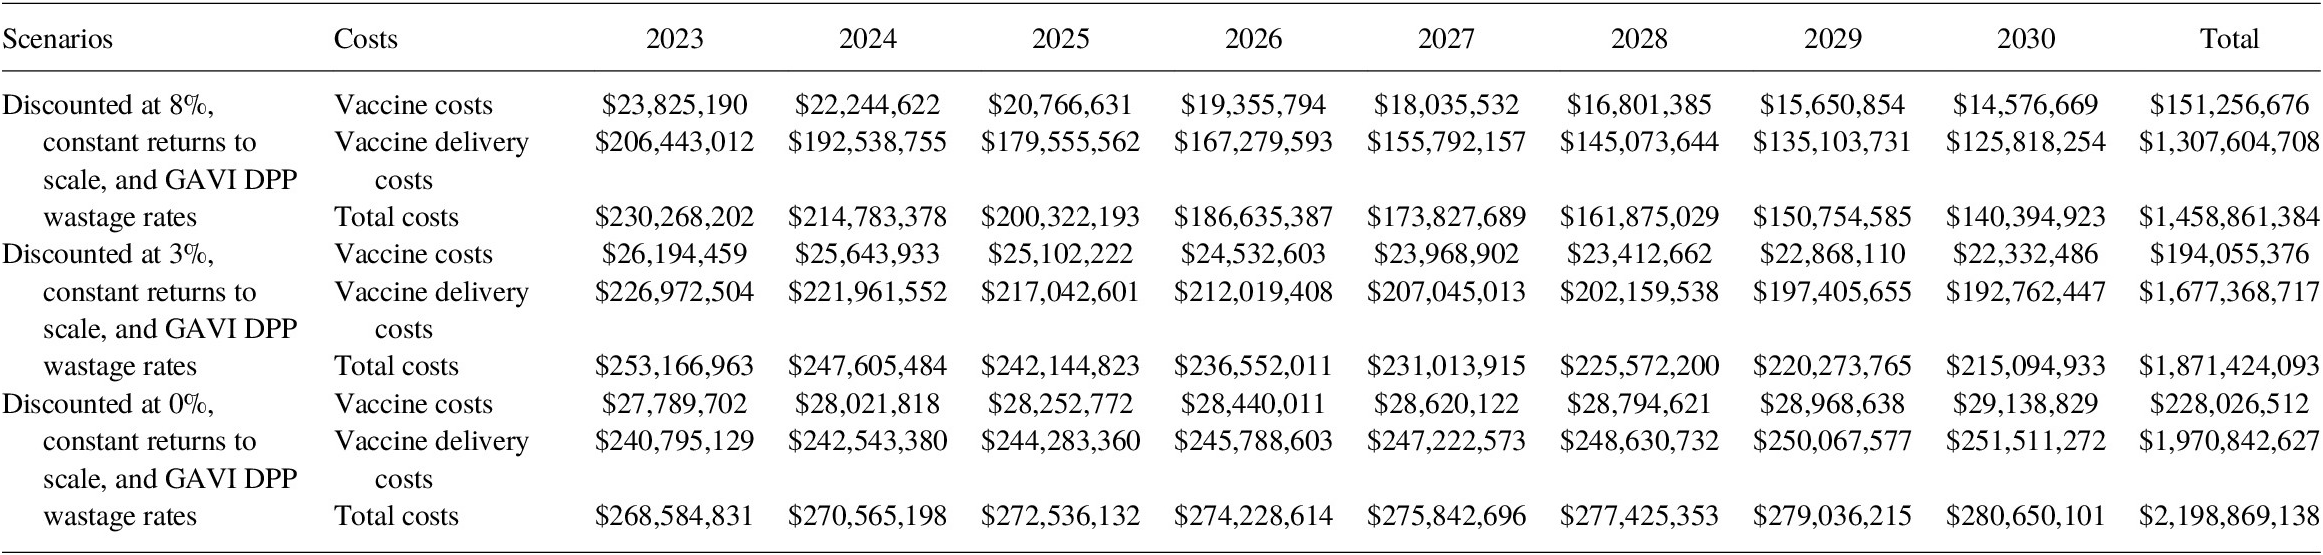
Table 16. Total TCV vaccine costing (2020 US$, routine and SIA) for 2023–2030.

5.3.2. BCR
Using the economic benefits and costing scenarios generated above, we calculated 3 BCR estimates through the COI, VSL, and VSLY approaches. At baseline, with an 8% discount rate, the BCR for attaining 2030 target coverage was estimated at 13.12 (8.20–16.40) through the COI approach, 143.27 (89.60–179.12) through the VSL approach, and 286.12(178.95–357.72) through the VSLY approach. The incremental BCR of attaining 2030 targets was under an assumption of diminishing returns was 3.58, 48.91, and 100.53 for the COI, VSL, and VSLY approaches, respectively (Tables 17–19).
Table 17. BCR using the COI, VSL, and VSLY approach at 8% discounted rate using 2020 US$, 2023–2030 (95% CI only available for the primary results).

Table 18. BCR using the COI, VSL and VSLY approach at 3% discounted rate using 2020 US$, 2023–2030.

Table 19. BCR using the COI, VSL and VSLY approach at 0% discounted rate using 2020 US$, 2023–2030.
5.3.3. Additional scenarios
6. Conclusions
A general upward trend in total immunization program costs between 2023 and 2030 is observed in undiscounted scenarios and can be explained by changes over time in the number of doses, vaccine prices, and additional delivery costs for new vaccines. However, this increasing total cost is offset when an 8% discount rate is applied. The projection method adopted from GAVI’s operational forecast also leads to an increasing number of routine doses administered for all vaccines over the time horizon as a result of population growth and increasing overall coverage. In addition, it is also projected that more countries will introduce newer vaccines (e.g., for HPV, PCV, and rotavirus) between 2023 and 2030. These newer vaccines are more expensive than other existing vaccines and require additional introduction costs. Similarly, our models predict that total economic benefits from vaccination will remain relatively constant over time under an 8% discounting scenario, but generally increase over the time horizon as lower discount rates are applied. This is primarily a result of increases in coverage as well as new vaccine introduction.
Overall, benefits and costs are comparable to previous studies estimating the economic benefits and costs of immunization programs over time using the COI and VSL approaches, once discount rates are used (Stack et al., Reference Stack, Ozawa, Bishai, Mirelman, Tam, Niessen, Walker and Levine2011; Portnoy et al., Reference Portnoy, Ozawa, Grewal, Norman, Rajgopal, Gorham, Haidari, Brown and Lee2015; Ozawa et al., Reference Ozawa, Clark, Portnoy, Grewal, Brenzel and Walker2016; Sim et al., Reference Sim, Watts, Constenla, Brenzel and Patenaude2020). The VSLY approach, however, generates benefit estimates exceeding other studies after correcting for discount rate differences. Overall, the 8% discount rate employed in the base case is significantly higher than the maximum rates employed by all other immunization studies, making the benefits and costs assessed under this scenario significantly lower in magnitude than those estimated in other studies. There are significant benefits to examining the impact under all three benefits estimation approaches because while adopting a VSL approach treats all lives equally, VSLY accounts for differences in the age of mortality impact thereby making the assumption that all life years are treated equally.
The global BCR estimates from this study are large ranging from 12.18 to 273.79 and can inform decision-makers of funding agencies as they prioritize investments across the SDGs as well as contribute to resource mobilization efforts for immunization programs in order to reach the goals set by the global community as part of SDGs.
Acknowledgments
The authors would like to thank A. Portnoy of Harvard University, L. Watts of Johns Hopkins University, S. Y. Sim of World Health Organization, K. Gaythorpe of Imperial College London, and B. Lomborg of Copenhagen Consensus Center for their valuable comments that supported this analysis. All responsibility for the content remains with the authors.


 Open access