


Introduction
Auditory speech signals provide listeners with cues to many aspects of a talker’s identity, including dimensions such as race, gender, age, and region of origin (Fuertes et al., Reference Fuertes, Gottdiener, Martin, Gilbert and Giles2012; Lavan, Reference Lavan2023; Niedzielski, Reference Niedzielski1999). One of the most salient indexical dimensions of speech for adults is the presence and strength of a non-local accent (Atagi & Bent, Reference Atagi and Bent2013; Clopper & Pisoni, Reference Clopper and Pisoni2007). Adapting to speakers with a wide range of accents is essential for successful communication in daily life (Johnson et al., Reference Johnson, van Heugten and Buckler2022). Further, strong social preferences for speakers who “sound like us” begin at the earliest stages of life (Kinzler, Reference Kinzler2021). Sensitivity to accents begins in infancy. As early as five months, infants can perceptually discriminate between their own regional accent and other varieties of their first acquired language (i.e., L1; Butler et al., Reference Butler, Floccia, Goslin and Panneton2011; Nazzi et al., Reference Nazzi, Jusczyk and Johnson2000). At six months of age, infants display social preferences for linguistic in-group members who speak with a familiar accent over out-group members speaking an unfamiliar language or with an accent in their second language (i.e., L2; Kinzler et al., Reference Kinzler, Dupoux and Spelke2007). These accent sensitivities and attentional biases toward in-group members in the first year of life are influenced by language experience and accent familiarity (Kitamura et al., Reference Kitamura, Panneton and Best2013).
The literature on infants and toddlers has highlighted how accent preferences and processing skills emerge in the first years of life (Johnson et al., Reference Johnson, van Heugten and Buckler2022). However, work with older children suggests that both the linguistic and sociolinguistic processing of unfamiliar accents may show a protracted developmental trajectory with adult-like performance being achieved in adolescence (e.g., Bent, Reference Bent2018; Jones et al., Reference Jones, Yan, Wagner and Clopper2017; McCullough et al., Reference McCullough, Clopper and Wagner2019b). For example, Wagner et al. (Reference Wagner, Clopper and Pate2014) found that when presented with a forced-choice binary categorization task in which a local accent was contrasted with L1 and L2 variants, five- and six-year-old children could categorize talkers with their own accent (Midland American English) when compared to an L2 accent (Maharashtran Indian English) but not when their home accent was compared to another L1 accent (British English). Similar results were observed for British English children who could distinguish French-accented English from their home dialect but had difficulty when their home accent was contrasted with an Irish English accent (Floccia et al., Reference Floccia, Butler, Girard and Goslin2009). Likewise, French speaking children could distinguish L2 English-accented French from L1 French but could not distinguish Northern and Southern regional French varieties (Girard et al., Reference Girard, Floccia and Goslin2008). The speech of L2 talkers may be more distant from the listener’s own accent, containing a greater number of differences compared to a more local variety, causing poorer recognition (Cooper et al., Reference Cooper, Paquette-Smith, Bordignon and Johnson2022). These differences may be more salient, helping children to perform more accurately in classification of unfamiliar L2 varieties than with unfamiliar L1 varieties. The tasks used in these studies, which demonstrated a lack of sensitivity to different L1 language variants, required children to follow complex task instructions to categorize accents in either local and L1 or local and L2 contrasts (e.g., to press the red key when a specific variety was heard in a binary categorization task [Girard et al., Reference Girard, Floccia and Goslin2008]). Children have shown greater sensitivity to L1 accent variation in tasks in which they were not required to explicitly categorize accents. In tasks using more implicit measures, such as when accents were paired with cultural objects (i.e., clothes and home structures), children correctly identified more L1 speakers than speakers with L2 accents (Wagner et al., Reference Wagner, Clopper and Pate2014). Similarly, utilizing a free classification paradigm, Jones et al. (Reference Jones, Yan, Wagner and Clopper2017) found that when children grouped talkers based on their accent or where they were from in the United States, even the youngest listeners they tested, four- to five-year-olds, showed some sensitivity to differences among regional American English accents. Specifically, children in the Midland American region separated talkers representing a geographically more distant regional accent (New England) from talkers from three other more proximal regional American English accents (Midland, Northern, and Southern). The ability to distinguish the New England accent from the other geographically closer accents could have been driven by specific pronunciation features, like r-lessness, that may have been salient to even the youngest children in the study.
Although younger children showed some awareness of regional accent variation, more fine-tuned sensitivity is not fully developed until later stages of childhood. In dialect classification tasks, children show increases in accuracy throughout middle and late childhood, with adult-like performance emerging in the late teenage years (15-16 years of age; Jones et al., Reference Jones, Yan, Wagner and Clopper2017). Whereas, in a locality judgment task in which children rated four regional varieties of American English, ceiling performance was reached in much younger listeners. Children rated locality using a bipolar scale with endpoints ranging from “very much like she’s from Ohio” to “not at all like she’s from Ohio.” Children accurately rated locality by six to seven years of age and exhibited adult-like performance by eight-years-old (McCullough et al., Reference McCullough, Clopper and Wagner2019b), indicating that some accent classification abilities may be in place as early as middle childhood. While these studies provided evidence of accent categorization abilities among multiple L1 regional varieties, there is less research investigating how children classify L2 varieties of English.
In contrast to much of the literature on children’s accent perception, a substantial body of work suggests that, ultimately, adults can accurately identify locality, classify, and group both L1 and L2 variants of their language (Alcorn et al., Reference Alcorn, Meemann, Clopper and Smiljanic2020; Bent et al., Reference Bent, Atagi, Akbik and Bonifield2016; Clopper & Pisoni, Reference Clopper and Pisoni2007). Accent knowledge guides adult listeners’ social preferences as well as judgments of trustworthiness and societal status (Hendriks et al., Reference Hendriks, van Meurs and de Groot2017; Ryan et al., Reference Ryan, Carranza and Moffie1977). Similar to adults, even young children utilize knowledge of accents to make a variety of social judgments. As early as five years of age, children prefer to be friends with peers who “speak like them,” indicating that these sociolinguistic biases likely emerge early in development (Kinzler et al., Reference Kinzler, Dupoux and Spelke2007, Reference Kinzler, Shutts, DeJesus and Spelke2009). Frequent exposure to non-local accents does not appear to modulate these preferences, as even children who were living in a culturally and linguistically diverse city still preferred their local accent over non-local L1 and L2 varieties (Paquette-Smith et al., Reference Paquette-Smith, Buckler, White, Choi and Johnson2019). Furthermore, accent may be more influential than other indexical characteristics, such as race, in guiding social preferences (Cohen et al., Reference Cohen, van Leeuwen, Barbosa and Haun2021; Kinzler et al., Reference Kinzler, Shutts, DeJesus and Spelke2009). Work on selective trustworthiness, in which young children were asked whose testimony about the function of an object to believe, indicates that children prefer learning from speakers with L1 accents than those with L2 accents (Kertesz et al., Reference Kertesz, Alvarez, Afraymovich and Sullivan2021). Children between 10 and 12 years of age also give higher status ratings to L1 over L2 talkers on the basis of accent strength when uncertain of a talker’s ethnicity group (Nesdale & Rooney, Reference Nesdale and Rooney1996). These results suggest that accent plays a significant role in sociolinguistic development. Social preferences that begin early in infancy progress throughout development, ultimately resulting in wide ranging social consequences for speakers of L1 varieties of English and especially L2 speakers. Understanding how accent strength is perceived as well as the phonetic and acoustic cues that guide these perceptions for a wide range of L1 and L2 varieties is critical given the strong social impacts found in prior literature.
Perception of accent strength
In addition to the mere presence of a non-local accent, the strength of an accent can influence a variety of social judgments in both adults and children including social preference, status and solidarity ratings, and trustworthiness (Kertesz et al., Reference Kertesz, Alvarez, Afraymovich and Sullivan2021; Nesdale & Rooney, Reference Nesdale and Rooney1996; Paquette-Smith et al., Reference Paquette-Smith, Buckler, White, Choi and Johnson2019; Ryan et al., Reference Ryan, Carranza and Moffie1977). Studies examining accent strength differ from previously mentioned categorization and classification tasks as their aim is to elicit listener’s perceptions of the relative degree of difference between accents, rather than indicating a preference or grouping talkers. While perception of accent strength has been well-documented in adults (Anderson-Hsieh et al., Reference Anderson-Hsieh, Johnson and Koehler1992; Riney et al., Reference Riney, Takagi and Inutsuka2005), far less is known about young children’s sensitivity to the strength of L1 or L2 accents. With insufficient broad-based evidence of children’s accent strength perception across multiple L1 and L2 varieties, studies such as the one presented here are crucial to better understand how children perceive how accented a speaker is, especially given the impact of accent strength on social preferences previously demonstrated.
One study provided evidence of young children’s sensitivity to accent strength (Weatherhead et al., Reference Weatherhead, Friedman and White2019). In their study of perceived accent distance, four- and five-year-old Canadian children were provided with a blank map of the United States with an “x” in the upper left of the map and were asked to judge the locality of a talker by placing an “x” on the map to indicate where the talker was from (i.e., “lives in”). Results suggested that four-year-olds did not show a difference between accents when making distance judgments, but five-year-olds distinguished between stronger and weaker accents. This study provided initial evidence of children’s ability to determine accent strength of L1 and L2 accents. However, the design did not allow for direct comparisons among accents, as a new map was used for each speaker. Furthermore, the task cannot be used with older children or adults who possess more geographical knowledge. The task used in this study addresses this limitation as it can be used by listeners from a wider age range. Further, listeners are able to freely and directly compare stimuli similarly to free classification tasks.
Objective pronunciation distance measures
Previous work on children’s perception of accents has characterized differences among the stimulus accents by using metrics such as Likert-style accentedness ratings or acoustic measurements of vowels or consonant features typically attributed to certain regional varieties (Floccia et al., Reference Floccia, Butler, Girard and Goslin2009; McCullough et al., Reference McCullough, Clopper and Wagner2019a, Reference McCullough, Clopper and Wagner2019b). While a variety of tasks have been used to elicit perceptions of accent in young children, few studies have compared children’s judgments to objective measures of pronunciation distance. Incorporating holistic pronunciation distance measurements that have been used in comparison to adults’ perceptual ratings of accent strength may provide additional insight into the impact of specific acoustic and phonetic variation on children’s perception of accent strength. In the current study, objective pronunciation distance metrics are used to estimate an accent’s distance from a referent accent. These objective distance measures can be useful in predicting what cues children are extracting from the speech signal to make perceptual judgments, as they quantify how distance from a referent relates to judgements of accent strength.
The Levenshtein Distance algorithm (Levenshtein, Reference Levenshtein1966) has been used historically as a valid measure of segmental pronunciation distance because it provides an objective value for how divergent a production may be from a given referent (Gooskens & Heeringa, Reference Gooskens and Heeringa2004; Gooskens et al., Reference Gooskens, Heeringa and Beijering2008). The Levenshtein Distance algorithm measures the difference between phonetic representations of a stimulus and a referent, with higher Levenshtein Distance indicating a greater segmental difference between a given stimulus and the referent accent. In the traditional Levenshtein measurement, each difference between the pronunciations receives an equal penalty (e.g., vowel substitutions and consonant substitutions are given equal weight). More recently a “weighted” version of Levenshtein Distance has been used to make predictions about intelligibility across accent varieties for child and adult listeners (Bent et al., Reference Bent, Holt, Van Engen, Jamsek, Arzbecker, Liang and Brown2021; Levy et al., Reference Levy, Konieczny and Hanulíková2019). The weights in the formula were developed to account for findings that certain pronunciation differences impact accent perception more than others. For example, a consonant substitution impacts accent perception more than a vowel substitution, resulting in a heavier weighting on consonant substitutions (Gao, Reference Gao2019). Levenshtein Distance has been strongly correlated with perception of accent strength in adults (Gooskens & Heeringa, Reference Gooskens and Heeringa2004; Wieling et al., Reference Wieling, Bloem, Mignella, Timmermeister and Nerbonne2014); however, because it only accounts for phonetic differences, it does not capture phonetic (sub-segmental) or prosodic (suprasegmental) variation.
In addition to phonetic information, prosodic cues including aspects such as rhythm, rate, and intonation, may also impact accent perception. There are contrasting results regarding how prosody influences adult listeners’ perceptual ratings of accent strength. Studies with both L1 and L2 accents have found that listeners use prosodic changes to identify accents and to make judgments of locality and accent strength (Anderson-Hsieh et al., Reference Anderson-Hsieh, Johnson and Koehler1992; Clopper & Smiljanic, Reference Clopper and Smiljanic2011; Gooskens, Reference Gooskens2005). Other work suggests that prosodic differences present in L2 accented speech influenced intelligibility ratings but do not impact accentedness ratings (Sereno et al., Reference Sereno, Lammers and Jongman2016). For regional dialect classification within the U.S., segmental information outweighs the importance of prosodic information (Alcorn et al., Reference Alcorn, Meemann, Clopper and Smiljanic2020).
Speaking rate is an example of a specific durational cue that has been shown to affect listeners’ judgments of accent strength (Bent et al., Reference Bent, Atagi, Akbik and Bonifield2016; Clopper & Smiljanic, Reference Clopper and Smiljanic2011; Munro & Derwing, Reference Munro and Derwing2001). Speaking rate has been hypothesized to explain children’s differentiation of L1 and L2 accents (Weatherhead et al., Reference Weatherhead, Friedman and White2019), although no direct evidence of this link has been found. There is evidence that speaking rate alone does not account for listeners’ judgments of accentedness (Munro et al., Reference Munro, Derwing and Burgess2010). Rather, accent strength judgments incorporate numerous cues encompassed by the speech signal.
Although previous studies have incorporated both segmental and suprasegmental measures of accent distance, recent work has explored the utility of Dynamic Time Warping (DTW) for examining accent perception (Bartelds et al., Reference Bartelds, Richter, Liberman and Wieling2020), which provides a holistic acoustic measure that encapsulates both segmental and suprasegmental information. Historically, this measure has been used for analyzing time series data for artificial intelligence applications such as speech recognition (Berndt & Clifford, Reference Berndt and Clifford1994). More recently, DTW has been used as a holistic acoustic-based measure of accent distance in accent perception research, quantifying the distance between two speech signals (Bartelds et al., Reference Bartelds, Richter, Liberman and Wieling2020). DTW is a procedure that optimizes the alignment of feature representations of two acoustic signals and calculates the shortest path to alignment through a cost matrix, producing a distance score (see Bartelds et al., Reference Bartelds, Richter, Liberman and Wieling2020).
Bartelds et al. (Reference Bartelds, Richter, Liberman and Wieling2020) compared human judgments of accentedness with DTW Scores as well as Levenshtein Distance scores. Results suggested that both the transcription-based measure and the acoustic-based measure contributed significantly to model fit. Importantly, the authors found that DTW captures information in the signal that fails to be accounted for by phonetic transcription alone. The authors demonstrated that DTW captured intonation and timing differences, which result in larger distance scores. The additional explanatory power of DTW expands the evaluation of what contributes to children’s perception of accent strength beyond segmental cues. While Bartelds et al.’s (Reference Bartelds, Richter, Liberman and Wieling2020) investigation yielded significant insight into the cues that are used by adults to make perceptual judgments of accent strength, fewer investigations have incorporated these pronunciation distance measures in pediatric research. There is evidence that children use prosodic information when distinguishing among accents, as seen with children’s perception of low-pass filtered speech, which renders utterances incomprehensible while retaining the overall envelope of the speech waveform (Weatherhead et al., Reference Weatherhead, Friedman and White2019). Children perceived accent strength in the absence of fine spectral detail contained in the segments, which suggests that segmental measures alone may not account for how accent strength is evaluated. This finding warrants further investigation of acoustic-based correlates of accent strength among children and further motivates the inclusion of two measures that capture prosodic information in the present study (e.g., DTW and speaking rate).
Current study
Although accent strength is an important social cue for adult listeners, there are only a few studies that have investigated how this perceptual cue develops in childhood. These studies have explored younger children’s perception of accent strength, but there is less evidence of how accent strength is perceived by older children in early adolescence or how children’s perceptions compare to those of adults. Moreover, the lack of literature comparing children’s perception of accent to objective measures of pronunciation distance leaves open the question of what cues children employ to make their accent judgments. To address these gaps, six- and twelve-year-old children’s and adults’ perceptions of accent strength were measured using a ladder task in which listeners rank talkers based on their perceived distance from their own local accent. Six years of age falls roughly in the middle of the age ranges used in previous studies that reported difficulty in distinguishing regional varieties (Floccia et al., Reference Floccia, Butler, Girard and Goslin2009; Girard et al., Reference Girard, Floccia and Goslin2008; Wagner et al., Reference Wagner, Clopper and Pate2014) and twelve years of age falls in the early adolescent range, which is relatively under examined even when considering the range of classification abilities found in previous work (Bent, Reference Bent2018; Jones et al., Reference Jones, Yan, Wagner and Clopper2017; McCullough et al., Reference McCullough, Clopper and Wagner2019a, Reference McCullough, Clopper and Wagner2019b). In contrast to developmental studies which include several age groups within close proximity, these age groups were included to sample two distinct developmental periods using a task that has not yet been utilized by children of any age. The ladder task reduces cognitive demands compared to previous tasks such as binary categorization and geographical inference (Floccia et al., Reference Floccia, Butler, Girard and Goslin2009; Girard et al., Reference Girard, Floccia and Goslin2008; Wagner et al., Reference Wagner, Clopper and Pate2014; Weatherhead et al., Reference Weatherhead, Friedman and White2019), while allowing for direct comparisons among multiple accents. Further, the task can be completed by adults, which allows for direct comparison across age groups. In addition to analyzing perceptual rankings, we evaluate the relation between objective pronunciation distance metrics and the ladder rankings. Levenshtein Distance, DTW, and speaking rate are used to identify correlates of perceptual ratings of accent strength among children and adults. We aim to better understand how different age groups not only perceive accent strength by examining the relative contribution of acoustic-phonetic cues, but also whether the different age groups utilize different strategies when constructing their ladders.
Research questions & hypotheses
The following research questions and related hypotheses were addressed:
-
(1) Do six- and twelve-year-old children and adults differ in their perceptual rankings of accent strength? It was predicted that six-year-old children will be less sensitive to accent strength, as evidenced by utilizing a smaller range of the ladder than older children and adults due to the previously reported lack of sensitivity in categorization tasks, especially with L1 varieties (Floccia et al., Reference Floccia, Butler, Girard and Goslin2009; Girard et al., Reference Girard, Floccia and Goslin2008; Wagner et al., Reference Wagner, Clopper and Pate2014).
-
(2) Do objective measures of pronunciation distance (Levenshtein Distance, Dynamic Time Warping, speaking rate) contribute to predicting the ladder rankings of six- and twelve-year-old children and adults? We predict that the phonetic pronunciation distance metric (Levenshtein Distance) will contribute more to perceptual ladder rankings than acoustic pronunciation distance metrics across all age groups based on previous findings in adults that suggest segmental information outweighs prosodic information when making perceptual judgments (Alcorn et al., Reference Alcorn, Meemann, Clopper and Smiljanic2020).
Method
Participants
Twenty adults (mean age = 21.05, range: 18-26 years; 4 males, 15 females, 1 non-binary; 18 white, 1 Asian-American, 1 other unspecified race; 19 not Hispanic or Latino, 1 Hispanic or Latino), 20 six-year-old children (mean age = 6.43; 8 males, 12 females; 20 white; 20 not Hispanic or Latino), and 20 twelve-year-old children (mean age = 12.56; 13 males, 7 females; 18 white, 1 Asian-American, 1 unreported race; 18 not Hispanic or Latino, 2 unreported ethnicity) participated. All participants were monolingual speakers of American English. Listeners were recruited from Indiana University and the surrounding Bloomington, Indiana community. Participants evidenced typical hearing by missing no more than two frequencies binaurally on a pure-tone hearing screening at 25 dB HL for 250 Hz and 20 dB HL for octave frequencies between and including 500 and 8000 Hz (ANSI, 2004). All children had typical articulation as shown by a standard score of 85 or higher (Age 6 mean = 104.5 [range: 85–112]; Age 12 mean = 102 [range: 94–104]) on the Goldman-Fristoe Test of Articulation – 2nd Edition (Goldman & Fristoe, Reference Goldman and Fristoe2000). Children’s and adults’ vocabulary scores on the NIH Toolbox Picture Vocabulary Test (Gershon et al., Reference Gershon, Cella, Fox, Havlik, Hendrie and Wagster2010) also suggested typical language abilities (age-corrected standard scores: Age 6 mean = 118.7 [range: 100–146]; Age 12 mean = 120.2 [range: 91–146]; Adult mean = 111.9 [range: 95–132]). A majority of participants reported Indiana as their home state (n=52) with the remainder from one of the following states: Florida (n=1), Illinois (n=2), Michigan (n=1), New Jersey (n=1), Ohio (n=1), Virginia (n=1), and South Carolina (n=1). Listeners who reported being from out of state resided in the Midland region at the time they participated and had lived there for at least three years. Two children were born outside the United States (China and Greece): one child was an international adoptee, and the other was born abroad; both emigrated as infants to the United States at approximately 12 months of age and were raised in monolingual American English-speaking households. Listeners were paid $10 for their participation. Children were also provided with a small gift for their participation. This experiment was approved by the Institutional Review Board at Indiana University.
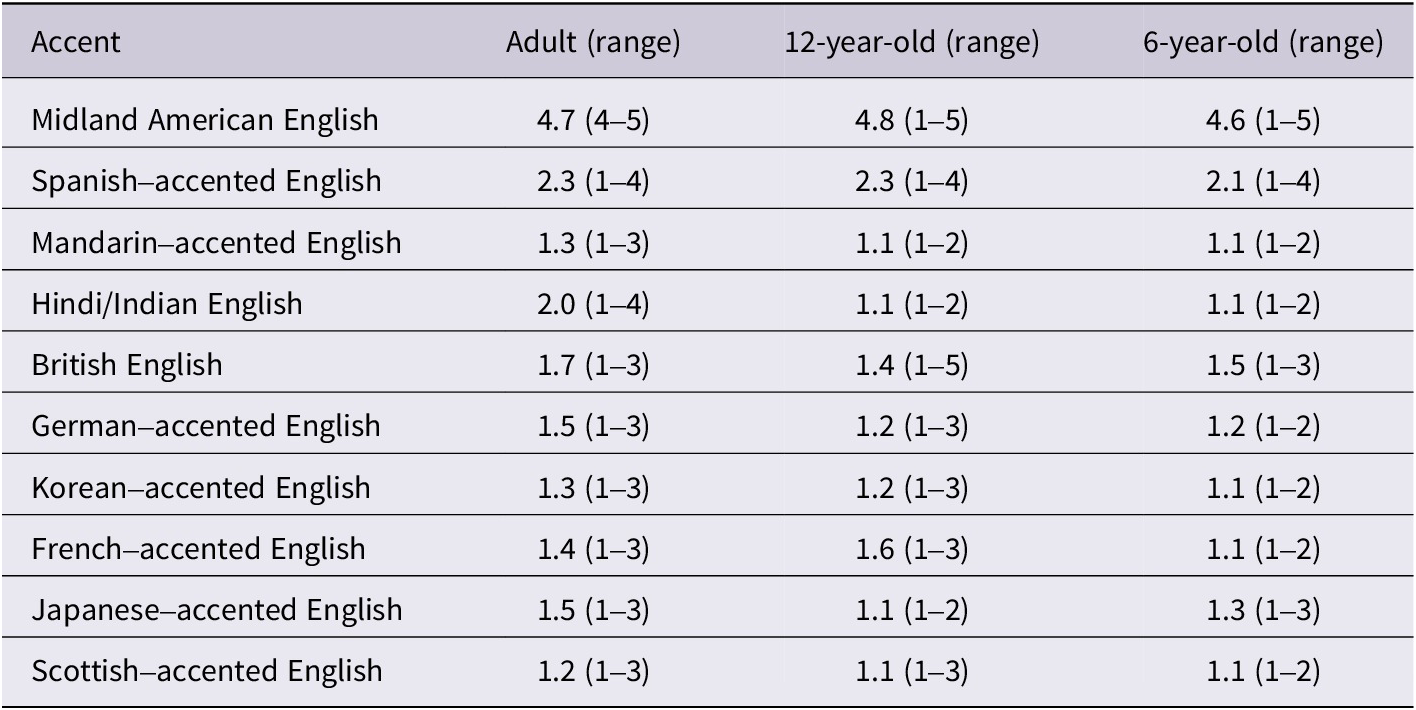
Ratings were obtained for exposure to speakers from the L1 and L2 accents used in the study: British English, Scottish English, Japanese-accented English, Mandarin-accented English, Korean-accented English, Spanish-accented English, French-accented English, German-accented English, and Hindi/Indian English (Table 1). Adults provided self-ratings and parents of the child participants provided ratings on a scale of 1 – 5, where 1 = no or casual exposure, 2 = brief exposure, 3 = moderate exposure, 4 = frequent exposure, and 5 = daily at home exposure. Additional data were collected for adults on study abroad or travel experiences to further assess potential accent exposure, with none reporting any such experiences. One twelve-year-old, and one six-year-old had parents that reported a 1 for Midland, which may have been due to a misunderstanding on the part of the parentFootnote 1. All participants had spent less than 12 months outside of the United States with the majority having only spent a few weeks abroad.
Table 1. Mean exposure ratings for L1 and L2 accents
Stimuli
The stimuli were sentences from the Hearing in Noise Test-Children (Nilsson et al., Reference Nilsson, Soli and Gelnett1996). Stimuli sentences had an average of five words, including both monosyllabic and multisyllabic words. The sentences were produced by 11 female adult talkers from three L1 English accents (Midland American, Standard Southern British, Scottish), six L2 accents (Japanese-, Mandarin-, Korean-, Spanish-, French-, and German-accented English) and one bilingual accent (Indian English / Hindi-accented English). Talkers were on average 24 years of age (range: 18 – 29). All L2 speakers and the bilingual speaker had lived in the United States for four years or less at the time of the recordings. Accents and dialects were chosen to represent a diverse variety of L1 and L2 accents and unique geographic locations. Each dialect/accent had one speaker except for the Midland accent that had two. Each talker contributed three sentences, two of which were the same across all talkers (“The cow was milked every day” and “Father forgot the bread”) and one of which was unique for each talker (see Appendix A). The two stimulus sentences used in the ladders with consistent stimuli were chosen to elicit more salient differences in the talker’s productions of rhotic and vowel sounds. One sentence unique to each speaker was included for a third ladder task to prevent direct comparisons of specific lexical items, placing additional cognitive demands on the listener. Speech samples were either recorded at the Indiana University Speech Perception Lab, the Ohio State University Developmental Speech Research Lab, or obtained through the SpeechBox, ALLSSTAR Corpus from Northwestern University Department of Linguistics (Bradlow, Reference Bradlown.d.). The RMS amplitude of all samples was equated in Praat.
Pronunciation distance measures
Phonetic measure: Levenshtein Distance
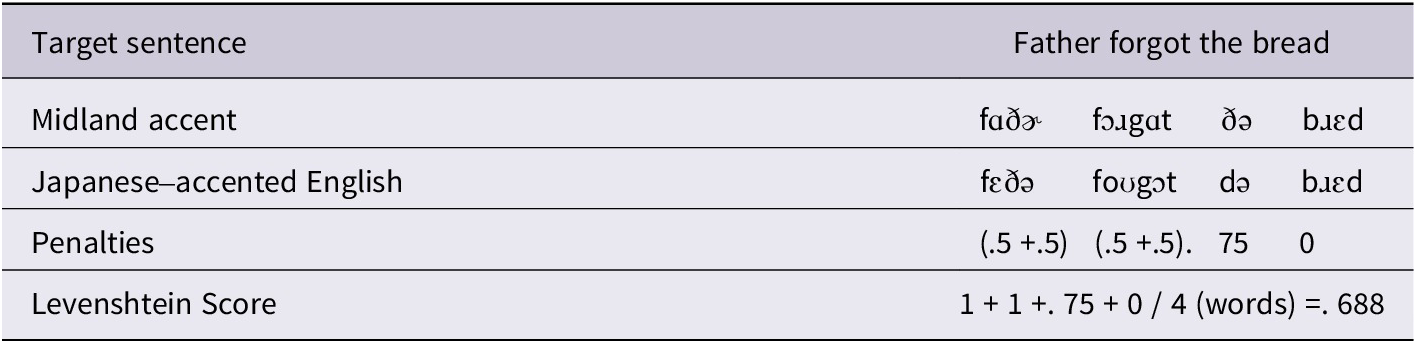
The weighted Levenshtein distance algorithm (Bent et al., Reference Bent, Holt, Van Engen, Jamsek, Arzbecker, Liang and Brown2021; Levy et al., Reference Levy, Konieczny and Hanulíková2019) was used. To calculate the Levenshtein distance scores (e.g., Table 2), the three sentences produced by each talker were transcribed phonetically by two trained research assistants. Transcriptions were then compared, and disagreements were evaluated by a third transcriber who finalized the transcriptions. Penalties were assigned at the word level using weightings that correspond to the differential impact that certain errors may have on perception. Vowel for vowel substitutions were given a penalty of 0.5, consonant for consonant substitutions received a penalty of 0.75, an insertion was given a one point penalty, and other errors (e.g., deletions, consonant for vowel, vowel for consonant) were given a penalty of 0.4. Length changes between the local and the non-local stimuli were accounted for by dividing one by the common logarithm (log10) of the larger of the two strings of phonemes. Transcriptions of the non-local accented speakers were compared to the local dialect (Midland American English) at the word level. Transcriptions of all non-local L1 and L2 talkers were compared to transcriptions for four Midland speakers. When the non-local talker produced a word in a way that was not evidenced by any of the four Midland speakers, a penalty was applied. Midland speakers represented the reference local accent; therefore, all of their Levenshtein scores were zero. Each word level score was summed across the sentence and then divided by the possible number of words for each sentence resulting in a phonetic distance score (see Appendix B).
Table 2. Weighted Levenshtein Distance scoring example
Holistic acoustic measure: Dynamic Time Warping
DTW uses two vectors to compute the shortest distance between two signals through a cost matrix. Here, mel frequency cepstral coefficients (MFCCs) are used as feature representations for comparison. MFCCs were measured using a process similar to that of Bartelds et al. (Reference Bartelds, Richter, Liberman and Wieling2020). However, in the current study, MFCCs were calculated over the whole sentence, rather than individual words from a paragraph. MFCC and DTW calculations and analyses were performed using a Python script incorporating the ‘mfcc’ function in the ‘librosa’ package (McFee et al., Reference McFee, Metsai, McVicar, Balke, Thomé, Raffel, Zalkow, Malek, Dana, Nieto, Ellis, Mason, Battenberg, Seyfarth, Yamamoto, viktorandreevichmorozov, Choi, Moore and Kim2022). The final aspect to the MFCC calculation was normalizing the coefficients, by applying a z-transform to each vector of MFCCs per windowed frame. To reduce the amount of background “noise” in the signal (i.e., extraneous acoustic information), Bartelds et al. (Reference Bartelds, Richter, Liberman and Wieling2020) emphasized the importance of normalization of MFCCs in DTW. A significant increase (r = -.27 to r = -.71) in the magnitude of the correlation between the acoustic distance measure and human accentedness judgments was observed when the normalization procedure was used to process the stimuli in Bartelds et al. (Reference Bartelds, Richter, Liberman and Wieling2020).
As with the Levenshtein Distance scores, all non-local L1 and L2 accents were compared to four Midland referent speakers. Distance scores were averaged to produce one score representative of acoustic distance for each of the three sentences produced by the 11 talkers. Midland talkers distance scores were calculated by comparing one talker to the other three Midland referents. Each speaker received three associated distance scores: two for the consistent sentences and one for the unique sentence (see Appendix B). Because each DTW value is derived from a time series comparison of two speakers saying the same four- to five-word sentence, the range of values is expected to be relatively small. For example, Bartelds et al. (Reference Bartelds, Richter, Liberman and Wieling2020) compared DTW scores to human judgments of accentedness and the DTW values in their study had a small range (between 6.1–6.9). Higher DTW scores indicate greater acoustic differences between the stimulus (a non-local accent) and the referent (Midland American English).
Prosodic measure: Speaking rate
Speaking rates were calculated for each sample produced by the 11 talkers. Articulation rate, which excludes pauses or breaks in the speech sample longer than 200 milliseconds, was not used here because a single pause was produced by one of the talkers. To calculate speaking rate, the number of syllables was divided by the total duration of speaking time in seconds (syll/second). Independent samples t-tests were conducted to determine whether there were differences in speaking rates between each sentence. Speaking rates differed significantly between Sentence 1 (M = 3.81 syll/sec) and Sentence 2 (M = 3.22 syll/sec), t(17) = 2.57, p < 0.001, but not Sentence 1 (M = 3.81 syll/sec) and the Unique Sentence (M = 3.59 syll/sec), t(19) = 0.73, p = 0.24, or Sentence 2 (M = 3.22 syll/sec) and the Unique Sentence (M = 3.59 syll/sec), t(15) = -1.36, p = 0.09.
Procedure
Participants were tested in a single 60-minute session. Prior to participation, consent was obtained from parents or legal guardians of the children and from adult participants. Additionally, assent was obtained from all twelve-year-old children. All participants completed a screening battery prior to testing. The experiment was conducted in a sound-attenuated booth and consisted of three ladder tasks with a minimum one-minute break between ladders. The two ladders in which each talker produced the same sentence were counterbalanced across participants, and the ladder in which each talker produced a unique sentence was presented last. Verbal instructions were given to participants prior to the start of the experiment, and on-screen instructions were provided at the start of each ladder. The experiment was created through custom software written in Python and was run on a Mac Mini or an iMac. Stimuli were presented through a calibrated Yamaha MSP7 Studio Powered Monitor Speaker at an average of 65 dB SPL.
In the experimental task, each ladder consisted of 20 rungs that could accommodate four speakers each and a set of 11 rectangular icons to the left of the ladder (starting ladder is displayed in Figure 1a). The bottom-most rung of the ladder was labeled “Sounds like me”. When participants clicked on one of the icons, a sentence from one of the talkers would play. Participants were instructed to rank the talkers on the ladder according to “who sounds like me” and how similar the talker sounded to people from around the local area. Listeners were asked to place talkers whose productions sounded most similar to their own productions and that of the surrounding region near the bottom, and those most different from the participants’ speech patterns were to be placed at the top (an example of a completed ladder is displayed Figure 1). Talkers who were perceived as equally distant from the local area were placed on the same rung. No model of the target accent was provided. Having more ladder rungs available than talkers allowed for variety in participants’ representations of distance. Participants were able to listen, relisten, and move talkers on the ladder freely and in any combination that they wished. There was no limit on the number of times they could listen to each stimulus. The researcher played each talker a final time after ladder construction to ensure the participant was satisfied with their final constructions. Prior to the experiment task, participants completed one practice ladder. The practice ladder was presented in Microsoft Powerpoint and consisted of a ladder with seven rungs and five movable square icons to the left of the ladder which played male speakers from local and nonlocal varieties. The procedure was the same as for the experiment trials. Listeners heard the same task instructions and were asked to construct the ladder. Listeners were not provided any verbal input on how they constructed their ladder before moving on to the experiment task.
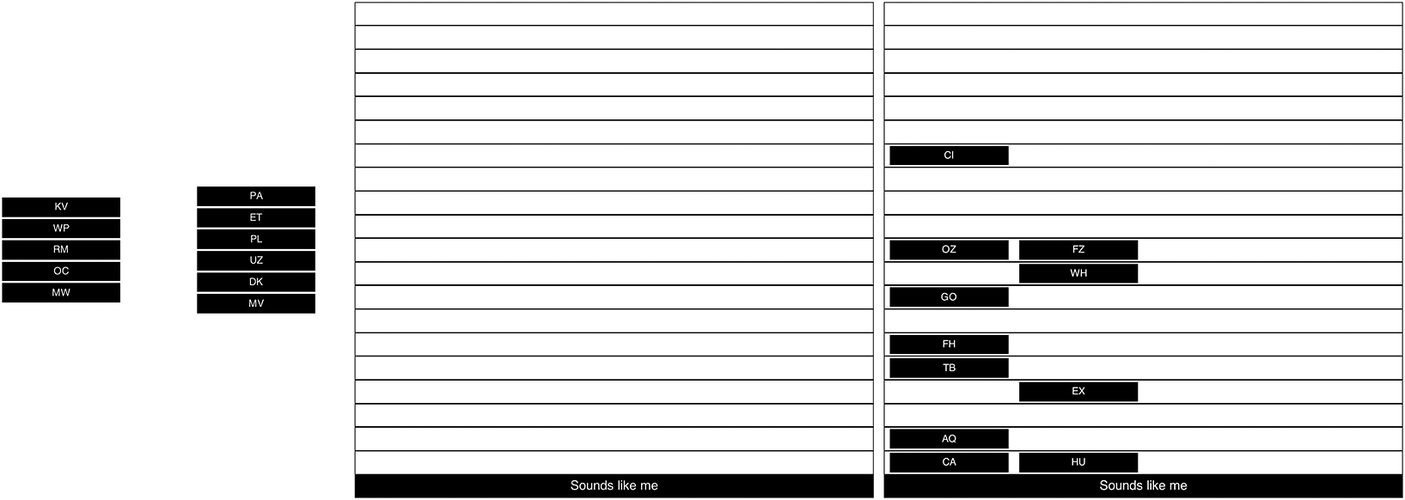
Figure 1. Empty ladder (left), completed sample ladder (right).
Statistical analysis
Statistical analyses were performed using RStudio 2022.02.3+492 “Prairie Trillium” release for macOS (R Core Team, 2023). Statistical code can be accessed at https://osf.io/cnxgt/. Because each level on the ladder differs from the levels directly above and below by one degree of distance, ladder rankings were treated as continuous interval data, which allows for either parametric or nonparametric tests. A parametric analysis was used for more robust inference and because it has been used previously with data from adults using the ladder task (Bent et al., Reference Bent, Atagi, Akbik and Bonifield2016) as well as in similar accent classification tasks (e.g., McCullough et al., Reference McCullough, Clopper and Wagner2019b). Pearson product-moment correlation coefficients were computed to assess the relation between rankings for each age group. Using the lme4 package (Bates et al., Reference Bates, Mächler, Bolker and Walker2015), two linear mixed-effects models were built. The first linear mixed-effects model was performed to predict ladder rankings, including fixed effects for age, sentence, and accent, with two- and three-way interactions between them. A maximal approach to the models’ random effect structure was attempted but only a by-participant random slope for sentence allowed for convergence. To evaluate the relation between objective pronunciation distance metrics and the ladder rankings, a second model was built with fixed effects for Levenshtein Distance, Dynamic Time Warping, and speaking rate with two-way interactions with each fixed effect by sentence and by age, but only a by-participant random slope for Levenshtein Distance and random intercept for accent converged. Variables were coded as treatment contrasts, with L1 and L2 accents compared to Midland as a referent and adults serving as the referent for the other age groups. The full results of both models are presented in Appendix C. Type III Wald chi-square tests were used to determine the significance of main effects and interactions. Significant effects and interactions were further analyzed by conducting pairwise comparisons of estimated marginal means using the emmeans package (Lenth, Reference Lenth2022). To calculate the individual contributions of each predictor to the pronunciation distance, model hierarchical partitioning was conducted using the glmm.hp package.
Results
Across all sentences, very strong positive correlations between ladder rankings were observed between the three age groups, with greater agreement in the two conditions in which the talkers said the same sentence than the Unique Sentence condition. For Sentence 1 and Sentence 2, strong positive correlations were observed between six-year-olds and twelve-year-olds (Sentence 1: r =. 982, p <.001; Sentence 2: r =. 977, p <.001), six-year-olds and adults (Sentence 1: r =. 987, p <.001; Sentence 2: r =. 955, p <.001); as well as adults and twelve-year-olds (Sentence 1: r =. 993, p <.001; Sentence 2: r =. 989, p <.001). For the Unique Sentence, a strong positive correlation was observed between six-year-olds and twelve-year-olds (r =. 941, p <.001), with strong positive correlations between adults and six-year-olds (r =. 947, p <.001) and adults and twelve-year-olds (r =. 963, p <.001).
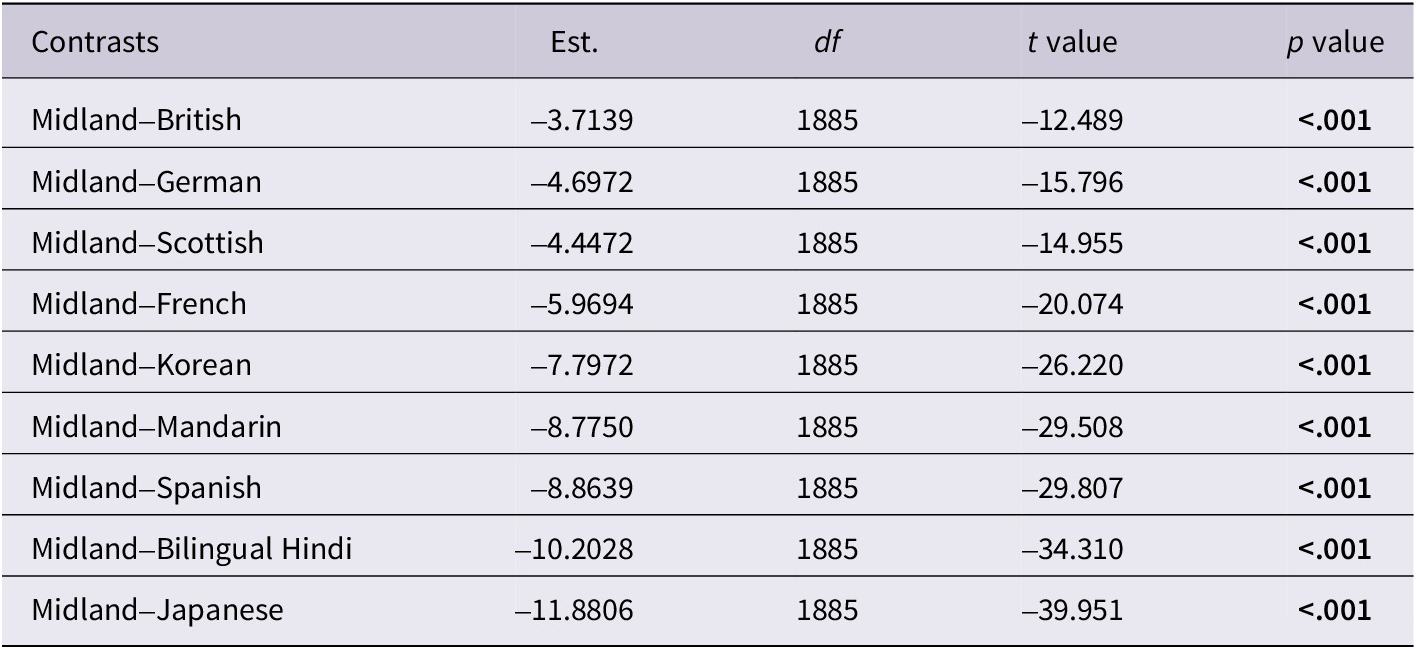
The first model, subsequently referred to as the Perceptual Distance Model, was built to address the first research question by testing whether there were any significant differences between children’s and adults’ perceptions of accent strength (Figure 2). Type III Wald chi-square tests (Table 3) revealed that the main effect of accent was significant, X2(df =9) = 394.45, p < 0.001. However, neither age nor sentence were significant predictors of ladder rankings. Cohen’s d was calculated to further interpret the lack of a significant effect for age, with trivial effect sizes observed for six-year-olds (d = 0.0813) and twelve-year-olds (d = 0.0426) when predicting ladder rankings. Furthermore, age did not significantly interact with accent, p = 0.92, or sentence, p = 0.86. Based on the estimated marginal means, all accents were ranked significantly higher on the ladder than the Midland accent, reflecting that each accent was perceived as further from the local standard than the Midland (Table 4). Furthermore, there was a significant interaction between sentence and accent, X2(df =18) = 144.72, p < 0.001, indicating different patterns in rankings by sentence based on the accent. To interpret this interaction, we compared each accent by sentence to the Midland reference, again using the emmeans package. For each sentence, all accent variants were ranked higher than Midland, except for the British talker for Sentence 2, t(2011) = -0.647, p = 1.0, and the Scottish talker for the unique sentence, t(2011) = -2.432, p = 0.824 (Figure 2).
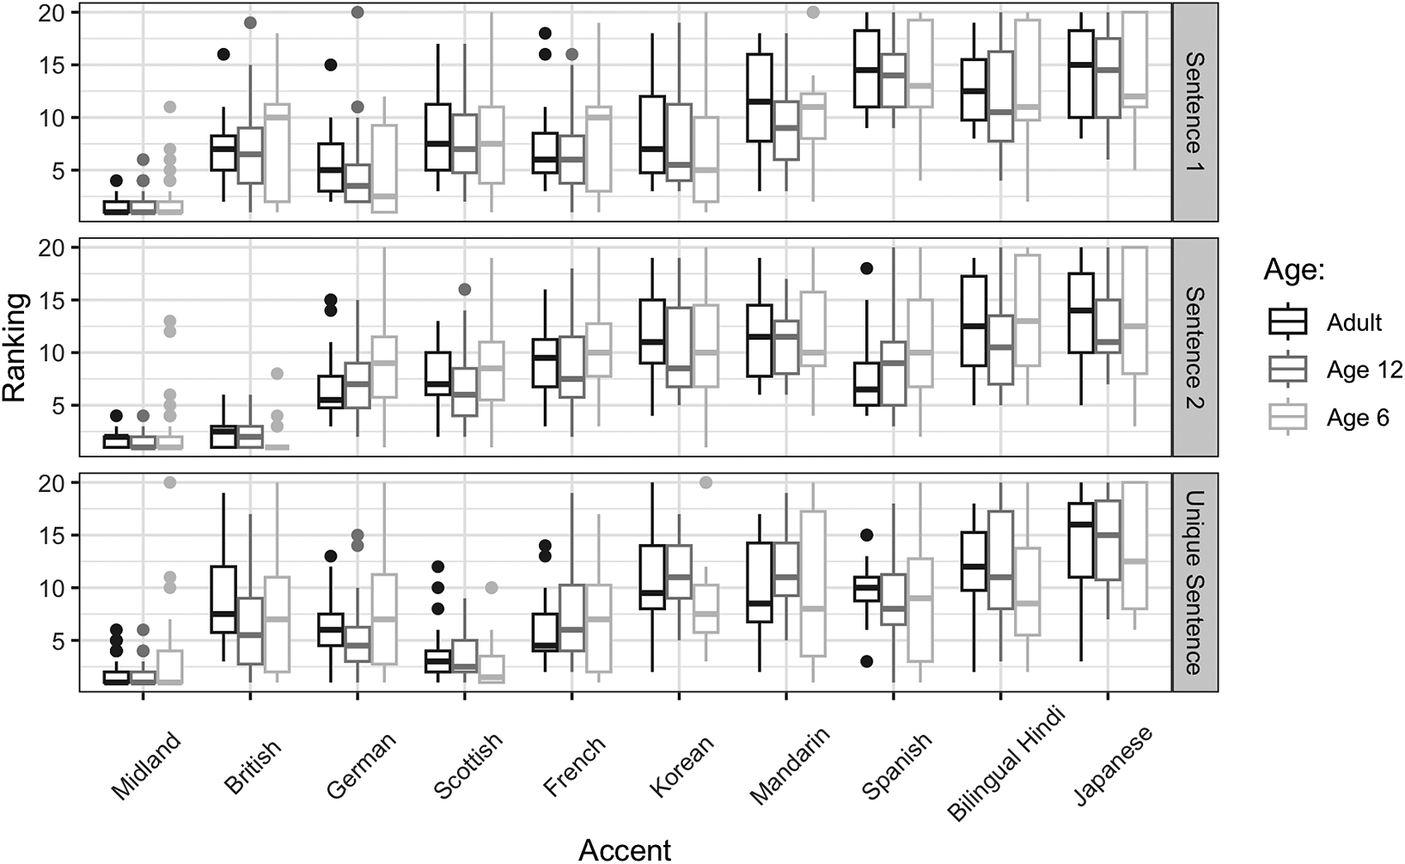
Figure 2. Boxplots of ladder rankings for L1 and L2 English varieties grouped by age, with adults in black, twelve-year-olds in dark gray, and six-year-olds in light gray. Rankings for Sentence 1 appear on top, Sentence 2 in the middle, and the Unique Sentence on the bottom. Each box represents the interquartile range of rankings, with the line indicating the median, and dots outside the range lines representing outliers for each group.
Table 3. Results of Type III Wald Chi-Square Tests for Perceptual Distance Model
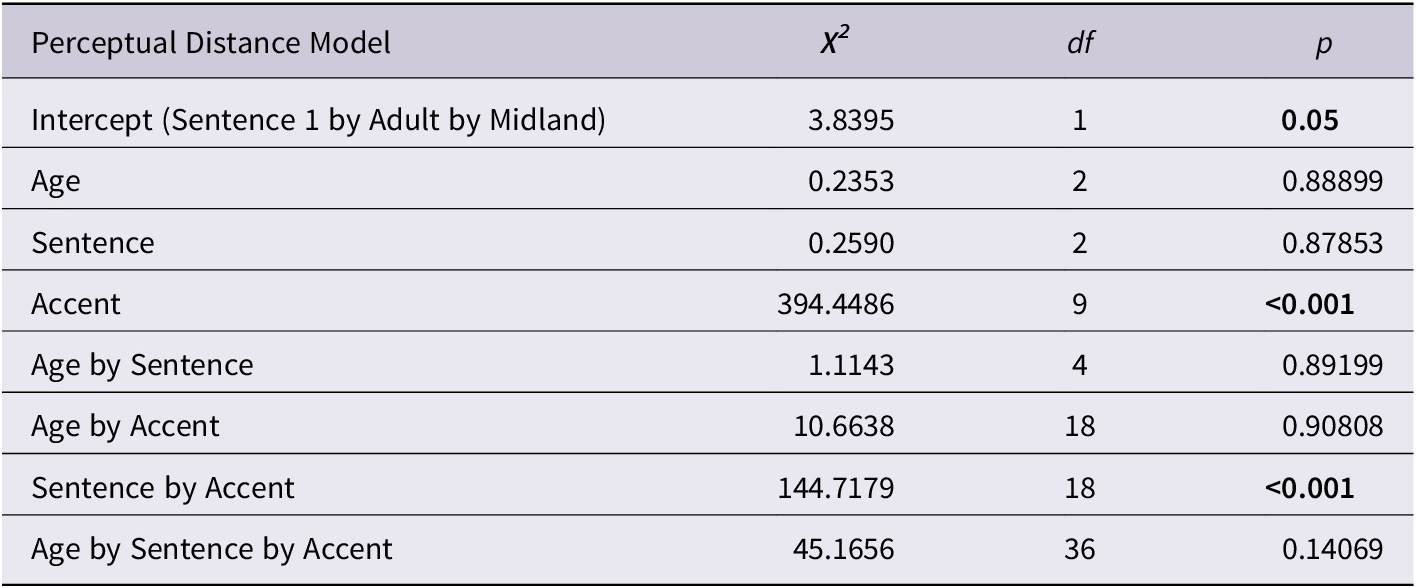
Model syntax: Ranking ~ Age*Sentence*Accent + (1+Sentence|Participant)
Table 4. Pairwise comparisons of estimated marginal mean ladder rankings averaged across age and sentence
The second model, subsequently referred to as the Pronunciation Distance Model, incorporated the objective pronunciation distance metrics to examine their influence on ladder rankings. Type III Wald chi-square tests of the Pronunciation Distance Model (Table 5) revealed significant main effects of Levenshtein Distance, X2(df =1) = 29.51, p < 0.001, DTW, X2(df =1) = 8.54, p < 0.001, and speaking rate, X2(df =1) = 7.03, p < 0.01, suggesting that these metrics independently predicted ladder rankings, with Levenshtein Distance being the stronger predictor of the three measures. Specifically, higher ladder rankings were associated with higher Levenshtein Distance, higher DTW scores, and faster speech rates. Sentence was also a significant predictor of ladder rankings, X2(df =2) = 9.53, p < 0.001. Furthermore, the two-way interactions between sentence and Levenshtein Distance, X2(df =2) = 16.75, p < 0.001, sentence and Dynamic Time Warping, X2(df =2) = 12.10, p < 0.01, as well as sentence and speaking rate were significant, X2(df =2) 10.38, p < 0.01 (Figure 3). Rankings were positively correlated with DTW scores each sentence, but to a lesser degree for Sentence 1. Rankings were also positively correlated with Levenshtein Distance for each sentence, but to a greater extent for Sentence 2. Lower ladder rankings were seen for talkers with faster speaking rates for Sentence 2, but higher rankings were observed for faster speaking rates for Sentence 1 and, to a lesser degree, the Unique Sentence condition. The interactions between sentence and Levenshtein Distance and sentence and DTW suggest that sentential context may influence ladder rankings. However, talkers with larger Levenshtein Distance scores and DTW scores still tended to be ranked higher on the ladder. As in the Perceptual Distance Model, age was not a significant predictor of rankings and did not interact with the other variables (Figure 4).
Table 5. Results of Type III Wald Chi-Square Tests for Pronunciation Distance Model
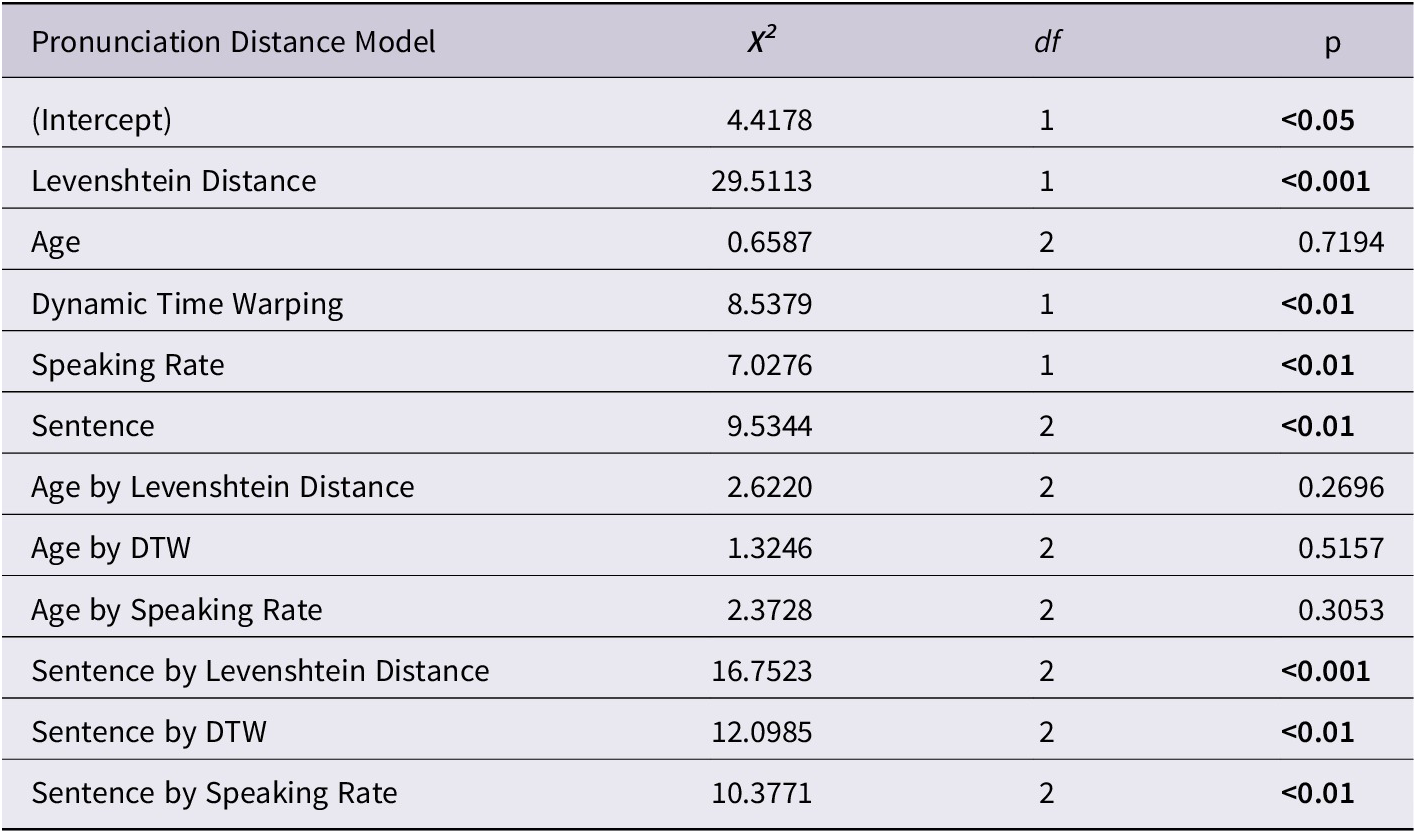
Model syntax: Ranking ~ Levenshtein Distance*Age + DTW*Age + SpeechRate*Age + Levenshtein Distance*Sentence + DTW*Sentence + Speaking Rate*Sentence + (1|Accent) + (1+Levenshtein Distance|Participant)
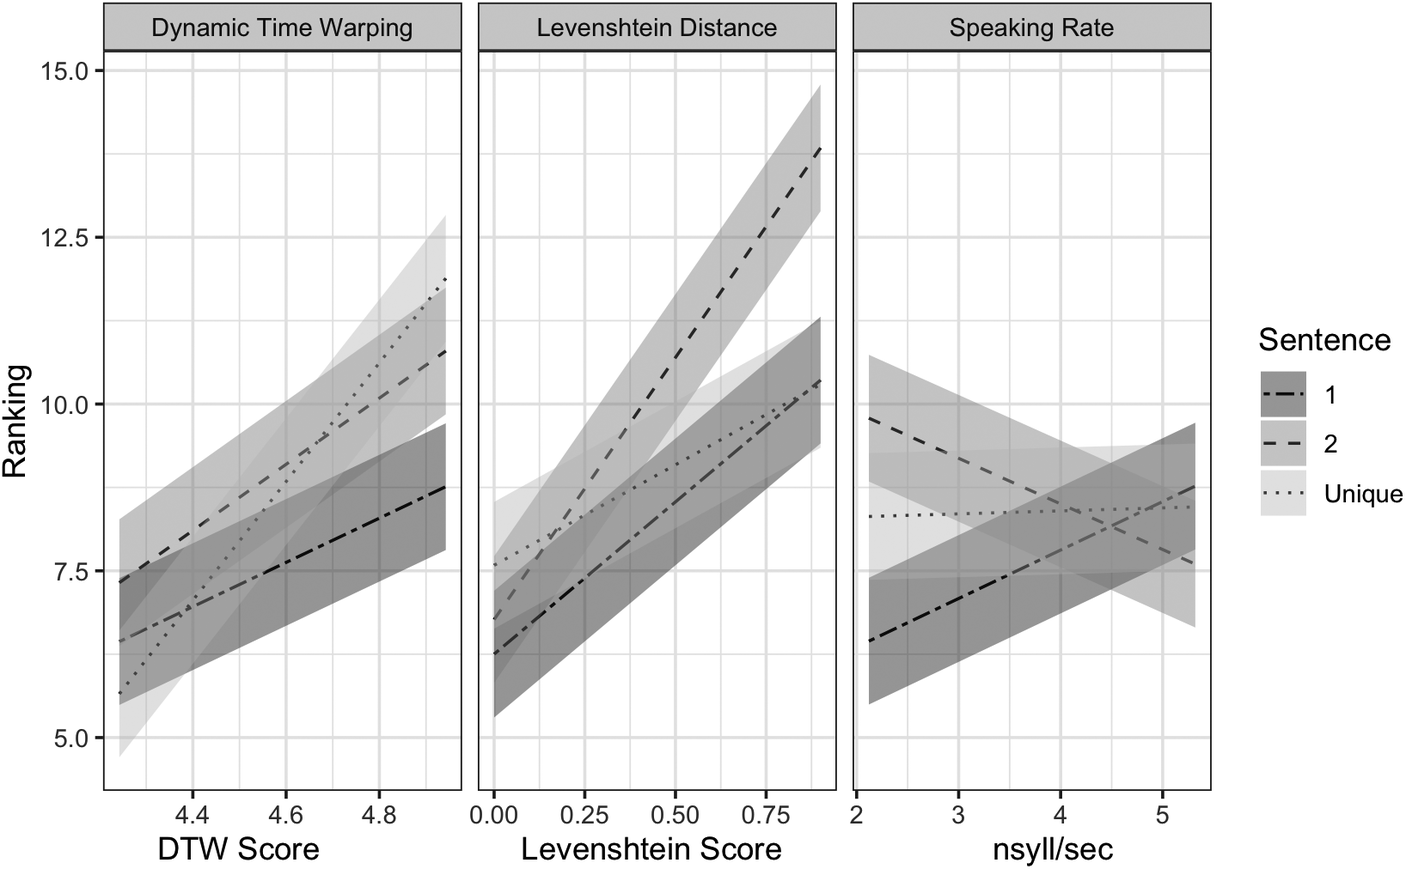
Figure 3. Interactions between sentence and pronunciation distance metrics.
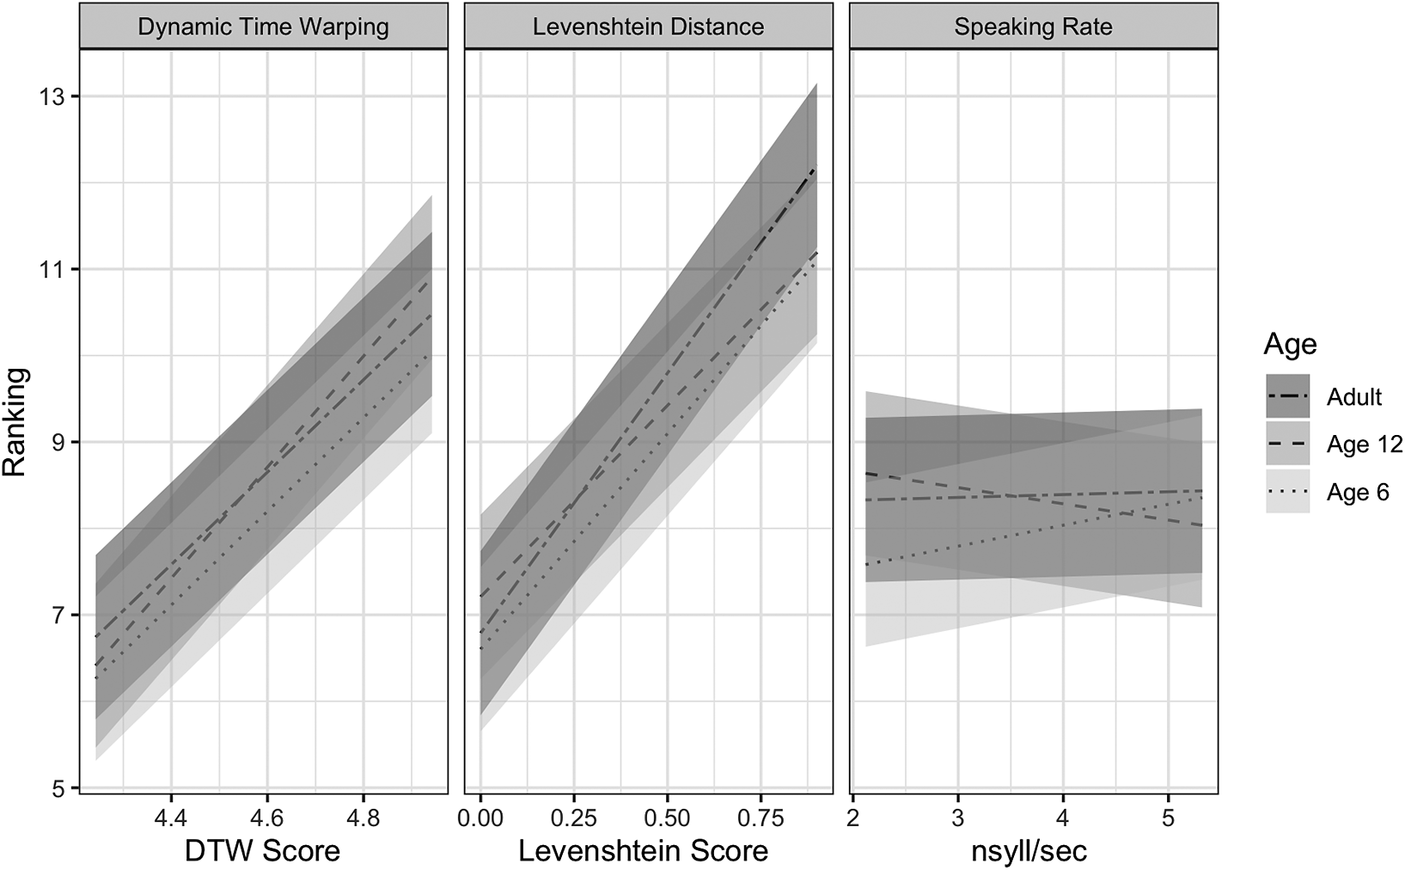
Figure 4. Interactions between age and pronunciation distance metrics.
The importance of each predictor variable in the Pronunciation Distance Model was examined by applying the average shared variance method to linear mixed-effects modeling (Table 6; Lai et al., Reference Lai, Zou, Zhang, Zhang and Mao2022). This resulted in a total marginal R 2 value (0.44) and a conditional R 2 value (0.63) for the model in addition to the unique and individual effect of each predictor. When evaluating predictors’ importance based solely on their unique effect (i.e., partial R 2), accent was the strongest predictor of accent strength ratings with the highest partial R 2 (0.103). However, using average shared variance, the glmm.hp() function accounts for both the unique and shared variance that make up the overall marginal R2, providing an evaluative indicator of each fixed effect predictor’s relative importance. Based on their individual effects, accent was still the most important predictor of rankings, but the influence of the other variables was more clear. Of the objective pronunciation distance metrics, Levenshtein Distance was the greatest predictor of accent ranking with an individual contribution of 23.2%, followed by DTW (14.56%) and speaking rate (1.11%).
Table 6. glmm.hp() output showing the results of the hierarchical partitioning analysis
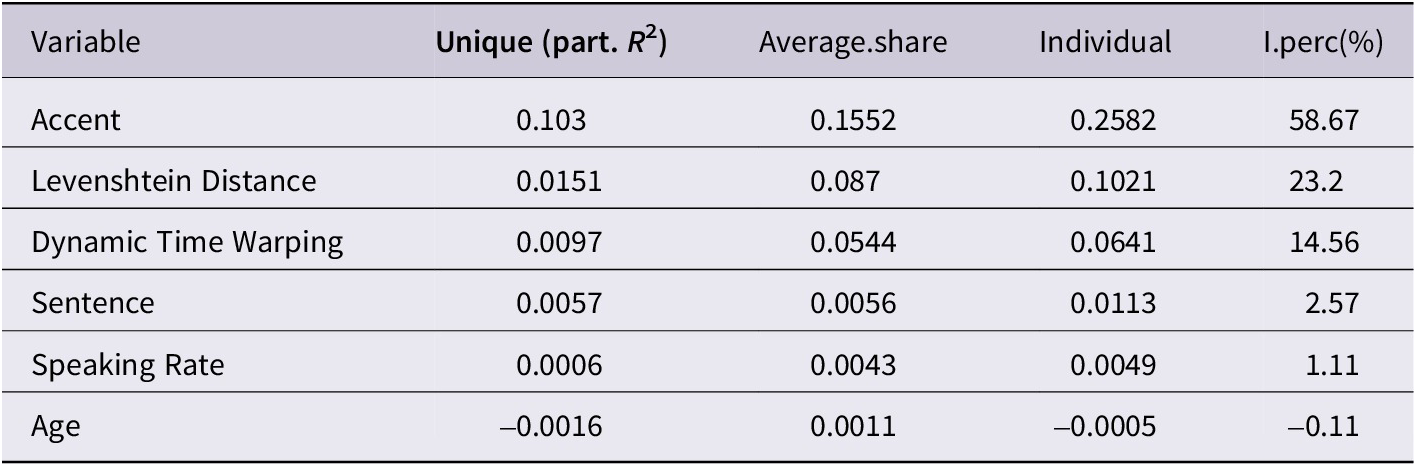
Note: glmm.hp() output contains the unique (partial R 2), the average shared and individual effect of each predictor, and individual contribution percentage (I.perc(%)). Model syntax: Ranking ~ Levenshtein Distance + DTW + Speaking Rate + Age + Sentence + Accent + (1|Participant)
Observations of task performance during testing led to follow-up analyses of the underlying approaches that groups utilized to complete the ladder task. To further examine explanatory variables, language variety (i.e., L1 or L2) was explored to categorize the type of accents heard by listeners in relation to ladder rankings. While age was not a significant factor in either the Perceptual Distance Model or the Pronunciation Distance Model, the way in which ladders were constructed (i.e., construction strategies) appeared to differ between the age groups as indicated by differences in the distribution of ladder rankings and probability density of responses (Figure 5). The youngest listeners, six-year-olds, tended to make horizontal groupings of talkers at the top, bottom, and in the middle when constructing their ladders. This strategy was most evident for rankings of L2 talkers compared to L1 talkers. This strategy was not observed in twelve-year-olds and adults, who more frequently arranged talkers in a vertical array.
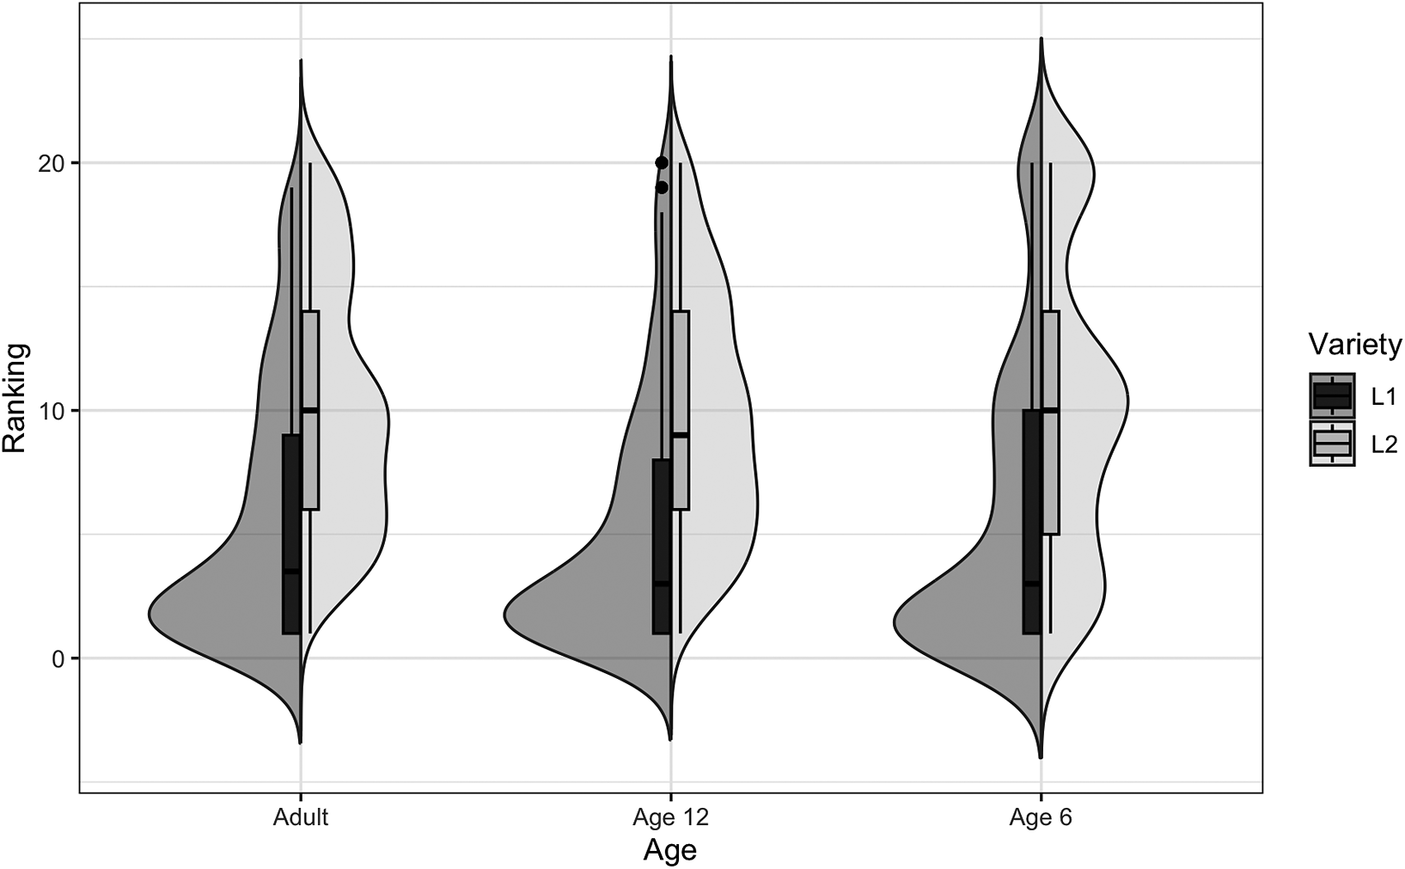
Figure 5. Distribution and probability density of ladder rankings for L1 and L2 varieties in each age group with boxplots reflecting mean rankings. Boxes represent the interquartile range of rankings, with the line indicating the median, and dots outside the range lines representing outliers for each group.
To further examine the different approaches to the task, the mean number of times each listener played the stimulus (i.e., “plays”) and the mean number of movements each listener made on the ladder (i.e., “drops”) were calculated and averaged across sentences (Figure 6). There was a trend for both metrics to be lower on average for six-year-olds (plays μ = 2.6; drops μ = 1.3) compared to twelve-year-olds (plays μ = 4.2; drops μ = 1.7) and adults (plays μ = 4.9; drops μ = 1.8). In contrast to six-year-olds, twelve-year-olds and adults performed similarly on these metrics, listening to the stimuli more often and moving the talkers more frequently on their ladders.
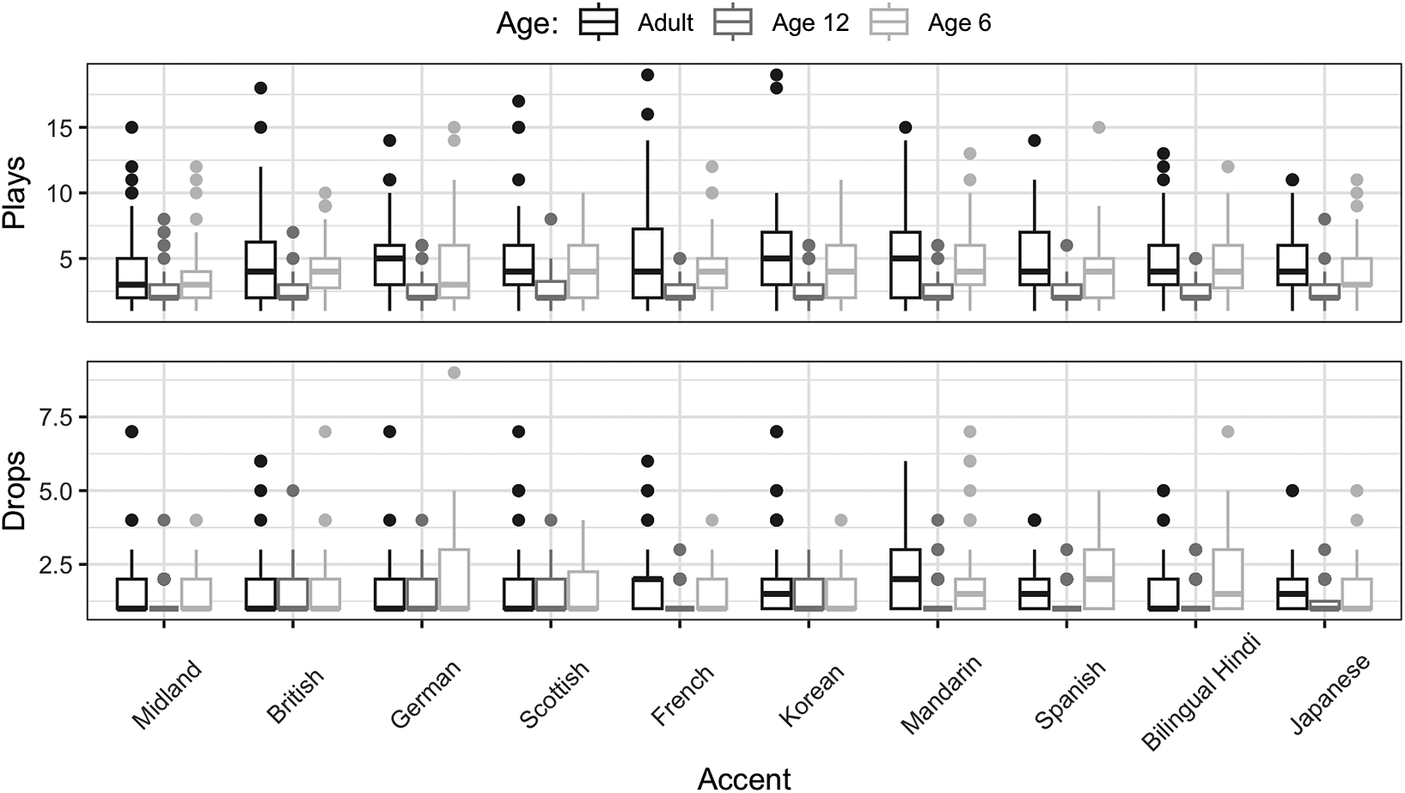
Figure 6. Summary comparisons of plays and drops data by age and talker averaged across all sentences.
Discussion
This study compared six- and twelve-year-old children’s perception of accent strength to adults’, as measured by a task in which listeners ranked L1 and L2 talkers based on their perceived distance from the local standard, Midland American English. Further, we evaluated the relation of objective pronunciation distance metrics to the perceptual rankings of accent strength. The results indicated that even the youngest listeners showed sensitivity to accent strength for both non-local L1 and L2 accents. Contrary to the first hypothesis, there was no evidence that children and adults significantly differed in their sensitivity to accent strength in either of the linear mixed effects models. However, the results supported the second hypothesis, as the phonetic pronunciation distance metric (Levenshtein Distance) contributed more to perceptual rankings than the acoustic-based (DTW) or prosodic (Speaking Rate) pronunciation distance metrics.
Perceptual judgments of accent strength
Key methodological differences afforded by the ladder task likely allowed children’s sensitivity to both L1 and L2 varieties to emerge, in contrast to previous work that suggested children may have difficulty distinguishing their local accent from other L1 varieties (Floccia et al., Reference Floccia, Butler, Girard and Goslin2009; Girard et al., Reference Girard, Floccia and Goslin2008; Wagner et al., Reference Wagner, Clopper and Pate2014), including for an accent contrast previously tested (i.e., Midland American English vs. British English; Wagner et al., Reference Wagner, Clopper and Pate2014). This previously reported lack of sensitivity may have resulted from the cognitive demands of prior tasks. Visual stimuli, including monster and alien puppets (Wagner et al., Reference Wagner, Clopper and Pate2014; Weatherhead et al., Reference Weatherhead, Friedman and White2019) and “cultural items” (e.g., a ranch house compared to a mud hut and a tepee; a business suit compared to a kimono), have been paired with auditory stimuli in tasks in which children are asked to categorize talkers by accent. Greater accuracy was seen with the inclusion of a more implicit measure of group membership in the cultural association task, but children still struggled with explicit categorization (Wagner et al., Reference Wagner, Clopper and Pate2014). Even tasks such as free classification in which young children could make direct comparisons of accents have only included a few accents (e.g., four regional American English varieties in Jones et al., Reference Jones, Yan, Wagner and Clopper2017). None of these studies examined perceptions of accent strength, as we did here. In contrast to previous studies, we found sensitivity to both L1 and L2 accents in a ladder task across all age groups tested, which can likely be attributed to the reduced cognitive demand of the task, as we provided less complex instructions than have been used in other tasks.
The ladder task allowed the participants to freely compare stimuli when constructing their ladders. The opportunity to compare accents directly and differentiate between them when constructing the ladder may have allowed a wider variety of categorization strategies to emerge. However, the listeners were not explicitly prompted to compare accents with one another. Although participants were not asked explicitly to compare accents directly, it is reasonable to infer that perception of accentedness across talkers took place during the task. For example, if Accent A is ranked more distantly from Midland than Accent B, then Accent A is perceived as more accented than Accent B, even though Accents A and B may not have been compared directly by the listener. Asking listeners to directly compare speakers would have changed the nature and demands of the task assigned to the listeners.
While ladder rankings did not differ significantly across age groups, greater agreement across age groups was observed in the ladders with consistent stimuli. In the unique ladder, participants could not compare pronunciations of the same sentence directly because each talker produced a different sentence. For example, listeners had to compare the Japanese-accented talker’s sentence – “A child ripped open the bag”– to the Spanish-accented talker’s sentence – “He’s washing his face with soap”. Increasing the cognitive demand of our task led to increased variability in responses. Listeners appeared to have more consistent ratings when they could make more direct comparisons between pronunciations across talkers. Future studies could incorporate methods like the ladder task that explicitly measure perceptions, such as accent strength, while reducing cognitive demands on participants and produce results with greater potential for replicability across different listener populations.
This study included a wider range of L1 and L2 accents than most previous classification and categorization tasks with one bilingual, three L1, and six L2 accents. However, the range of L1 varieties in particular was limited and did not incorporate more geographically proximal regional variants. Additionally, there was only one talker per accent, besides Midland (n = 2). Future studies thus should include a wider variety of regional accents to further probe children’s development of sensitivity to accent strength, particularly accents that are closer geographically and phonetically to the local accent. It is possible that developmental differences would arise for accents that are closer in the acoustic-phonetic space. More talkers per accent should also be included to identify whether rankings are consistent within accents, regardless of talker. However, the present study expands upon previous studies that utilized both L1 and L2 accents in binary categorization tasks. These studies typically included only one or two non-local accents paired with the local-accented speaker (e.g., British, Irish, and French-accented English in Floccia et al., Reference Floccia, Butler, Girard and Goslin2009; Northern French, Southern French, and English-accented French in Girard et al., Reference Girard, Floccia and Goslin2008; Midland American, British, and Indian in Wagner et al., Reference Wagner, Clopper and Pate2014). For young children, tasks with a greater number of accents may make the acoustic and phonetic differences between variants more salient. In studies that only include binary categorization, children only compare two accents, whereas in the ladder task all accents can be compared to one another in any combination. The increased variety could at least partially explain the greater sensitivity that we observed in six-year-olds compared to previous studies.
The ladder task is similar to tasks such as free classification in that it allows the listener to construct the ladder in any way they choose. Children appear to use different strategies to construct their ladders by creating either disparate groups of talkers or ranking the talkers along a vertical array. Specifically, while six-year-olds distinguished among L1 and L2 varieties, they tended to make three horizontal groupings on the ladder, which was not observed in twelve-year-olds and adults, who often arranged talkers in a vertical array. The trimodal distribution used by the six-year-olds is most evident in their rankings of L2 talkers on the ladder. As one six-year-old described an L2 talker – “I’m not sure where they’re from, but they sure aren’t from around here” – a sentiment that appeared to be common, based on the strategy employed by many six-year-olds. This difference may be related to the differences in plays and drops, which tended to be lowest on average for the youngest group. However, no significant effect of age was found that would have indicated more fine-tuned sensitivity among older children and adults. This result contrasts with developmental trends in accent perception that have been found in previous studies (Jones et al., Reference Jones, Yan, Wagner and Clopper2017; McCullough et al., Reference McCullough, Clopper and Wagner2019b). Thus, further examination of construction strategies is needed to draw any conclusions related to developmental differences.
Our results extend evidence presented by Weatherhead et al. (Reference Weatherhead, Friedman and White2019), which suggested that four- and five-year-olds distinguish their own accent from L1 and L2 variants, and five-year-olds show some graded sensitivity to accent strength. While their study incorporated more variants than previous studies (i.e., three L1 and three L2 varieties of English), their geographic inference task did not allow listeners to directly compare accents nor could they compare children’s performance to older children or adults. By using a task that is appropriate for both adults and children, we were able to compare children’s performance on the ladder task to adults. We found that not only are children sensitive to accent strength, but their use of phonetic-acoustic cues appears similar to adults’ even among the youngest group of listeners: six-year-olds. While we found that age did not predict ladder rankings or significantly interact with other predictors, examining performance among younger age groups may reveal potential age effects. However, the ladder task, as it was used here, might be too difficult for children who are substantially younger than those tested in the current study. That being said, the task could be modified to make it more appropriate for younger children, by reducing the number of accents, for example.
Pronunciation distance metrics
Previous work has suggested that it is possible that children base perceptual judgments of accent on the acoustic-phonetic properties of the accents included in the task, while also suggesting that there are no well-established metrics for evaluating acoustic–phonetic accent distance (McCullough et al., Reference McCullough, Clopper and Wagner2019b). Some studies have included comparisons of general acoustic-phonetic properties of their stimuli, examining features like vowel lowering and fronting, rhoticity, and speaking rate (McCullough et al., Reference McCullough, Clopper and Wagner2019a). In fact, there are objective measurements of pronunciation distance that are well established in the literature, which we used here, that have all been found to be correlated to perceptual judgments of accent strength (Bartelds et al., Reference Bartelds, Richter, Liberman and Wieling2020; Bent et al., Reference Bent, Holt, Van Engen, Jamsek, Arzbecker, Liang and Brown2021; Levy et al., Reference Levy, Konieczny and Hanulíková2019; Wieling et al., Reference Wieling, Bloem, Mignella, Timmermeister and Nerbonne2014). We build on the initial findings reported in Weatherhead et al. (Reference Weatherhead, Friedman and White2019), which found that children can use prosodic cues alone to accurately rate an accent’s strength. These results were obtained by using an approach that altered the speech signal by low-pass filtering, which removes the segmental information and makes the semantic information unavailable to listeners. The present study utilized another approach to identify the cues that listeners are using in perceptual judgments by correlating accent strength judgments with objective distance metrics, which has only been used with adults thus far (Bartelds et al., Reference Bartelds, Richter, Liberman and Wieling2020; Bent et al., Reference Bent, Atagi, Akbik and Bonifield2016; Wieling et al., Reference Wieling, Bloem, Mignella, Timmermeister and Nerbonne2014).
Regardless of sentential context, talkers with larger Levenshtein Distance scores tended to be ranked higher on the ladder, supporting previous findings that Levenshtein Distance is highly correlated with perceptual ratings of accent strength in adults (Wieling et al., Reference Wieling, Bloem, Mignella, Timmermeister and Nerbonne2014) and extending the results to children. Similar to previous findings, Levenshtein Distance was more influential to ladder rankings than the acoustic-based or prosodic distance metrics (Alcorn et al., Reference Alcorn, Meemann, Clopper and Smiljanic2020; van Bezooijen & Gooskens, Reference van Bezooijen and Gooskens1999). In contrast to the substantial effect of Levenshtein Distance on ladder rankings, DTW, the holistic acoustic measure, had a modest but significant effect on ladder rankings. Higher DTW scores (i.e., greater acoustic distance) were associated with higher ladder rankings. This result is similar to findings presented by Bartelds et al. (Reference Bartelds, Richter, Liberman and Wieling2020), which suggested that some acoustic aspect of the speech signal beyond what is captured by phonetic measures alone influences adults’ perceptual judgments of accent strength. This finding can be extended to children based on our results, as there were no significant age interactions or effects in our models. While this acoustic-based measure of distance encompasses the entire speech signal, including phonetic and prosodic information, it likely also includes irrelevant or extraneous information as it is calculated using MFCCs which capture the general shape of speech spectra (Bartelds et al., Reference Bartelds, Richter, Liberman and Wieling2020; Ryant et al., Reference Ryant, Slaney, Liberman, Shriberg and Yuan2014). With DTW being a metric that is transformed from time series data to MFCCs, it is somewhat difficult to parse what specific aspects of the acoustic signal listeners are attending to when perceiving accented speech. The less substantial effect of DTW on ladder rankings seen in the present study is likely caused by the lack of specificity of the measure. More feature-specific metrics are needed in the future to examine which aspects of the speech signal (e.g., intonation, pitch, etc.) influence accent perception and their relative contributions. Taken together, these results provide additional evidence that children’s perceptual accent judgments are dependent upon the acoustic and phonetic similarity to the listener’s local accent.
Similarly to previous findings on the influence of speaking rate, our results suggest that this durational prosodic cue influences strength ratings, but to a lesser extent than the other pronunciation distance metrics. Lower ladder rankings were seen for talkers with faster speaking rates for Sentence 2, but higher rankings were observed for faster speaking rates for Sentence 1 and, to a lesser degree, the Unique Sentence condition. The differences in the direction of the relation between speaking rate and rankings may have been due to the content of the sentences. In the Unique Sentence condition, which had a more modest correlation between speaking rate and ranking, listeners may not have been able to make use of speaking rate to the same extent, as the utterance differed for each speaker. For example, when the listener heard the Indian talker’s sentence: “The baby has blue eyes” they could not compare it phonetically to the Mandarin talker’s sentence “The oven was too hot”, and speaking rates may have differed due to the phonetic content. The higher rankings associated with faster speech for Sentence 1 and the Unique Sentence are perhaps the most difficult to explain, as previous work suggests that slower speech from L2 talkers tends to be rated as more strongly accented (Derwing & Munro, Reference Derwing and Munro1997). Although speaking rates varied substantially across our talkers, the three slowest speakers for Sentence 1 (Scottish, Korean, and German) and Sentence 2 (Mandarin, German, and French) were not ranked as the most strongly accented, suggesting that some other aspect of the stimulus might mediate the effect of speaking rate when rating accent strength. Further examination of the effects of speaking rate, especially the possible interactions with phonetic distance and other prosodic cues is needed to aid in understanding the role of durational cues on perceptions of accent strength by children and adults.
Conclusion
Our results provide significant new insights into children’s perceptual abilities with accents. In contrast to previous research, which suggested that children had difficulty distinguishing L1 accents in accent perception tasks, we found that children as young as six years of age were not significantly different in their sensitivity to accent strength from twelve-year-olds and adults on a ladder task that allowed direct comparisons across stimuli. When perceptual judgments were compared to objective pronunciation distance metrics, Levenshtein Distance, the phonetic measure, was a stronger predictor of perceptual rankings on the ladder task than the acoustic-based measure, Dynamic Time Warping, or the prosodic measure, speaking rate. Children’s abilities to distinguish accents are likely dependent upon the demands of the task and the acoustic-phonetic characteristics of the variants included, especially for children in the early school-age years. Further examination of children’s perceptions of accent strength in relation to attitudes towards speakers as well as other social evaluations are needed to better understand how accents influence the social world of children.
Supplementary material
The supplementary material for this article can be found at http://doi.org/10.1017/S0305000924000138.
Acknowledgments
Funding support was provided by NSF grants 1941691 and 1941662. We would like to thank Holly Lind-Combs, M.Ed., CCC-SLP, Department of Speech and Hearing Science at Ohio State University for help with acoustic and phonetic analyses and RAs (Payton Bastie, Alondra Rodriguez, Jessica Bell, Emerson Wolff, Mimi Tran, Sydney Perry, Jesse Sherman, Josy Williams, Nicole Follman, Jillian Bassett, Savannah Abram, and Michaela Sanger) for help with data collection.
Competing interest
The author(s) declare none.


 Open access