

Maps, the preeminent form of spatial visualization, can be dated back over two millennia in China, but the earliest significant extant maps date back to the Song period. It is clear from these works that in practice there was not a standard definition of what a map should be. The famous Yujitu which was engraved into stone in 1136, for example, is a grid-map that on its eastern half is reasonably accurate, despite the fact that it was drawn based on information on distance and direction between administrative seats. On the reverse is the Hua-Yi tu, a map of the civilized and tribal peoples, which aims only at approximation of space. The differences have to do with purpose: the Yujitu wants to show the relationship between contemporary places and topographic features with those appearing in the earliest geographical text, the “Tributes of Yu,” and the Hua-Yi tu, in addition to giving prefectural seats and roughly depicting mountains and rivers, is loaded with textual accounts of the surrounding tribal peoples. Both maps are propositions about spatial relationships but have adopted different methods of representation to get the point across.Footnote 1 Also from the twelfth century is the first extant historical atlas, and the earliest printed one in human history, the Lidai zhizhang tu, a series of maps showing spatial changes in the administrative system from antiquity to the 1080s.Footnote 2
Cordell Yee has written the most detailed history of Chinese cartography in English,Footnote 3 and Cao Wanru has edited a collection of reproductions and studies of historical maps.Footnote 4 Significant pre-1900 US Library of Congress China maps are viewable online at the Academia Sinica Digital Center.Footnote 5 Today important historical map series are also available online, scanned and (sometimes) georeferenced. These include the twentieth-century topographic maps from the US Army Map Service at 1:250,000 scale accessible at OldMaps Online,Footnote 6 the 1:25,000 and 1:50,000 Japanese and Republican maps accessible at the Center for GIS at Academia Sinica,Footnote 7 and the excellent Soviet 1:100,000 maps available commercially. Much US overflight and satellite photography is now publicly available.Footnote 8
There are numerous thematic atlases and maps of historical events and historical data.Footnote 9 The most comprehensive atlas of the field administration, from antiquity to 1908, is the eight-volume historical atlas edited by Tan Qixiang.Footnote 10 It is superseded in geographic accuracy and temporal specificity by the China Historical GIS (CHGIS), discussed below.
GIS
The geographic information system (GIS) is a more recent technology, dating back only to the 1960s and widely available commercially beginning in the 1980s. We should think of a GIS as a database in two parts. The spatial part is a set of points, lines (connections between points), and polygons (lines that cross over themselves to create enclosed spaces). The core concept of a GIS is that geographic space can be represented by points, lines, and polygons on a grid where the x/y coordinates represent longitude and latitude. Once we have “spatial objects,” we need the second part of the database to store information about those spatial objects. A point might represent a town, a line a river, and a polygon the boundaries of a county. Information can be attached those spatial objects (the population of a county, the name of a river, the economic output of a province). Spatial objects can thus have multiple “attributes.” Using GIS software we can project the spatial objects in two dimensional space (taking into account the three dimensionality of the earth). It is possible to scan maps, peg their four corners to their longitude and latitude, and lay points, lines and polygons on top. Very often we use as a basemap a digital elevation model (or grid data) in which every pixel has a color value to represent elevation.
The power of GIS is that it allows the user to overlay different kinds of data that have spatial attributes, and thus to see correlations that would remain opaque if one relied solely on statistical analysis. With a GIS we can take datasets that have spatial references—for example, the number of Buddhist monasteries, the number of Confucian academies, the tax burden, and the number of civil service degree holders from these places—and overlay one over the other to see if there are correlations. In contrast to printed maps, a GIS is an open-ended and flexible system that gives users the ability to choose what they want to compare and how they want to represent it.Footnote 11
GIS databases and georeferenced maps can be downloaded, but they require GIS software. ArcGIS, from ESRI the leading GIS software company, is the most sophisticated and powerful; it requires a license. Quantum GIS (QGIS) is freeware that works on both Windows and Apple operating systems; it is easy to use and quite adequate for historical studies.
Historical GIS aims to add a temporal component to spatial analysis, which under normal circumstances excels in variation across space rather than change over time.Footnote 12 It allows users to answer two questions: What was the situation at a particular moment in time? and How did that situation change over time? Most data are not only place specific, but also time specific. But to represent these spatiotemporal data one must have accurate locations of the places that existed in the past. For example, suppose one wanted to trace the growth of a population over time and its changing distribution through space. Suppose further that the population data were collected by administrative unit (county, prefecture, circuit, province) over a two-hundred year period but that the names and boundaries of the administrative units changed during this period. The prerequisite for analyzing the population data would be a GIS that accurately depicted the units—their location, their name changes, and their size. This would be the “base” GIS, for it would provide the basis for depicting and analyzing all the population records that were collected by county. But this would also be a common base, for it could be used to depict and analyze all the different kinds of data that were collected by administrative units for this period. The fundamental task of historical GIS is in fact a research task in historical geography, to create an historically accurate common base, something that will serve many different research interests by providing the history of the units that were used to collect information in the past. The common base GIS has value in and of itself, it becomes a digital historical atlas that can be corrected, updated, and shared at minimal expense.
China Historical GIS (CHGIS)
The CHGIS project was launched in 2000, inspired by the work of Robert M. Hartwell, who had drawn on work on a contemporary GIS for China by G. William Skinner, William Lavely, and Lawrence W. Crissman. The project, a collaboration between Harvard and the Center for Historical Geography at Fudan University, was made possible through the support of the Henry Luce Foundation, with later support from the National Endowment for the Humanities. The general editors are Peter K. Bol and Ge Jianxiong, with executive editors Merrick Lex Berman and Man Zhimin.Footnote 13
The goal in creating CHGIS has been to make it possible for users to project their data—whether population reports, tax quotas, military garrisons, or religious institutions—onto a digital map that accurately reflects the administrative structure and settlements at any given year from 221 BCE to 1911 CE. By downloading the CHGIS datasets GIS users can join their own datasets and create new data layers appropriate to their research. They can analyze that data, test hypotheses about spatial relationships, generate historical maps for research, teaching, and publication, and share their data with others.
CHGIS serves two other functions. First, it is an historical gazetteer. Using TGAZ, the online query utility,Footnote 14 users can search by place name to see when it existed, where it was, where it belonged in the administrative hierarchy, and the historical documentation for these findings. This means that almost all administrative place names down to the county (xian) level can be accurately located. This free utility currently receives between 20,000 and 50,000 search requests per month. Second, it is an electronic atlas. Because CHGIS has adopted a “continuous time series” approach—that is, it traces all known changes over time, so that users are free to decide which moment(s) they wish to view—it may be used as a source of maps of the known administrative structure and settlements of China for any year between 221 BCE and 1911 CE. Users can do this for themselves, generating layers as they need them, or they may view and download CHGIS layers set at 50-year intervals from 1350 to 1900 on the WorldMap platform.Footnote 15
There is an important caveat. CHGIS aimed to go beyond the “slices in time” of the Tan atlas and create a continuous time series, recognizing that for some periods historical documentation would be lacking. It codes multiple levels of uncertainty in the datasets. The territorial boundaries of administrative units are particularly difficult to document for some periods and some regions. Prefectural borders are only complete for north and south from 1350 on and in general CHGIS coverage is limited to those areas under the centralized civil administration.
CHGIS datasets
CHGIS datasets come in the form of GIS files (“shapefiles”) which can be downloaded through the CHGIS website.Footnote 16 There are four categories of data.
1. The “time series,” from 221 BCE to 1911 CE, which can be queried by year.
2. The “slices in time,” for the years 1820 and 1911.
3. The “digital elevation model,” which gives the topography of eastern Eurasia.
4. The lakes, rivers, and coastlines, as of 1820.
There are two further distinctions.
1. Time series and slices in time files are divided into separate files for:
• Point files, which are divided into Villages (for 1820 and 1911), County level seats, Prefectural level seats, and Provincial Capitals.
• Polygon files, which are divided into Prefectural boundaries (complete for 1350–1911), County boundaries (for 1911) and Provincial boundaries (for 1820 and 1911)
2. Files are offered in different Chinese character encodings and projections:
• Encoding in either GBK (PRC standard) or UTF8
• Projection in either Xian80 (PRC standard) or WGS84
All files can be downloaded through the CHGIS website, through the Harvard Geospatial LibraryFootnote 17 or directly from Harvard's Dataverse.Footnote 18
Map 1 is an example of a map that can be generated with CHGIS datasets above.

Map 1. Prefectural boundaries, prefectural seats, and county seats as of 1400 from CHGIS v. 6.0; DEM from CHGIS, rivers lakes and coastlines as of 1820 from CHGIS v. 5.0. Labels (in Chinese or pinyin) can be included.
Using the same software any data with known spatial referents can be drawn on this map. Map 2 shows the distribution of the 1880 jinshi degrees granted during the Yongle reign, 1403–1424.
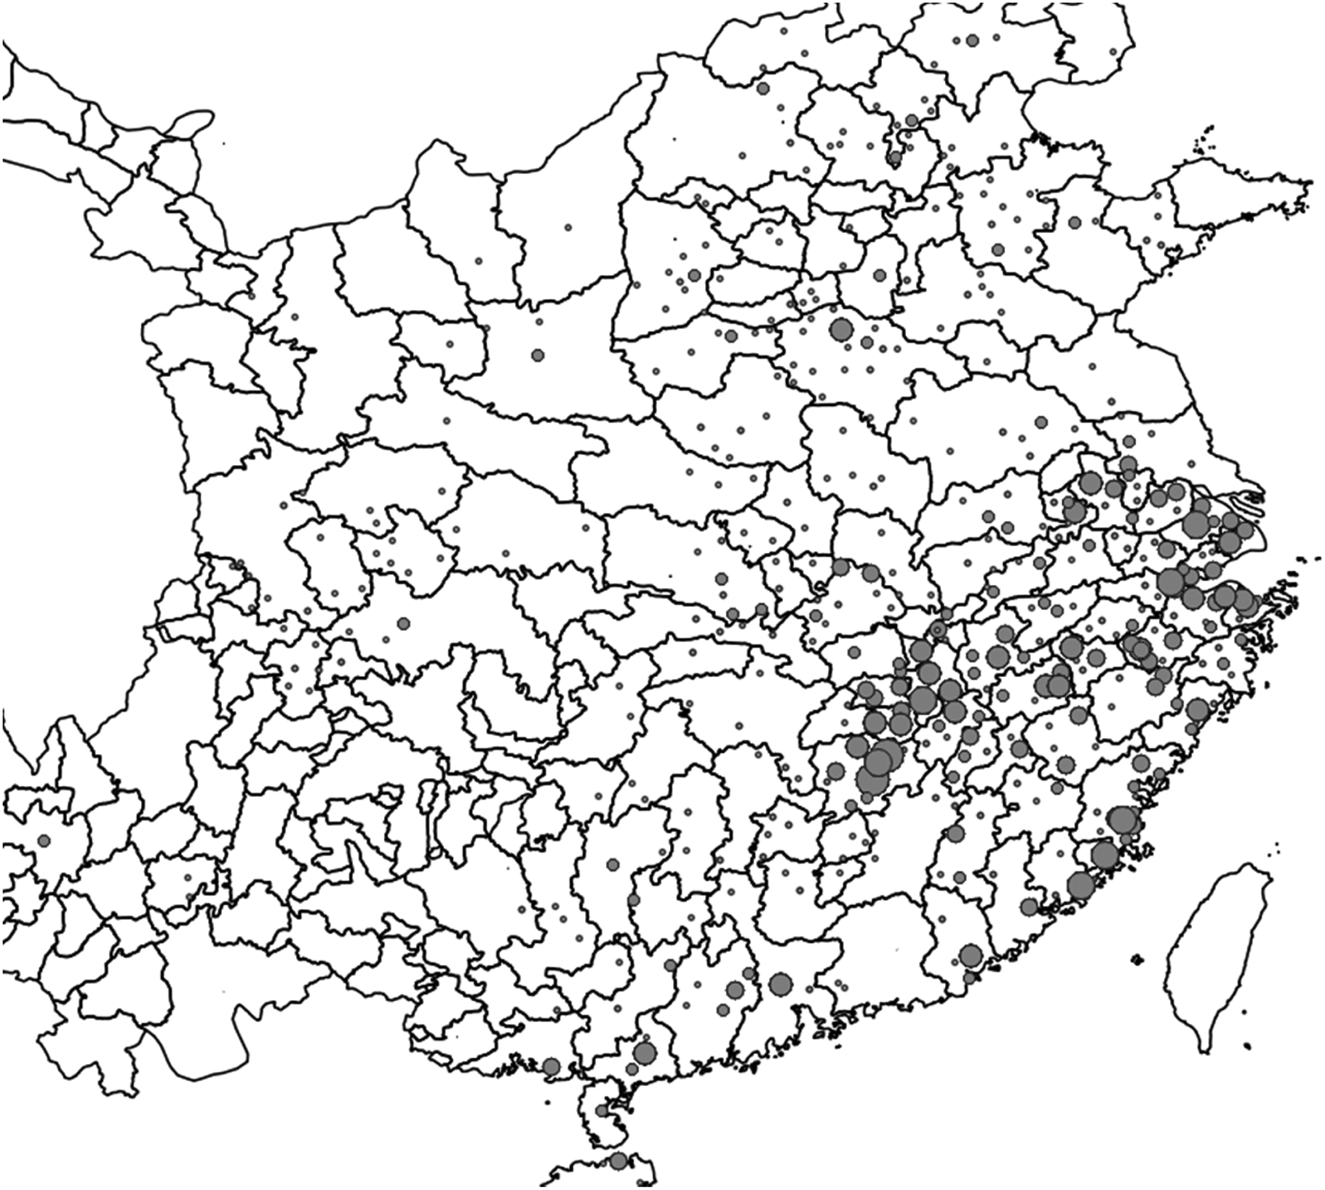
Map 2. Jinshi degrees granted from 1404 to 1424. Prefectural boundaries as of 1400 from CHGIS v. 6.0. Jinshi data from the China Biographical Database, v. CBDB_20190424
Nineteenth- and Twentieth-Century Datasets
Datasets for nineteenth- and twentieth-century China created under the leadership of the late G. William Skinner are available with their codebooks through the CHGIS webpage. They include:
Physiographic Macroregions of China
The map of China's physiographic macroregions specifies our informed decisions as to (1) the precise location of cutpoints in river systems that extend across regional systems, (2) the macroregional affiliation of small coastal river systems, and (3) which internal drainage basin along the Inner Asian frontier should be included in China Proper.
ChinaW—Cities, County Seats and Yamen Units (1820—1893)
ChinaW Dataset contains point locations for all Cities, County seats, and Yamen-Level units recorded in China from 1820 to 1893, along with more than 150 attribute values for each record. A table of gazetteers consulted for each county is also provided.
Socioeconomic Macroregions of China
The regional system analysis of twentieth-century China revealed nine macroregional economies/societies, excluding Inner Asian territories. The analysis covers the urban and the associated local and regional system hierarchies of these macroregions during the 1990–2000 period. The Socioeconomic Macroregions available here are snapshots of the regional systems (which change over time depending on variable inputs). The GIS Shapefiles provided here are divided into two layers, (1) for the Main Macroregions [SMR], (2) for the 33 Subregions [SMR_SubR].
China-CPZ (Core Periphery Zones)
China-CPZ, the core periphery zones of China, circa 1990. Core-Periphery Zones are based on a regional systems analysis of China, drawing on data about population density and agricultural intensity for county level units (see the Regional Systems Index in the ChinaA datafile). Zones were delineated considering physical geographical features such as rivers, ridge-lines, slope, and the transportation network. China's core zones represent some of the densest populations and highest levels of agricultural productivity anywhere in the post-industrial world. Traveling outward from the metropolitan cores, these levels of intensity decline, reaching their lowest levels in the peripheries along regional boundaries. This analysis complements the central place analysis of cities and towns, represented in the ChinaT datafile, which identifies nested hierarchies of regional, greater, and local city systems.
China-T (1990) Central Place Analysis
ChinaT Dataset contains a record for every central place in China that was the central city (Cc) of a shi (municipality) or classed as a zhen (town) as of 1 July 1990. To these were added (1) records for qu (centers of peri-urban urban districts that do not appear as such in the census tables), and (2) capitals of county-level units that do not rank as zhen.
China-A Dataset, County-Level Units 1990
The ChinaA Datasets combine the raw geographical units and the essential county-level unit variables used for Skinner's 1990 China Regional Systems analysis. ChinaA MQ Dataset is composed of the ChinaA MQ (Merged Qu) geographic units that have been joined to tabular data compiled from the 1990 Census variables.
China City Walls of Hebei and Shandong
The 1904–07 Prussian maps show the footprints of settlements including the outlines of city walls. Small areas around each capital in the ChinaW file were clipped from the georeferenced maps. Filenames contain the ChinaW ID number for each city.
Karte von Tschili und Schantung (Maps of Zhili (Hebei) and Shandong), 1904–1907
These detailed maps compiled by the Royal Prussian Land Survey provide a unique view of the North China landscape of a century ago, showing the built-up areas, or footprints, of settlements from walled cities down to small villages. Digital scanned images of these maps have been prepared for research on historical land use change.
Various other GIS datasets are also available. Examples include the Language Atlas of China (William Lavely and Lawrence Crissman), ChinaHydro NavNet (Crissman and Merrick Lex Berman) and ChinaHydro Basins (Crissman and Berman).
Online GIS Platforms for China
Today users can do some spatial analysis through online platforms, either by uploading their own data or using shared data from others. The key to a good platform (in my view) is stability, long-term institutional support, and allowing users to upload and share data. Three general platforms stand out. ESRI's ArcGIS Online has free public and institutional options and has strong support.Footnote 19 WorldMap.harvard.edu is open-source and open-access. It has map collections on contemporary and historical China, CHGIS datasets, and Skinner datasets.Footnote 20 The Academic Map Publishing Platform from Zhejiang University 學術地圖發佈平台 (based on the WorldMap platform) displays a growing number of maps pertaining to Chinese history and literature.Footnote 21 The outstanding Silk Road Historical Geography Information Open Platform 丝绸之路历史地理信息开放平台 from Capital Normal University combines extensive data on western China and Inner Asia and a variety of other utilities.Footnote 22 Academia Sinica's Chinese Civilization in Time and Space 中華文明之時空基礎架構 includes several animated maps showing change over time but is not an open platform.Footnote 23

