

Introduction
Short- and medium-term variations in the surface velocity of glaciers have been reported from temperate as well as sub-polar glaciers (Reference IkenIken, [1978]). (The term “sub-polar” is here used to denote that the temperature over parts of the glacier is negative even in summer down to a certain depth, i.e. it does not exclude a warm base.) It is assumed that these velocity variations are caused by changes in sub-glacial water pressure brought about by changes in water input from the surface of the glacier (ablation) and sub- and englacial storage of water. Consequently, short- and medium-term velocity measurements are a means of providing additional information about the glacial drainage system.
Variations of surface velocity of temperate valley glaciers have been reported from numerous investigations, e.g. by Reference MeierMeier (1960), Reference PatersonPaterson (1964), Reference IkenIken ([1978]), and Reference IkenIken and others (1983). Relatively few observations have been obtained on sub-polar glaciers, e.g. Reference BattleBattle (1951), and Reference Müller and IkenMüller and Iken (1973).
In Greenland, Reference AndreasenAndreasen (1982) and Reference ClementClement (1983) measured seasonal velocity variations at glaciers in West Greenland, whereas Reference NoblesNobles (1960) in north-west Greenland found no significant variations in a profile close to the firn line. In East Greenland, Reference Friese-Greene and PertFriese-Greene and Pert (1965), and Reference PatersonPaterson (1961) found ice velocity variations during the summer.
As a part of a glacier-hydrological investigation at Tasersiaq in West Greenland, short- and mediumterm velocity measurements were carried out on an outlet glacier (Kitdlerssuaq) from a local ice cap.
Location
Kitdlerssuaq is an outlet glacier from a local ice cap (Amitsulôq) situated some 50 km east of the Sukkertoppen Iskappe (Fig. 1). Kitdlerssuaq covers an area of c. 25 km2. The accumulation area reaches 1350 m above sea-level from where the glacier drains eastwards down to 780 m above sea-level (Fig. 2). The accumulation area is partly divided by a nunatak. The transient snow-line was about 1050 m above sea-level at the end of the ablation season in 1982. The glacier is coded No. 1 DG 16166 in the West Greenland Inventory and is located at approximately lat. 66°07′N. and long. 50°10′W.

Fig. 1. Sketch map of West Greenland showing location of the glacier Kitdlerssuaq. Dashed line on inland ice delineates boundary of area covered by the GGU glacier inventory.

Fig. 2. The ice cap Amitsulôq and the glacier Kitdleresuaq. The dashed line on Amitsulôq indicates the approximate boundary of Kitdlerssuaq.
Method
Variations in horizontal ice velocity were determined by surveying the angle between a fixed point and the stake through a period. Movements can be calculated from angular displacements and the distance from the instrument to the stake by assuming a direction of movement. However, in this article, velocities are given as angular velocities, thus avoiding any assumption of direction of movement.
Angle measurements were performed with a Carl Zeiss Jena Theo 010 A theodolite, with readings to 0.0002g (2cc). The theodolite has automatic vertical index stabilization. All angle measurements to stakes and fixed points were determined using a complete round expanded after transit of the theodolite to a double, complete round. According to the manufacturer the accuracy of angle measurements for double readings is ±0.0003g. As surveys were made during rather different climatic conditions, this value may be too optimistic. The standard deviation of horizontal angle measurements was determined using a fixed angle between two points on solid rock. One point was located on the same side, the other point on the opposite side of the glacier (Bs and F, respectively) relative to the survey point As (Fig. 2). Readings to fixed points were taken during the summer, at the same time as readings to stakes. The accuracy of horizontal angles were in this way determined to +0.0011g (n = 25). The accuracy of vertical angles to ±0.0008g(n = 33) and ±0.0015g (n = 26) for the fixed point on the same side (Bs) and on the opposite side (F) of the glacier, respectively (Table I). In addition, the accuracy at a given time of the vertical angle from As to F was determined three times. The accuracy of vertical angles was in this way determined as ±0.0003g (n = 10), ±0.0004g (n = 11), and ±0.0003g (n = 9).
Table I. Standard Deviations of Angle Measurements and Velocity Determinations

Results
Variations in the vertical velocity component
Frequently weather conditions prevented continuous series of measurements covering all stakes. During three periods, 10–13 July, 4–8 August, and 14–18 August, measurements twice a day were successful.
At the points 1100, 900, and F (Fig. 2) variations were pronounced with a repeated diurnal pattern, showing negative (downward) movement during the night and positive (upward) movement during the day (Fig. 3). An identical diurnal pattern can be recognized for points 950 and Bs, although the variations were less. (Only points with a diurnal variation are shown in Fig. 3 and Fig. 5).
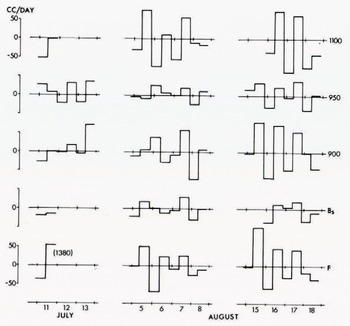
Fig. 3. 12 h vertical angular velocities. Positive values indicate upward movement with reference to the former line of sight.

Fig. 5. 12 h horizontal angular velocities. Velocity in relation to the fixed point Bs is shown as a full line, in relation to the fixed point F as a dashed line.
Thus diurnal variations in the vertical component of angular velocity were observed at several stakes on the glacier, but diurnal variations were also measured at the fixed points BS and F.
Observations at intervals of days (one day up to show almost the same characteristics as the 12 h observations (the most complete period, 5–19 August, is shown in Fig. 4). Variations at intervals of days in the vertical angular velocity are almost the same at all stakes on the glacier, indicating that variations are not random, but again identical variations were observed at the fixed points Bs and F.

Fig. 4. Verticular angular velocities at intervals of days.
Variations in the horizontal velocity component
The horizontal angular velocities relative to the fixed point Bs are shown as a continuous line in Figure 5. Diurnal variations are seen at stakes 6, 980A, 980B, and 900, whereas no distinctly diurnal variations are seen at the fixed point F. Most cases with diurnal variations have a larger nocturnal velocity (stakes 6, 980A, 980B, and stake 900 in July). Only at stake 900 is the nocturnal velocity the smaller (in August).
Velocities calculated with respect to the fixed point F are shown as a dashed line in Figure 5. Although the values are somewhat different, the trend of variations is identical at the individual stakes.
The most striking feature of variations at intervals of days is the different result obtained if either Bs or F were used as reference (Fig. 6). It is notable that variations at stake 900 and point F are identical, thus eliminating variations at stake 900 with F as reference. The lines of sight to both points are in almost the same direction.

Fig. 6. Horizontal angular velocities at intervals of days. Velocity in relation to the fixed point Bs is shown as a full line, in relation to the fixed point F as a dashed line.
Discussion
Vertical velocity variations
Levelling over distances greater than some hundred metres calls for adjustments with reference to the Earth’s curvature and to refraction.
Because of variations in air temperature near the surface, pressure, air moisture, and the wavelength of light, refraction varies with distance from the surface (Fig. 7). The change of direction of rays depends on the refraction index n, variation of n (dn), and the angle between the ray and the stratification of the air β (Reference BjerhammerBjerhammer, 1967, p. 196):

If the refractive index of the different air layers is known in the path of the ray, it is possible to calculate the vertical change of direction by integrating dβ over the total distance.

Fig. 7. Vertical refraction in a simplified, two-layer model. β denotes the angle between the ray and the air stratification, dβ the refraction, and γ the “refraction angle”.
Given a zenith distance v, the difference in height, allowing for both refraction and Earth curvature, is usually given as:

d being the distance between points, R the radius of the Earth, and k the constant of refraction (Reference MøllerMøller, 1980). The constant of refraction k = 0.13 is normally used. However, it has long been recognized that refraction varies systematically through the day. It is considerably larger in the morning and in the evening (0.21) than at noon (0.08) (Reference Jordan, Jordan, Eggert, Kneissl., Kneissl. and StuttgartJordan, 1956, p. 426–29). Above ice and land surfaces, a positive temperature gradient often develops during cloudless nights with low winds. During day-time, a negative gradient is developed above land surfaces because of heating, whereas a less positive gradient prevails above ice surfaces. Thus, in theory, one expects the same trend in refraction values throughout the day over ice and land surface.
The difference in height between two points is normally determined by simultaneous measurements from the points. The calculation can only be done by assuming that the lines of sight are congruent, and consequently the refraction constant k is the same for the two measurements. The difference in height between As and F was determined by simultaneous measurements from the two stations, and thereafter refraction constants for the sights from As to F in the period 14 August to 18 August were calculated (Table II), There is a distinct diurnal variation in this period, with higher values for the evening observations (just before sunset), but marked variations for the “day” and “evening” observations, respectively, are also seen. High values of the refraction constant are to be expected as the period is characterized by calm and cloudless weather, with a strong development of the positive temperature gradient.
Table II. Constants of Refraction k for the Sight As to F in the Period 14—18 August 1982

The calculated variation of the constant of refraction for observations across ice is far greater than the variation normally seen for observations across a land surface. That explains why the standard deviation for vertical angle measurements from As to F (across ice) is double the standard deviation for measurements from As to Bs (mainly across a land surface) (Table I).
In fact great variation of the constant of refraction across snow has previously been reported. Reference LichteLichte (1957) mentions constants of refraction between −1.3 and +3.0, with the most common values between −0.2 and +0.8. Reference PatersonPaterson (1955) found that the constant of refraction varied diurnally between 0 and 0.9, with extreme values reaching −0.5 and +1.8. (Note that the values for k given here are according to the German definition and are thus twice the English values).
It is likely that variations in vertical angular velocity of fixed points and stakes are caused by variations in the refraction. Evidently, the refraction must vary from point to point depending on the characteristics of local air masses and the angle between the ray and the near-surface layer of air. Unfortunately these parameters are impossible to determine, and consequently having determined the constant at a fixed point, the refraction variations cannot be compensated for.
The constant of refraction also varies from one day to another, depending on weather conditions. Probably the day-to-day variations cause the variations in the vertical angular velocity, shown in Figure 4, at fixed points as well as at the stakes.
The apparent variation of the height difference between the theodolite and stake 1100 during the period 13–19 August is shown in Figure 8. This could easily lead to erroneous conclusions about an increasing or decreasing height of the glacier surface, but in fact the angle variations at stake 1100 are identical with the angle variations of the fixed point F (Fig. 4). Probably the cause of the angle variations at stake 1100 and point F is the same, namely variations in refraction.

Fig. 8. Apparent vertical movement of stake 1100.
Horizontal velocity variations
On the basis of hourly observations of stakes on Fröya Gletscher in north-east Greenland, Reference BattleBattle (1951) concluded that the glacier moved about 1–2 cm more by day than by night. However, the movement during a 24 h period was rather irregular and, considering the accuracy of observations, the conclusion may not stand up to closer inspection.
Precise and detailed surveying were carried out by Müller and Reference IkenIken (1973), and Reference IkenIken ([1978]). In both cases, diurnal velocity variations on temperate glaciers in the Alps as well as on sub-polar glaciers on Axel Heiberg Island were found. Pronounced variations were found on sub-polar glacier and Reference IkenIken ([1978]) explained this as a result of lack of surface melt during a 9 month winter period and a thin cover of winter snow. If no surface melt takes place, subglacial channels become blocked. Consequently high water pressures are built up at the beginning of the ablation season, causing large sliding velocities. A thin snow cover permits a rapid development of a drainage system on the glacier surface in spring and a strong diurnal cycle of melt-water input into the glacier (Reference IkenIken, [1978]).
In view of these findings and the fact that there is no distinctly diurnal horizontal variation at the fixed point F, it may seem reasonable to accept diurnal horizontal velocity variations as real. More-over, in the literature refraction in the vertical plane has never been taken as implying horizontal refraction.
Special attention is drawn to variations at stake 6 (Fig. 5). Especially during the last period, variations are distinctly diurnal. However, the stake is situated in the accumulation area where such variations are not to be expected. Furthermore, variations in angular velocity fluctuate around zero, indicating a movement of the stake from side to side perpendicular to the line of sight. The stake moved 15 cm to one side during day-time 16 August and then 15 cm to the other side during the following night, according to 12 h measurements, but the total horizontal movement of stake 6 during the period 23 July 1982 to 9 September 1983 was only 23 cm. At this stake, diurnal variations in angular velocity probably do not reflect velocity variations. But angle variations are too clearly diurnal to be considered random diurnal variations of observations.
In this connection only the vertical refraction has been considered (e.g. Fig. 7). However, with respect to refraction due to variations in the air masses, the stratification of air is assumed to be parallel to the Earth’s surface. If it is not, rays of light refract in the horizontal plane as well.
With temperatures increasing upwards, the erroneous sight will be in the direction of dip of the air layers as seen from the measuring point, to the right if the dip is to the right, to the left if the dip is to the left. Mostly, the dip of air layers follows the glacier surface, indicating a dip down-glacier and towards the margins. Temperature gradients are usually more pronounced in night/evening situations, thus causing a stronger refraction.
Looking at points down the glacier (900 and F), the marginal dip as well as the down-glacier dip is to the right of the survey point As. Accordingly, an erroneous sight to the right is expected in the evening, giving too great velocities during day-time. In fact, stake 900 showed distinct diurnal variations with greater velocities during day-time in August. At the fixed point F, the same was observed on 17 and 18 August.
At the stakes 980A and 980B, slightly higher up the glacier, greater velocities were observed during the night. If these variations are to be explained as variations in refraction, the dip of the strata of air must be to the left with respect to the survey point As, and, because of the dip towards the margin, this could be true. Similarly the dip may be to the left at stake 6, thus allowing the apparent movement from side to side to be explained as a consequence of refraction variations. Three measurements to the fixed point 1380 agree well with observations of the stakes at the same time (10 to 11 July, Fig. 5).
Such considerations are rather speculative but it is important that variations of the horizontal angular velocity may be due to variations in the refraction, caused by variations (temperature, humidity, thickness, colour, direction and magnitude of dip) in the layers of air.
Two conflicting observations are added for stake 900. During the period 10 to 13 July, greater velocities occurred during the night, whereas in August greater velocities occurred during day-time. This deviation can hardly be explained by variations in refraction, but agree well with the expected development in the glacier-hydrological system. However, during the period 15 to 18 August, the glacier was covered with snow which had fallen during the days before and the ablations was small, less than 1 cm/d. Under such circumstances, no significant variations in the horizontal velocity are to be expected, though they cannot be excluded.
Summarizing, the apparent side-to-side movement at stake 6 may be caused by refraction variations. In the same way the variations in the horizontal angle velocity at other stakes may be due to variations in the refraction. It is not possible to conclude that any of the measured variations are variations in glacier velocity.
Concerning the variations over intervals of days (Fig. 6), almost the same can be said. The most striking example of the refraction effect is the elimination of the variations at stake 900 when the fixed point F is used as reference.
Conclusions
-
1. 12 h measurements of vertical angular velocities show distinct diurnal variations. They are explained by a diurnal variation in magnitude of the constant of refraction.
-
2. Similarly, variations in vertical angular velocity from day to day are considered to be an effect of variations in refraction, caused by differences in different layers of air.
-
3. Changes in refraction across the glacier surface may be responsible for 12 h and day-to-day variations in the horizontal angular velocity, but the effect of changes in the refraction is not so predictable as for vertical velocities, and some of the measured variations in the horizontal velocity may well be real.
Acknowledgements
I want to thank Professor Dr J.T. Møller and Dr N.T. Knudsen for valuable discussions. The field work was carried out with support from the Geological Survey of Greenland. The Director of the Survey is acknowledged for his permission to publish the results.


