

Introduction
Ice-core samples from the polar regions provide a rich source of information for deciphering the history of the climate (Reference Wolff and BourtronWolff, 2001). Most studies of polar ice chemistry have measured the concentration of impurities in melted samples, but in order to understand the physical and electrical properties of ice it is important to determine the microphysical location of the impurities. Determination of whether the impurities exist throughout the ice (either substituted in the lattice or at dislocations) or whether they are preferentially located along grain boundaries (where two grains meet) or at triple junctions (where three grains meet) will aid the interpretation of ice-core records and improve our understanding of the conditions under which the ice was formed.
Previous studies have used scanning electron microscopy (SEM) with energy-dispersive X-ray spectrometry (EDS) to locate major impurities in polar ice, following methods of preparation and analysis previously applied to frozen- hydrated biological specimens (Reference Mulvaney, Wolff and OatesMulvaney and others, 1988; Reference Wolff and MulvaneyWolff and Mulvaney, 1990). In recent years, systematic SEM-EDS studies of polar ice have been performed by Cullen and Baker (Reference Cullen and Baker2000, Reference Cullen and Baker2001, Reference Cullen and Baker2002), Reference BarnesBarnes (2002), Barnes and others (Reference Barnes, Mulvaney, Robinson and Wolff2002a, b, 2003), Reference Baker and CullenBaker and Cullen (2003), Reference Obbard, Iliescu, Cullen and BakerObbard and others (2003) and Reference Barnes and WolffBarnes and Wolff (2004). Although these analyses provided a significant contribution to the current understanding of the distribution of impurities in ice samples, investigation was limited by a few unavoidable issues. These include the large interaction volume beneath the sample surface from which X-rays originate (from a depth of up to 1.8 μm; Reference Mulvaney, Wolff and OatesMulvaney and others, 1988), the technique’s low sensitivity to certain elements of interest (e.g. C and N) and poor spectral resolution between neighbouring peaks of interest.
Other analytical methods which have also been applied to the study of impurity distribution in polar ice are micro- Raman spectroscopy (Reference Fukazawa, Sugiyama, Mae, Narita and HondohFukazawa and others, 1998) and, more recently, micro-X-ray fluorescence (μXRF) (Reference Morel FourcadeMorel Fourcade and others, 2005). The main problems encountered in micro-Raman spectroscopy are limited resolution (light microscopy is generally used to identify features, and, therefore image clarity is affected by the internal reflection and refraction of light) and a large analysis area (approximately 1 μm2, rendering the technique more suitable for the analysis of triple junctions than grain boundaries). Problems incurred during μXRF analyses are a long acquisition time for maps (up to 1.5 hours) and a large X-ray interaction volume. The collection of X-rays originating from depths of tens of microns renders the technique more suited for the analysis of large inclusions within the sample than of surface features. Each of the aforementioned techniques has different advantages and disadvantages, providing complementary analyses. A different and, as yet, unexplored analytical approach is that of secondary ion mass spectrometry (SIMS).
Dynamic SIMS is a well-established surface analytical technique that has been routinely applied to a variety of geological, metallurgical and electronic materials. However, cryo-preparation methods are not well-established techniques within the SIMS community. In principle, SIMS has several characteristics advantageous to the study of impurities in ice, primarily the ability to detect all elements and isotopes, higher sensitivity than many other analytical techniques and good spatial resolution. Although the technique is destructive (bombardment of the sample by the primary ion beam removes atoms and disrupts the lattice structure), it promises much improved detection limits (generally in the ppm or ppb range) over those of SEM and X-ray microanalysis (e.g. the limit of detection in bulk materials is approximately 0.1 wt.% (1000 ppm) for EDS (Reference GoldsteinGoldstein and others, 1992)). Unfortunately, quantification of SIMS data is difficult. The ionization probability for secondary particles is strongly dependent on the individual element and the chemical matrix, and the relative sensitivity of SIMS for pure elements varies over the periodic table (Reference SparrowSparrow, 1977). The presence of oxygen and other reactive elements can increase the ionization probability by several orders of magnitude, adding to the difficulty in quantifying the chemistry of samples with complex compositions. However, there is considerable potential for qualitative surface mapping of monatomic and polyatomic ions as well as the acquisition of depth profiles, allowing a more complete three-dimensional chemical analysis than is possible using SEM and sample etching (sublimation under vacuum).
This study aims to assess the suitability of cryo-SIMS for the analysis of polar ice samples and to compare results with those obtained in previous SEM-EDS analyses. A sample of naled ice was chosen for this initial experiment. While the bulk impurity content may be higher than in glacier ice, the soluble impurities are the same, and many of the distributional trends at the grain scale are similar. The high amount of impurity was intended to maximize the chances of obtaining clear, unambiguous results.
Experimental Procedure
Principle of SIMS operation
The principles and operation of SIMS are described in detail in Reference Benninghoven, Rudenauer and WernerBenninghoven and others (1987) and Reference Briggs and SeahBriggs and Seah (1987) and will only be briefly explained here. When an ion beam is incident on a sample, it evokes the emission of various surface particles which may be sputtered as neutral atoms, atoms in an excited state, positively or negatively charged ions, multiple charges, cluster ions (two or more atoms as a single unit) or molecular fragments. This is illustrated in Figure 1. The majority of emitted particles are neutral (>99%) but it is the detection and analysis of the charged secondary particles that form the basis of SIMS analysis. The sputtered ions are not necessarily representative of the exact chemistry within the sample;for example, phosphorus (P) tends to be emitted as the negative polyatomic cluster PO2 – when oxygen is present, but this does not mean that it occurs as this species in the sample. The mass:charge ratio (in Daltons) is used to identify which species are present and, generally, species are only singly charged. Electronegative elements (e.g. Cl, F, O) are more likely to produce negative ions, while electropositive elements (e.g. Na, Mg, K) will more readily form positive ions. The ions are emitted over a wide range of energies, due to the nature of the cascade collisions within the sample, and originate from the outermost surface layers, with a typical escape depth of 1 nm or less. Ion-induced electrons are also emitted from the surface and can be used to form secondary electron images.
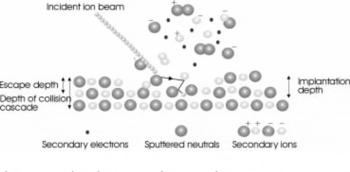
Fig. 1. Ion-induced emissions from a surface.
An inherent drawback of SIMS is the potential for emission of different ions with the same mass:charge ratio. A pertinent example in the work carried out on samples of ice is the interference of the sulphur, 32S–, and 16O2 – ions. Identification of the different ions is dependent on the mass resolution of the spectrometer.
Instrumentation
The SIMS equipment was constructed in-house at the University of Bristol and is shown schematically in Figure 2. The instrument comprises a focused gallium ion gun (FEI electronically variable aperture type) attached to a Vacuum Generators model 7035 double-focusing magnetic sector mass analyzer. An Everhart–Thornley electron detector is used for the acquisition of secondary electron images of the sample. The spatial resolution of secondary electron images and ion maps is determined by the primary ion beam diameter and is typically between 100 nm and 1 μm.

Fig. 2. Schematic diagram of the magnetic sector SIMS instrument modified to permit cryo-analysis.
Analysis can be performed in both positive and negative modes and the principle of operation is outlined for positive ions as follows. The sample is bombarded with a primary beam of 25 keV Ga+ ions, and a potential of 4 kV is applied to the sample stage to accelerate the secondary ions emitted from the sample surface through an ion-extraction lens system. They then travel through an electrostatic energy filter with an adjustable pass energy and into the magnetic mass filter. The ions are channelled through a final slit, the width of which determines the overall mass resolution of the spectrometer, and into a channeltron detector. The spectrometer has a high transmission efficiency of secondary ions from the sample to the channeltron, with the option of high mass resolution (but at a cost of lower transmission) allowing a spectral resolution M/ΔM (where M is mass and ΔM is the peak full-width–half-maximum (FWHM)) of several thousand. For routine analysis, where mass interference for the elements of interest is minimal, low spectral resolution with high transmission is selected with sensitivities in the ppm range, depending on the element analyzed.
The instrument operates under ultra-high vacuum conditions with a typical main chamber operating pressure of 2 x 10⁻⁸ mbar (in cryo-mode) and an ion gun pressure of ~Ί0¯8 mbar. Samples are inserted through a separate preparation chamber. The sample surface is presented to the ion gun at an angle of 45° and the stage can be manipulated in the x, y and z planes. The PC control software, Pisces, was written in-house (Dayta Systems Ltd, http://daytasystems.co.uk.) to allow control of spectral acquisitions, beam scanning, image acquisition and depth profiling.
An Oxford Instruments Electron Microscope CryoTrans 1500 Cryo-Preparation System was adapted (Reference DickinsonDickinson, 2005) for connection to the existing magnetic sector SIMS instrument. The preparation stage is directly cooled from the liquid nitrogen dewar, while the analysis stage is indirectly cooled by the continuous flow of nitrogen gas (pre-cooled by passing through liquid nitrogen). The temperature of the analysis stage was maintained at a temperature between –170°C and –192°C during analysis, although the gas flow through the stage was reduced during the acquisition of images at high magnification to prevent vibration.
Sample preparation
The ice was naled ice from in front of midre Lovénbreen in northwest Spitsbergen, the largest island in the Svalbard archipelago. Midre Lovénbreen (78°53’N) is a 6 km2 polythermal glacier, 6 km from the Ny-Alesund research station. Cores of naled ice were collected using a PICO (Polar Ice Coring Office) ice auger and transported to the United Kingdom by a combination of freezer transport and packing in dry ice.
Sample preparation would ideally have followed standard core subsampling and SEM preparation methods previously described by Reference BarnesBarnes (2002), Reference Barnes, Wolff, Mallard and MaderBarnes and others (2003) and Reference MallardMallard (2005) to produce well-mounted flat samples free from surface frosting. However, the cold room and microtome facilities at the University of Bristol were unavailable at the time of the experiment, and the preparation of samples for this cryo-SIMS investigation was somewhat limited by the available equipment. Consequently, subsampling of the naled ice core was conducted at –20°C in an open chest freezer using a hacksaw and razor blade (pre-cooled to –20°C) to remove pieces of core. Although this resulted in increased fracturing of the samples, no melting was observed under the hacksaw blade.
The subsamples of ice were stored at –20°C during transfer to the Interface Analysis Centre, University of Bristol, and until required for mounting. A (somewhat crude) low-temperature environment was created within a cool box by pouring liquid nitrogen (LN2) over a Teflon- coated metal plate in the base of the box. A cooled razor blade was used to cut pieces of ice approximately 5 mm in diameter and 3 mm high and to prepare a relatively flat upper surface for SIMS analysis. Samples were pressed onto a thin layer of Tissue-tek® (a methyl cellulose mounting solution) spread onto an aluminium stub in the sample sledge. The tweezers and razor blade used for cutting and positioning the ice were pre-cooled in LN2, and the Tissue- tek® was stored close to its freezing point (–3°C) so that it set immediately upon contact with the samples. There was no visible melting of samples prepared by this method. The mounted samples were then plunged into LN2 and inserted into the cryo-preparation chamber on the SIMS instrument.
During the sample preparation and transfer procedure, some frosting of the surface occurred from residual water vapour in the LN2 and the low-vacuum environment of the preparation chamber, making it necessary to sublime the sample in the main chamber of the SIMS instrument. The frost was removed by gradually raising the temperature of the analysis stage to –90°C while watching the sample through a viewing port. Following sublimation of the frost, the sample was withdrawn to the preparation chamber and sputter-coated with gold at 4 mA for 1 min before reinsertion to the main cryo-stage (at –170°C or below). The gold coating ensures a conductive surface to prevent charging of the sample when probed with the charged ion beam. As the beam sputters away the gold layer, Ga+ ions become implanted in the sample, continuing the role of charge dispersal. The mass:charge ratios of Ga+ (69 Da) and Au+ (197 Da) do not coincide with any ions of interest in this study.
SIMS Analysis
Once a feature of interest had been identified on the sample surface, the region was imaged for a short duration until the selected ion signal (in this case O– or Na+) remained constant, indicating the removal of the gold layer. Secondary electron images, spectra and ion maps were collected using a primary ion beam of 1 nA and a diameter of 100–200 nm, corresponding to a current density of 5 A cm–2. Images were obtained in 640 x 480 pixel format, averaging over four scans and taking 90s to acquire. Contrast and brightness were adjusted as appropriate. Spectra were obtained by scanning through the mass range of interest, usually 0–100 Da in 0.05 Da steps, each with a duration of 100 ms (giving an overall time of 200s). A magnification of between x150 and x500 was used (corresponding to square areas of analysis with sides of 870 and 260 μm, respectively).
Results
Theoretical considerations of the sputter rate
The actual rate of sputtering of materials from the surface is difficult to measure but can be estimated using Monte Carlo simulations of ion sputtering. The software used in this study was SRIM2003 (available from http://www.srim.org/). As a first approximation, a target of frozen water at the density of pure ice, as measured by Reference HobbsHobbs (1974) to be 0.932 g cm–3 at –160°C, was used in the simulations. A sputter yield of ~3.1 H2O molecules per incident Ga+ ion was calculated by SRIM2003. From this, the sample etch-rate was estimated to be ~0.6 nm min–1 (for a 1 nA ion beam at a magnification of x 500) using calculations described by Reference Ziegler, Biersack and LittmarkZiegler and others (1985). On this basis, < 0.9 nm of ice is removed during the acquisition of each ion map under the conditions used in this study. Analysis of a single site could involve the acquisition of 10–15 ion maps, yet remove a depth of only 9-13.5 nm from the sample surface. For a lower magnification the rate is reduced;for example, at x 300 the etch-rate is ~0.2 nm m¡n–1. Thus, under the experimental conditions used, erosion of the sample surface is sufficiently slow to permit thorough analysis of features of interest.
Identification of the main structural features of ice
On the sublimated, gold-coated sample, the main structural features of ice were identifiable in the secondary electron (SE) images as they are in cryo-SEM. Examples of such features are shown in Figure 3. Grain boundaries, triple junctions, bubbles, cracks, pore spaces and filaments of impurity were all visible. In common with the behaviour of filaments in SEM, the example shown in Figure 3c appears to have broken and partially curled up during the course of imaging (see inset), which may be a result of the heating effect of the ion beam.

Fig. 3. Ion-induced secondary electron images showing common structural features. (a) Three grain boundaries meeting at a triple junction in a bubble. A crack is visible running down the image, crossing the bubble edge, and is indicated by the two arrows. Scale bar 500 μm. (b) Three grain boundaries meeting in a triple junction. The righthand boundary contains a coiled filament, which is indicated by the arrow. Scale bar 100 μm. (c) Pore space with clear grain boundaries. Two triple junctions are visible and the grain boundary grooves appear to contain continuous filaments of impurity. The inset image shows part of the same pore space several hours later; the filament in one of the boundaries has snapped and curled up (indicated by the arrow), possibly due to the ion beam. Scale bar 500 μm.
SIMS analysis of individual features
General overview
Mass spectra and ion maps were collected from two regions of interest on the sample, as identified by secondary electron imaging of the surface. The first feature was a triple junction with a large impurity particle, and the second was a grain boundary with several small suspected precipitates of soluble impurity. Mass spectra were collected to identify peaks of interest and then individual ion maps were acquired. Both positive and negative SIMS analyses were performed, which necessitated a slight realignment of the equipment after switching between modes. Consequently, a slight change in the area of analysis is observed for positive and negative analyses performed at the same magnification. In order to facilitate comparison between ion maps acquired in different modes, SE images were collected of areas of interest prior to the acquisition of ion maps, thus permitting easy tracking/location of the main features of interest. No charging effects were observed during analysis.
A triple junction
The first SIMS study was performed on a region containing three grain boundaries meeting at a triple junction with what appeared to be a concentration of impurity located on the surface. Spectra were acquired to identify ions of interest, whose distributions were subsequently mapped. Figure 4 displays the positive and negative mass spectra (scaled to show the main peaks of interest) acquired from the region. Many of the peaks correspond to the complex ionization products of the ice molecules rather than any impurities contained in the ice. Some of these ice-derived ions possess the same masses as other single elemental ions, leading to mass interferences, as previously described. Examples of these occur at masses 32 and 34, where O2– and H2O2 – ions hinder the detection of any sulphur 32S– and 34S– that may be present. Unless otherwise indicated, the peak labels and ion maps represent the most common isotope of an elemental ion or the complex ion believed to be the most likely to occur.
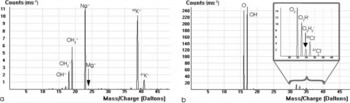
Fig. 4. Spectra acquired from the region containing the triple junction. (a) The positive SIMS spectrum. (b) The negative SIMS spectrum. Inset shows the region between 30 and 40 Da, enlarged to display the peaks.
In the positive spectrum, significant peaks (aside from the OH cluster ions from the ice matrix) are Na+ and K+ while Mg+, Si+ and Al+ were also present at lower count rates. In the negative spectrum, the only (non-matrix) peaks of interest were Cl– isotopes. No counts were detected at masses which would indicate biological matter, for example 12, 24 and 26 Da which represent C–, C2 – and CN–, respectively.
Secondary electron images of the triple junction and particle of impurity are shown in Figures 5 and 6 with the negative and positive ion maps acquired from the regions, respectively. It should be noted that analysis in positive SIMS mode was performed at a higher magnification than the negative analyses. The shadow effect visible near the particle in the SE images is due to the surface topography. As a result of the crude sample preparation, the particle is standing proud of the surface, thus permitting fewer electrons to be emitted from the region behind it. The dark region in the bottom righthand corner of the ion maps is also an effect of the sample topography and alignment;the surface probably sloped away from the detector. The sensitivity settings were adjusted as necessary for individual maps, and the brightness and contrast of images have been adjusted for presentation purposes.

Fig. 5. SE image and selected negative ion maps from an area containing three grain boundaries meeting at a triple junction with a visible concentration of impurity. (a) SE image; (b) O–; (c) 35Cl–; and (d) 32 Da. Scale bar 200 μm. The Cl– image was acquired using a higher sensitivity setting than the O– map (due to the obvious abundance of O throughout the sample).

Fig. 6. SE image and selected positive ion maps from an area containing three grain boundaries meeting at a triple junction with a visible concentration of impurity. (a) SE image; (b) Na+; (c) Mg+; and (d) K+. Scale bar 100 μm. Images were acquired using the same sensitivity settings.
35Cl– and 37Cl– (not shown) were detected in the impurity particle on the surface, the rough areas of the surface and within the triple junction. These observations are consistent with the ability of Cl to substitute for H2O in the lattice (Reference Petrenko and WhitworthPetrenko and Whitworth, 1999) and with the detection of Cl– in bright spots on etched grain interiors and as filaments at grain boundaries in SEM studies (Reference BarnesBarnes, 2002; Reference Baker and CullenBaker and Cullen, 2003; Reference Barnes, Wolff, Mallard and MaderBarnes and others, 2003; Reference Obbard, Iliescu, Cullen and BakerObbard and others, 2003; Reference MallardMallard, 2005). The signal originating from O– was mapped across the whole region of analysis, with a darker region corresponding to the impurity at the triple junction. This suggests, as would be expected, that the impurity particle contains a lower proportion of ice from which O–ions could be generated. When mapped, the negative ions at 32 and 34 Da (not shown) showed the same pattern of distribution as the O– map. This demonstrates how the occurrence of polyatomic oxygen or OH ions would hinder/ prevent the detection of any signals arising from the isotopes of sulphur, 32S and 34S.
The positive ion maps confirmed the presence of Na+, K+ and Mg+ in the particle at the triple junction. Na+ and K+ were also detected in bright spots in the grain interiors (particularly in the rough areas). There was also some signal brightness at the lower and righthand boundaries in the Na+ and K+ maps. However, it is impossible to discern whether these signals at the grain boundaries arose from either a discontinuous impurity or/and the formation (by local diffusion) of impurity spots at the edges of the grain boundaries following sublimation. Mg+ was not observed within the grain boundaries, although a faint line of dots did appear to lie on the lefthand boundary. Low Al+ and Si+ signals were present throughout the whole region of analysis and showed no localization at the particle on the triple junction (results not shown).
Grain boundary
Discrete particles of impurity, probably precipitates, were identified at a grain boundary. As in the previous example, spectra were first acquired to identify ions of interest, whose distributions were subsequently mapped. Positive and negative spectra (not shown) confirmed that the particles of impurity in the grain boundary were similar in elemental content to the impurity at the triple junction in the previous example. Ion maps are shown in Figure 7, alongside an SE image of the surface (acquired in negative mode). The realignment necessary between positive and negative SIMS analyses means that the grain boundary appears at a slightly different angle in the negative (Fig. 7a and b) and positive (Fig. 7c–e) images. The brightness and contrast of all images have been adjusted for presentation purposes, but all maps were acquired at the same sensitivity settings.
The chlorine isotopes, 35Cl– and 37Cl– (not shown), were detected in the small particles along the grain boundary but not within the boundary, as observed in the previous region. The Cl– maps also showed a diffuse distribution over the entire sample, with higher signals originating from the rougher areas of the surface. No features of interest were evident in the oxygen (O–) map (not shown) acquired from the region, only faint variations in brightness which indicated the path of the grain boundary.
The Na+ and K+ maps displayed the same pattern of distribution, with obvious concentrations of both ions in the particles along the boundary and a diffuse brightness that correlated with the rougher areas of the surface (similar to the Cl– signal). These distributions are consistent with the previous analysis of the triple junction region. The presence of K+ at the grain boundary in addition to Na+ and Cl– is interesting, as it was not commonly found in previous SEM- EDS studies, except in alumino-silicate dust particles (Reference MallardMallard, 2005). However, as naled ice is derived from sub-glacial meltwater that has spent considerable time reacting with finely crushed rock, soluble Mg and K would originate from crustal (mineral) sources as well as sea-salt aerosols.
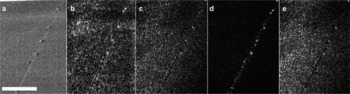
Fig. 7. SE images and selected ion maps from a grain boundary with visible impurity particles. (a) SE image; (b) 35Cl– ; (c) Na+; (d) Mg+; and (e) K+. Scale bar 100 μm.
The maps for Al+ and Si+ (not shown), however, show no localization at the particles on the boundary, suggesting that the particles are not dust and are more likely to be soluble impurities, possibly present as precipitates. This result appears to corroborate the SEM observations that the thickened impurity-filled areas of grain boundaries found in the naled ice need not contain insoluble dust particles (Reference MallardMallard, 2005). Unfortunately none of the impurity particles observed during this SIMS experiment appeared to be pinning boundaries and so it was not possible to confirm that this could occur. The higher sensitivity of SIMS would increase the probability of detecting small dust particles, although, due to the very small sampling volume, extended depth profiling would be required to rule out a dust particle at the depths involved in the SEMEDS interaction volume (~2 μm deep).
The Mg+ map is possibly the most interesting: not only was the signal highly concentrated in each of the particles at the boundary, it was also detected along the length of the grain boundary, unlike the previous region. This suggests that Mg is present in most of the grain boundary plane and not just in the discrete particles of impurity. Although Mg was identified in discrete particles at grain boundaries in naled ice during previous SEM-EDS studies by Reference MallardMallard (2005), it was not detected in areas of grain boundaries without obvious impurity (such as particles or filaments). Furthermore, in most EDS analyses the Mg peak was unclear due to its proximity to the larger Na peak, often only occurring as a slight shoulder (or change in slope) on the side of the broad Na peak.
In summary, an impurity containing Na, Mg, K and Cl was found at a triple junction, and discrete particles of impurity (possibly precipitates) containing Mg, Cl, Na and K were identified along a grain boundary. Both of these results corroborate SEM-EDS of naled ice samples (Reference MallardMallard, 2005). In both regions of analysis, Na, K and Cl were also detected in grain interiors. Mg, however, was detected only along the boundary and not in the grain interior, confirming that the large Mg ion is strongly segregated to grain boundaries and is uncommon in grain interiors.
Discussion
As observed in both areas analyzed, some surface roughness from the basic sample preparation and brief sublimation was apparent. This roughness appears to influence the observed distribution of some of the impurity species, possibly through a combination of its effect on the correct orientation of the surfaces with respect to the spectrometer (i.e. topographical effects) and the concentration of impurity species during the initial sublimation period. The bright areas in the Cl–, K+ and Na+ maps (away from the grain boundary and the triple junction) coincide with the roughest parts of the grain interiors. In cryo-SEM, etching (sublimation under vacuum) is known to produce surface roughening, and impurities gradually become detectable at the apexes of facets on the surface. It is possible that in this experiment the process may have become apparent at a much earlier stage, due to the higher sensitivity of SIMS. In this case the sample preparation was limited by the facilities available at the time, but should the methods developed in previous SEM investigations be followed (Reference BarnesBarnes, 2002; Reference Barnes, Wolff, Mallard and MaderBarnes and others, 2003; Reference MallardMallard, 2005) then many of the preparation-induced artefacts would be avoided. Improved surface preparation would probably avoid variations in surface roughness by creating flat, frost-free surfaces, thus avoiding the need for sublimation.
The ion maps obtained from both regions were consistent with the apparent lack of filaments in the grain boundaries, as observed in the SE images. However, it was impossible to discern whether the Na+ and K+ signals at the grain boundaries in Figure 6 arose from either a discontinuous impurity or/and the formation (by local diffusion) of impurity spots at the edges of the grain boundaries following sublimation. In future work, the acquisition of maps averaged over a greater number of scans and at higher magnifications may help to distinguish between impurities in grain interiors and those originating from, or lying in, the grain boundary plane. These analyses also reinforce previous observations (Reference Barnes and WolffBarnes and Wolff, 2004) of highly heterogeneous impurity distributions, at the grain scale in ice.
In general, the results obtained in this initial investigation into cryo-SIMS of naled ice were positive and suggest the application is worthy of further investigation for the study of glacier ice samples that have paleoclimatic or other value. The production of appropriate standards and the complex modelling of the ionization probabilities of all the interacting components of the chemical matrix limit the ability to conduct quantitative analysis of many materials by SIMS. In other solids, ion implantation has successfully been used to produce standards for SIMS, but the unstable nature of ice is likely to preclude this method. However, even if quantification remains problematic, the current cryo-SIMS technology has considerable potential for good qualitative ion mapping of surfaces. The technique also provides confirmation of impurity segregation to grain boundaries and supports the heterogeneous distribution of impurity at grain boundaries, including the likely role of temperature-dependent precipitation of impurities in ‘locking’ impurities in position so that they do not only concentrate in the vein system (as thermodynamics would suggest).
There are many areas in which qualitative SIMS could be used to test theories or provide information not discernible by SEM-EDS. For example, the high sensitivity of SIMS could potentially permit further testing of the suggestion by Reference BarnesBarnes (2002) and Reference Barnes, Wolff, Mallard and MaderBarnes and others (2003) that it is energetically favourable for a monolayer of impurity to exist at grain boundaries before triple junctions start to fill. Cryo-SIMS should also allow organic materials (such as bacteria and algae) to be recognized in ice, via detection of commonly generated ions such as C2 – and CN–. Chemical identification of organic material in addition to morphological identification of possible bacteria and algae in snow and ice samples could provide important supplemental information to the initial cryo-SEM work on bacteria described in Reference MallardMallard (2005). The application of SIMS’ depth-profiling capability remains unexplored on ice samples, but could be used to examine the heterogeneity of impurity localization at grain boundaries. There also exists a potential application to the study of the chemical environment surrounding any organic material identified, which may help determine the food sources of micro-organisms.
The main limitation of SIMS is the wide variation in sensitivity for different ions and the problem of distinguishing between polyatomic cluster ions with the same masses as monatomic ions of interest. These two issues require further investigation to determine the specific limitations of SIMS for detection of the main species of interest in natural ice samples. In particular, it would be valuable to determine the lower detection limits for each impurity element/ion (in an ice matrix). For this, artificial standards could be created, by using the method described in Reference Reid, Potts, Oates, Mulvaney and WolffReid and others (1992) in which high-molarity solutions were frozen into the holes of track-etched polycarbonate filter papers. This method is considered to provide the best possible chance of nearhomogeneous freezing, thus avoiding the segregation of impurities to boundaries.
It would also be valuable to determine whether sulphur could be detected by modifying the spectrometer settings (to produce higher mass resolution) or by identification of a cluster ion containing sulphur. Analysis of a laboratory- prepared ice sample known to contain sulphur would be an obvious first step. As much of the sulphur present in ice is suspected to be in the form of sulphate ions (mass 96), it is possible that these larger ions would be sputtered and detected, whereas the sputtering of O6 – ions would be less likely to occur. It is important to note that the separation of sulphur peaks from the aforementioned oxygen clusters may be more readily achieved in different instruments with appropriate spectral resolution. The instrument used for this study has not been optimized for spectral resolution.
Conclusion
Cryo-SIMS was demonstrated to be a useful tool for the analysis of polar ice samples. Structural features were identified from ion-induced secondary electron images of the surface, and two regions of interest were analyzed. Discrete particles of impurity containing Na, Mg, K and Cl were identified along a grain boundary and at the site of a triple junction, corroborating similar findings from previous SEM-EDS analyses of naled ice samples. In the maps acquired from both sites, Na, K and Cl were also present in grain interiors. Additionally, Mg was identified along the full length of a grain boundary.
Although SIMS is not free of problems and much work remains to optimize the methods of analysis for this type of sample, the technique was shown to provide complementary analysis to SEM-EDS for the study of polar ice, rapidly providing ion maps that qualitatively illustrate the ion distributions previously described by EDS.
Acknowledgements
Ice-core collection was funded by a NERC Case (British Antarctic Survey) studentship to D. Mallard.


