

Introduction
Biological and glaciological systems in polar regions are undergoing rapid and intricate changes as a result of climate warming, yet scientists’ access to these sites is generally limited to a few months per year. Moreover, in areas of deep-field polar logistical operations, a critical safety consideration is the real-time visibility, surface contrast, weather conditions and surface roughness (e.g. for aircraft snow runways) at remote camps with no on-site observers. While current sub-meter resolution satellites such as GeoEye and WorldView-2 can provide important detailed image-based data, cloudiness and scheduling demands on the satellites make it difficult to assemble long time-series data for an area. Near-real-time acquisitions are also difficult. For many applications in Earth and life sciences, a continuous monitoring record is necessary for detailed change detection or process studies. Satellites also cannot provide in situ measurements of weather or firn properties. An in situ instrumentation approach, in concert with remote sensing, can greatly augment glaciological process studies, weather monitoring and observations of biological systems for polar areas of high interest.
In situ telemetered observation stations for polar research have evolved considerably in the past few decades. Such observations began with Argos-system uplinked automated weather stations (AWS) developed in the late 1970s (Reference Stearns and WendlerStearns and Wendler, 1988). These have been considerably augmented in recent years to include a host of snow and energy-balance measurement sensors (e.g. Reference Steffen and BoxSteffen and Box, 2001; Reference Van den Broeke, Van As, Reijmer and Van de WalVan den Broeke and others, 2004; Reference Argentini, Pietroni, Cimini, Visconti and MarzanoArgentini and Pietroni, 2010). Communications have improved by using larger-bandwidth telemetry available on the Geostationary Operational Environmental Satellite (GOES). However, these communications are generally uplink only (i.e. station-toobserver), and the GOES satellites are unusable in the highest-latitude areas because of their near-equatorial orbit.
In the past decade, in situ studies of snow and ice processes or wildlife species have also identified a need for frequent images of specific sites, to track activity or movement of animals or to follow the causal steps in physical events (Reference Ross, Okal, Thom and MacAyealRoss and others, 2004; Reference Locke, Cline, Wetzel, Pittman, Brewer and HarvesonLocke and others, 2005; Reference Newbery and SouthwellNewbery and Southwell, 2009). Images generally provide a non-quantitative insight into the context of measured changes at a site, but, as we show later, can also be used to make quantitative analyses (e.g. Reference MacAyeal, Okal, Thom, Brunt, Kim and BlissMacAyeal and others, 2008).
As more detailed information about conditions, processes and environmental and ecological events is now desired, an increasing need for in situ image data and geophysical measurements has emerged. This requires a larger bandwidth than is available via Argos telemetry, and the complexity of managing power and data collection for year-round in situ observations requires two-way communications, i.e. the ability to change data acquisition protocols on the system from a remote location as well as the ability to send information from the observation site. Onboard control of the communications system, data collection and sensors also requires a better processing capability. To address this need for a group of related research objectives, an automated station configuration now called the Automated Meteorology–Ice/Indigenous species–Geophysics Observation System (AMIGOS) has been developed over the past decade.
The AMIGOS set-up was originally created to support logistical needs at remote snow and blue-ice runways for a commercial company (Antarctic Logistics and Expeditions (ALE)), but evolved into a multisensor geophysical and biological monitoring system for polar fieldwork as well as logistical support. AMIGOS stations allow for year-round monitoring of weather and surface conditions and, over time, compile information regarding changes in local patterns, sastrugi formation, melt and melt pond evolution, fracturing, ice flow and climate changes (via firn temperature profiling). At present, the AMIGOS design can combine weather and image data, precision GPS, solar shortwave downwelling radiation and surface reflectivity, and thermal profile sensors, with a solar-panel–battery-power system and, importantly, an Iridium satellite modem system for both data transmission uplink and system management downlink to the operating system (OS). The improved two-way communication facilitates post-installation changes to the acquisition scheme, data download, internal software or sensor configurations. Moreover, the Iridium system of near-polar satellites has excellent connectivity at all latitudes.
Amigos and Precursor System Installations and Applications
Several station designs and component configurations are shown in Figure 1a–g. Figure 1h is a map of past and current AMIGOS and pre-AMIGOS station locations. Both the locations and the configurations of the stations illustrate the range of applications of the AMIGOS to different problems in Antarctic measurement and monitoring.
Weather and visibility monitoring of remote polar landing strips
Aircraft landings and take-offs at remote blue-ice runways in Antarctica are events that need full meteorological support, weather observations and forecasts. However, early in a season, and during periods of low use, it is often not possible to maintain a human presence at these remote locations. To accomplish the observational need in an efficient manner, ALE contracted one of us (R.R.) to have a series of camera and weather-instrumented stations built and installed near blue-ice runway thresholds at Patriot Hills, Blue One (near Novolazarevskaya station), Union Glacier and the Thiel Mountains near King Peak. This effort began in 2002 using a fixed-position web camera that internally ran an embedded Linux OS. Subsequently, stations were improved to AMIGOS status, with the addition of the Triton processor (described below), a steerable web camera and full weather instrumentation. As of early 2012 there are three AMIGOS stations operating as runway weather and visibility observation stations, monitoring the blue-ice runway at Union Glacier (Wx7 AMIGOS, 79°46′ S, 83°16′ W; Fig. 1d), a skiway in the Thiel Mountains (Wx8 AMIGOS, 85°21′ S, 88°12′ W) and weather conditions over the Ronne Ice Shelf from Sky Train Ice Rise (Wx1 1 AMIGOS, 79°35′ S, 79°10′ W).
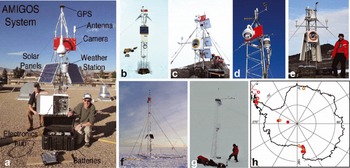
Fig. 1. Recent AMIGOS stations using the Triton computer board. (a) Test system installed on the building roof at the US National Snow and Ice Data Center. This system is configured for in situ glacier observations, showing some of the main sensors, solar panels and battery box (not shown are the 12 m resistance thermometer string and the albedometer). (b) Scar Inlet Ice Shelf AMIGOS system, showing the battery box in a ∼80 cm deep snow pit and a third 40 W solar panel (‘fisheye’ lens view). (c) High-resolution camera AMIGOS station installed at Cape Disappointment, north of the Scar Inlet Ice Shelf ice front on the Antarctic Peninsula. (d) ‘Wx7’ AMIGOS station at Union Glacier, Antarctica, showing a line-of-sight radio antenna in addition to the Iridium system for data transmission. (e) High-resolution AMIGOS camera system installed at the Cape Royds Adélie penguin colony. For this very windy site, a robust tower mounting system was used. (f) AMIGOS system installed on the A22a iceberg in March 2006. A tripod stand of planks and steel tubing was affixed to keep the station upright after extensive surface melting. (g) Camera-less system installed on the high-accumulation Bruce Plateau area of the Antarctic Peninsula, at the LARISSA Site Beta ice-core site. The site accumulated 7 m of snow in 8 months. (h) Map of Antarctica showing the location of operational (solid circles) and past (open circles) AMIGOS and related stations.
The Wx7 station has an additional communications system that permits data transfer to the main station hut when the Union Glacier camp is occupied (8 km distant), bypassing the use of Iridium communications and allowing full-time, full-data contact with the station via UHF line-ofsite radio (data rates up to 400 kbps). The Wx11 station has a full weather-station package in addition to a Sony pan–tilt–zoom (PTZ) camera. The station gives the ALE meteorological officer an early indication of cloud or wind changes that may be headed towards the Union Glacier area, disrupting aircraft movement.
Glaciological observations in dynamic and high-risk areas
Beginning in early 2004, a Linux-based, multisensor, Iridiumuplinked system that was the precursor to the AMIGOS station design was deployed at a series of sites to study calving, rifts, blowing snow and iceberg drift processes (Reference Ross, Okal, Thom and MacAyealRoss and others, 2004). These sites were potentially unstable because of the proximity of a calving face or iceberg edge, or increased crevassing and calving activity due to intense surface melting and increasing ocean temperature. The first pre-AMIGOS installation for glaciological work was ∼50 m from the edge of iceberg C-16 in the southwestern Ross Sea in January 2004 (77°03′ S, 168°16′ E; Reference MacAyeal, Okal, Thom, Brunt, Kim and BlissMacAyeal and others, 2008). At that time there were several large icebergs in the region. Their movements were constrained by interactions with seabed shoals, islands and the adjacent icebergs (Reference MacAyeal, Okal, Thom, Brunt, Kim and BlissMacAyeal and others, 2008). The C-16 pre-AMIGOS station observed the evolution of the iceberg edge and recorded both the motion of C-16 and, via the camera, the motion of the adjacent B-15A berg. The station was destroyed when B-15A collided with C-16 near the installation and buried it under ice and snow blocks transported by the collision.
Another pre-AMIGOS glaciological station was sited ∼3 m from the north edge of a rift on the Ross Ice Shelf, at 78°08′ S, 178°30′ W. This was called ‘Nascent Cam’ in the anticipation that a new iceberg was forming at the site by extension of the rift. The station used a steerable and a stationary web camera to observe the complex interaction between blowing snow and the rift, cornice formation and collapse, and the response of floating snow and ice within the rift to widening of the rift. The system operated for 136 days, between 3 November 2004 and 19 March 2005.
In March 2006, two stations using a new processing board (the Triton), and including a steerable web camera and limited weather instrumentation, were placed on two icebergs offshore of the northeastern Antarctic Peninsula. These stations are considered the first AMIGOS because of the improved computing system. They were installed on the UK211 and A22A icebergs (initially at 65°13′ S, 57°58′ W and 63°14′ S, 51°46′ W, respectively) with the intent of observing the evolution of the iceberg surface and ice edge calving as the icebergs drifted north into climate conditions in which they would become unstable and rapidly break up. The systems were installed on 3 March 2006 (UK211) and 19 March 2006 (A22A) via helicopter-supported overnight camps from the Argentine icebreaker Almirante IrÍzar. The stations reported data for the next 10 months, as the icebergs drifted to 48°26′ S, 37°40′ W and 53°40′ S, 34°40′ W, respectively. During the austral autumn and winter drift, one of the stations (on UK211) was completely buried by snow, lost power and ceased communicating. This system then regained power and communication after a 4 month hiatus as warmer conditions re-exposed the station and allowed the solar panels to recharge the batteries. Both stations also continued to operate after extensive surface melt caused their supporting towers to topple over. Research results on iceberg disintegration processes using data from these two drifting AMIGOS, including the effects of heavy surface melt, flexing by ocean waves, and tidal drift, were presented by Reference ScambosScambos and others (2008).
Between early 2010 and early 2012, several AMIGOS stations with additional sensors, more memory and improved Iridium modems (described in sections below) were installed as part of two research programs studying ice shelves, glaciers and floating ice tongues. Four AMIGOS stations have been installed as part of the Larsen Ice Shelf System, Antarctica (LARISSA) multidisciplinary research program. Of these, two are aimed at in situ observations of ice-shelf and outlet-glacier climate and ice properties (Scar Inlet AMIGOS, 65°48′ S, 62°00′ W, installed 16 February 2010 (Fig. 1b); and Flask Glacier AMIGOS, 65°46′ S, 62°43′ W, installed 9 February 2010). A third station is a high-resolution camera system observing ice-shelf front and shelf surface areas (Cape Disappointment AMIGOS, 65°34′ S, 61°45′ W, installed 19 November 2011 (Fig. 1c)), and a fourth is a special system for a very high-snowfall region at the crest of the Antarctic Peninsula (LARISSA Site Beta AMIGOS, 66°04′ S, 64°02′ W, installed 7 February 2010 (Fig. 1g)). Two newly installed systems are part of a Korean Polar Research Institute (KOPRI) project studying rifts and ice/ocean interaction on the Drygalski Ice Tongue in the Ross Sea (K-AMIGOS1, at 75°25′ S, 165°10′ E, installed 1 February 2012; and K-AMIGOS2, at 75°21′ S, 164°18′ E, installed 4 February 2012).
Observations of penguin interactions and timing of penguin migration, molting, etc.
Early observations of penguin colonies using pre-AMIGOS stations were intended to study how large icebergs influenced penguin feeding and movement in the southwestern Ross Sea near Beaufort Island. The first station aimed at penguin observations was deployed on iceberg B15K on 4 December 2004, initially at 76°56′ S, 167°02′ E. It operated for ∼50 days. In addition to weather and iceberg movement data, using a steerable web camera the station acquired a series of panoramic images of Beaufort Island and the emperor penguin colony situated on the sea ice immediately adjacent to the iceberg.
Given the initial success of the B-15K station, a research need for continuous monitoring of the Adélie penguin colony at Cape Royds on Ross Island was identified in order to gauge certain aspects of penguin occupancy during periods when researchers are not able to be at the site (late January through October, typically). In late November 2006 a system based on the Nascent Cam pre-AMIGOS station was installed near Shackleton’s 1908/09 hut on Cape Royds, with a view of the colony. With the hut in view, snowdrift conditions relevant to the hut’s preservation as a historically significant site could additionally be monitored. The station was upgraded in early January 2011 to an AMIGOS station with a Nikon camera mounted on a precision moveable stage, in addition to the Sony PTZ camera. The station also includes a full weather sensor system.
Amigos Processor: Triton Cpu Board and Peripherals
The Triton CPU board was developed by one of us (R.R.) in 2004. (Acronyms for several technical terms are provided in the Appendix.) Processor platforms in early pre-AMIGOS systems lacked a complete file system and the ability to call up the station and change parameters such as duty cycle and scheduling. In 2004, a custom processor board was designed and implemented, running a Linux OS. The advantage of this approach is that simple built-in utilities such as telnet, FTP client/server, web server, shell scripting and a C cross-compiler are available for both programming and remote troubleshooting of the system. A single-boardcomputer module (TritonTM ETN) was selected from KARO Corporation of Germany as the host CPU. The Triton module is based on an Intel Xscale microprocessor chip, and has low power requirements (1.6W run mode, 120 mW sleep mode). The modules are rated by KARO for low-temperature operation (to −40°C) and are supplied with a 64MB RAM and 32 MB flash memory, as well as KARO firmware (Table 1). The module is compact, with a footprint of just 3 cm × 7 cm in a SODIMM-style design. A custom carrier board was designed for the Triton module which plugs into the carrier board and forms a single entity (hereafter, we refer to this combined pair as the ‘Triton board’; Fig. 2). The Triton board accepts a range of input voltage from 12 to 15 V and can route a total of 5 A spread across the ten regulated outputs. Precise voltage regulator output for peripheral instruments or components is set by a two-resistor combination. It has several I/O connections such as Ethernet, 12C, SPI, 1W, GPIO and a Compact Flash interface. The Triton board supplies regulated power to the module, has over-/ under-voltage protection, reverse polarity protection, electrostatic discharge protection and a four-channel ADC for measuring input voltage and current draw. An array of linear and switching regulators surround the module, controlled by firmware embedded in the module’s flash memory, that regulate and supply power to external sensors and peripherals.
Table 1. Components for the AMIGOS main processor


Fig. 2. The AMIGOS Triton controller board. The Triton CPU board itself is located on the opposite side of this printed circuit board, beneath the flash drive.
A key requirement is the need for the module to be reset externally and automatically in the case of a software crash, i.e. a ‘watchdog’ functionality. A basic microcontroller was added to the carrier and programmed for this watchdog function. When the system is running properly, the Triton module pulses (‘pets’) the microcontroller watchdog every minute. The absence of a pulse from the CPU initiates a hard reset of the CPU.
The core firmware for the Linux OS (version 2.6) is stored on the internal flash memory of the Triton module. Our custom programs and code for the sensors and instruments are stored on compact flash, along with acquired data. Currently a 2 GB SLC compact flash is used. The code must be modified for each sensor suite configuration on an AMIGOS, but modifications are easily done with modular code and a scheduling master program. Once the Triton has booted and configured, all tasks performed by the software are executed through a scheduler that runs every minute. Shared resources such as the Iridium modem are controlled through a system of software flags. For example, for a typical task (e.g. read the weather sensor every hour), the scheduler will launch the software task to turn on power to the sensor, read the data from the sensor, turn it off, timestamp and format the data and append them to a 24 hour log. For most AMIGOS systems these data will be transmitted by the Iridium modem as a SBD message to an e-mail recipient. A previously launched task may already be using the Iridium, and therefore a software flag will postpone a task until the resource is available. If not in use, the software will turn on the modem, send the message to the modem and execute the transmission. Some tasks do not complete due to Iridium transmission breaks. In this case, a record is kept for future attempts to clear backlogs. Once a task is completed, the modem is switched off to conserve power. Operation of the modem is among the largest power-consuming functions (the other major power consumer is camera operations).
The instruments and Triton board are connected by local Ethernet links and serial ports. The computer enclosure includes an Ethernet hub, router and the Iridium modem, as well as the Triton board (Figs 3 and 4, top; Table 2). It also includes the precision GPS (if installed), and the main shelter box can also be modified to hold the digital single lens reflex (DSLR) high-resolution camera and precision pointing stage. The power box (Figs 3 and 4, bottom; Table 2) contains three or four 100 Ah batteries, a solar power controller and the CR-1000 data logger supporting the thermistor string and sonic ranging sensor (if installed).

Fig. 3. Interior of electronics enclosure box (top) and battery enclosure box (bottom) for two field-installed AMIGOS stations, with major components labeled. The electronics enclosure box is 50 cm × 45 cm × 30 cm; the battery box is 75 cm × 50 cm × 35 cm. Note the weatherproof external connections for all sensors and antennas on the bottom face of the electronics enclosure box. An aluminum sheet mounted to the interior walls of the enclosure acts as a common electrical ground. Battery box also contains a Campbell Scientific CR-1000 data logger with resistance thermometer terminals attached.

Fig. 4. Block diagrams of the AMIGOS electronics and solar-battery systems. Top: the components of the enclosure box, with connections, connectors, voltages and external links schematically illustrated, typically mounted 1–3 m above the snow surface. Bottom: block diagram of the battery box, typically buried in snow (0.8–2 m) or secured to the base of the station mast. Some systems have four batteries and/or three solar panels.
Table 2. AMIGOS shelter box and power box components

All AMIGOS systems incorporate an Iridium modem for both SBD and dial-up uplink and downlink communications. Recently installed systems use NAL Research Corporation A3LA-XA modems for more reliable low-temperature operation. These modems provide a data rate of 1200 baud in dial-out mode. Transmissions in SBD mode are single bursts of up to 2 kB. A key feature of the AMIGOS platform is the ability to call up the system at pre-scheduled times via the modem and re-program the system software or the peripherals that are Ethernet-connected to the Triton board. Typical changes include redirecting the camera or changing operational duty cycles to conserve power in winter. Modem parameters themselves have been changed remotely when Iridium dial-up numbers or receive-site settings have been changed by external service providers. This feature makes the AMIGOS system both versatile and adaptable to on-site geophysical or off-site communication changes, within limits.
Software and Process Scripts for the Triton Board Amigos System
The software and firmware tasks have been written either in C (compiled using a cross-compiler) or are formed from a combination of C, shell scripts and software utilities such as awk and sed. Applications requiring floating-point calculations have been written in C using libraries that come with the cross-compiler.
All tasks on the Triton board are driven by a crontab function that is inherent in the Linux OS. They have a resolution of 1 min. The primary tasks are pulsing the watchdog chip, checking the battery voltage and executing the scheduler once every minute. The scheduler dictates when functions are turned on and off, or initiated and ended. It is configured through a simple web browser tool that creates a file with on and off times. The scheduler file is processed every minute by the crontab. If a start or stop time matches current time then a child task is launched or terminated.
Amigos Cameras, Sensors, Measurements and Their Accuracy
The AMIGOS sensor suite is intended to provide in situ information as a validation to satellite observations, or to make observations that cannot be made remotely. A variety of sensors are possible, and different configurations are used depending on the characteristics of the site and the intended geophysical processes to be observed. Table 3 lists the sensors that have been used to date.
Table 3. AMIGOS sensors used to date

The typical current configuration of an AMIGOS station includes a PTZ web camera (Sony SNC-RZ30N/2), a GPS system (C/A code Garmin GPS-17 or dual-frequency TopCon GRS-1) and an all-in-one weather station (Vaisala WXT520). Weather station data are typically assessed hourly based on 10 min of observations just before the UTC hour. Examples of weather data spanning a 36 hour period are plotted in Figure 5. The Vaisala weather station records wind speed and direction (using an ultrasonic Doppler ranging method; ±0.3 m s−1; ±13° azimuth), air temperature (±0.3°C, −52°C to +60°C), humidity (±3%; degrading to ±5% near saturation) and barometric pressure (±1 hPa under polar conditions). It is also capable of detecting and measuring rainfall, but this has not yet been observed at any AMIGOS site, so this capability has not been enabled.

Fig. 5. Example of the website weather and instrumental graphics generated from Iridium single burst data (SBD) mode transmissions. Clockwise from upper left: wind rose, air temperature, solar intensity and albedo, and air pressure (hPa).
The web camera records changes in the surroundings (e.g. crevassing, melt pond formation, sastrugi formation and movement) and can take images of snow accumulation stakes or flag arrays and thereby record net snow accumulation and approximate surface roughness and slope (Fig. 6, upper left). Resolution of the acquired images is set to 640 × 480, but resample images are uploaded at 320 × 240 pixels to save connection time. For most installations, an aviation windsock or one or more lines of flags are set radially away from the camera to estimate visibility, approximate wind speed and direction, ice deformation (e.g. relative movement of the flags in line) or the calving rate of an iceberg or ice-shelf edge (Fig. 6, second from upper left; Reference ScambosScambos and others, 2008). The camera is also used to image the weather station and other instruments directly (Fig. 6, upper left), thereby recording when the sensors are free from rime ice or accumulated snow. Additionally, at two stations (the newer Cape Royds ‘penguin cam’ and the Cape Disappointment AMIGOS), a high-resolution digital camera has been installed in a modified enclosure, and integrated with a precision pointing stage (Fig. 1c and e; Nikon D90 DSLR, up to 4096 × 3072 pixels; and a Directed Perception PTU-D46-17 precision pointing stage). This was programmed to acquire high-resolution panoramic image series of rapidly changing areas or sites of frequent penguin interaction (Fig. 7).

Fig. 6. Sample images from the Sony web camera systems installed on several AMIGOS. Clockwise from upper left: accumulation stake, weather and albedometer at the Flask Glacier installation; flag line (spacing of 100 m) to the iceberg edge at the A22A iceberg installation (newly calved berg in distance); Adélie penguins at the Cape Royds penguin colony; blowing snow and dunes within the Nascent rift on the Ross Ice Shelf; windsock at the runway threshold at Thiel Mountains (Wx8 station); view down runway at Thiel Mountains; view of surface beneath the UK211 iceberg showing flooded firn next to the battery cases; close-up of mirror showing Flask Glacier installation solar panels (one of three), electronics enclosure and valley walls.

Fig. 7. Panoramic mosaics from the high-resolution cameras installed at Cape Disappointment (top) and Cape Royds (bottom). The snowfield in the lower part of the bottom image is part of Ross Island; open-water and/or sea-ice areas are behind the ridge.
The C/A code GPS sensor (Garmin GPS17) records approximate position (to within 10m) and provides clock time updates for the computer system. This GPS system was used as a sensor for iceberg movement, but in general is not accurate enough for precision glacier measurement. A precision, dual-frequency GPS/GLONASS system was integrated with selected AMIGOS stations installed on fast-moving glaciers and ice shelves as part of the LARISSA and KOPRI Drygalski Ice Tongue projects. The unit is the TopCon GRS-1 board GPS coupled with the TopCon PGA-1 compact antenna (without a ground plane, to reduce wind drag). The system has proven capable of providing positions precise to within ±3 cm with 20–40 min acquisition periods (15 or 30 s epoch acquisitions), and also provides precise elevation data.
A sun sensor and albedometer are installed on most AMIGOS, providing information on total solar radiance (for calibrating solar power output) and approximate, full-spectrum surface albedo. The albedometer is built from a pair of opposing sun sensors, mounted and leveled on a 1 m horizontal arm extending away from the tower and camera mount. Albedo is determined by the ratio of the output voltage from the upward- and downward-looking sensors. While the sensor used (Apogee SP-212) is quoted as accurate to just ±5%, the observed albedo has proven accurate for fresh dry snow (∼0.85−0.90) and clearly shows the drop in albedo associated with the onset of surface melting (to ∼0.65−0.75). On ice-shelf and glacier areas, a thermistor string is included, nominally with four platinum resistance thermometers installed to 12 m. The thermistor string is attached to a Campbell Scientific CR-1000 data logger, which includes reference resistors and an internal temperature sensor.
Some sites have had unusual instruments or unique configurations. On the ice-divide site at Bruce Plateau on the Antarctic Peninsula (site of the LARISSA Site Beta ice core; Fig. 1g) no camera was used because the surrounding snow was featureless. Accumulation rate was measured by a sonic snow height measurement system, and a longer platinum resistance thermometer string (120 m) was used in the borehole to provide a record of the recent climate history of the site (Reference ZagorodnovZagorodnov and others, 2012). The AMIGOS system installed on iceberg A22A included a simplified 10 MHz radio-echo sounder system in an attempt to measure ice thickness changes during drift; however, interference (likely from the aluminum tower) rendered the data uninterpretable (Reference ScambosScambos and others, 2008).
For all the sensors, a major consideration is data volume and frequency of acquisition to maximize usefulness of the data while minimizing power consumption. Weather data, low-precision GPS data, data from the CR-1000 system, and system health data are sent in a series of SBD messages (2 kB each) transmitted every hour, essentially as e-mail. For the web-camera images, six to ten images are acquired up to four times per day. During the sunlit periods (September–April), subsampled versions (320 × 240 pixels, compressed) of all acquired images are transmitted via Iridium in dial-out mode to internet locations. During winter periods, this is reduced to just one picture group per day. We limit daily dial-out transmissions to ∼300 KB maximum (∼40 min transmission time), and 72 SBD transmissions during sunlit period.
Operational Problems
Although several of the currently installed AMIGOS have operated for up to two to four winters unattended, there are also numerous operational issues that have occurred at some sites. A major class of issues results from unusual weather conditions at some of the sites. Very low temperatures (−30°C or lower) impact many of the sensors and the Iridium system, causing them to cease operation temporarily. This has, to date, not affected the CPUs or data-recording systems, so some or all of the data can often be recovered or re-transmitted later. At the very high-accumulation site at Bruce Plateau, rime icing was extreme, encasing the entire station in large frost crystals, preventing battery charging, weather measurements or even Iridium transmission (due to encasing the antenna with ice, presumably). In contrast, at the high-seasonal-melt site on the Scar Inlet of Larsen B ice shelf, there is evidence in the transmitted data that the battery box was slowly flooded by meltwater just prior to an end to communication. The indication came from the record of the thermistor-string data logger, in the form of non-physical apparent changes in firn temperature (which we interpret as water bridging the contacts in the data logger and changing the resistance characteristics; Figs 3 and 4). This occurred despite a generally watertight case for the battery box, perhaps due to leaks at the cable penetrations.
Hardware issues are in general related to cable connector problems associated with strong daily and seasonal thermal cycling, or wind. Other problems within the hardware systems appear to be related to firmware issues or power glitches resulting in ‘hanging’ or unresponsive configurations while installed in the field. A major issue is the rapidly changing nature of computer and sensor hardware and firmware, making it difficult to replace system or sensor components that are even just 1 or 2 years old. This suggests that it is prudent to buy all hardware for a given set of stations at once, after compatibility among components for a specific iteration of a design is proven.
Science Results Overview from Amigos Installations
We discuss a few selected science results from AMIGOS and pre-AMIGOS data in detail to demonstrate the application of in situ multisensor geophysical process-related observational data, and observations of polar faunal behavior.
Penguin behavior studies
The period of interest for the Cape Royds AMIGOS Adélie penguin observations is February–March, after penguin chicks have fledged and a large fraction of the adults return to the colony to molt in late February (e.g. Reference YeatsYeats, 1968). The fact that Royds adults do this is unusual. At the majority of other high-latitude Adélie colonies, nearly all the adults move away to feed after breeding, and molt while sitting on floes in the pack ice. This is an important period in the annual life cycle of Adélie penguins because during molting the birds do not enter the water and so cannot feed.
The Cape Royds AMIGOS images confirmed that, indeed, the number of penguins molting at the Royds colony was as much as one-third of the breeding population. The best explanation for their returning to Royds is the frequent presence of pack ice nearby, even in late February (so the conditions are similar to those for other penguin groups that molt on pack ice), and that abundant food remains in the Royds area (allowing them to replenish fat lost during breeding without a long migration away from the site). However, this behavior may explain the lower survival rates of Royds adults which is generally 10% lower than at neighboring colonies where adults behave normally in regard to molt (Reference Dugger, Ainley, Lyver, Barton and BallardDugger and others, 2010). By staying until late summer, the remaining Royds adults can have a very long walk to the sea-ice edge if the sea freezes near the Royds coast before they finish molting (Reference Dugger, Ainley, Lyver, Barton and BallardDugger and others, 2010). Staying until late summer also explains the post-breeding movements of Royds penguins, compared to those at Cape Crozier on the opposite side of Ross Island (Reference Ballard, Toniolo, Ainley, Parkinson, Arrigo and TrathanBallard and others, 2010). Penguin movements are affected by the distribution and movement of sea ice. In early February when Crozier Adélie penguins head to the eastern Ross Sea to fatten and molt, the sea-ice field has begun to grow, extending westward. Sitting on ice floes, the Crozier birds move both north and northwestward to the central Ross Sea. By early March (when Royds birds head north), sea ice has covered most of the central Ross Sea and these penguins become entrained in the northward flow of ice, toward Cape Adare and eventually the Balleny Islands.
The Cape Royds AMIGOS data, and in particular the images, recorded that the adult penguins departed from Cape Royds within a day or so of coastal freeze-up near the colony. A large ridge blocks the view of the sea from where the penguins typically congregate during molting at Cape Royds (Fig. 7, lower panel), so the signal that triggers their departure is unclear. The upgraded AMIGOS station uses the improved images to record penguin location, proportion of banded birds in the remaining adults, and their social interaction far better than the earlier station. It also provides weather data so that changes related to the initial freeze-up (e.g. a sudden drop in temperature or humidity) may be evaluated as possible cues for the penguins to leave the colony.
Ice-shelf rift/blowing-snow interactions
The camera system at Nascent rift acquired four sets of images each day for the 136 day period of operation. This near-continuous observation from a fixed location facilitated the observation of subtle changes in the snowscape of the rift wall and floor. Although not set up for precise photogrammetry, general geometry of the camera view and the rift structure permitted semi-quantitative observations of snow accumulation and led to the recognition of a variety of snow accumulation processes: (1) snow-apron formation and growth along the far rift wall, (2) burial of firn-block features by snowdrift on the rift floor, (3) snow cornice formation, collapse and infall along the rift wall, and (4) sinking of features on the floating rift floor (in addition to their burial by snowdrift). Figure 8 summarizes the observations of structures and areas of major changes.

Fig. 8. Ice-shelf rift image analysis. (a) East view, (b) south view and (c) west view produced during times of excellent visibility. The east view (a) is used to measure rift width (using the fact that the rift cliff was measured to be 30 ± 1 m above the snow surface of the rift floor) and widening rate. (d) Snow cornice infall occurs roughly once every month and produces a debris field of moderately sized snow blocks at the foot of the south, upwind rift wall (top image: before; bottom image: after). (e) Snow cornice development and infall is the most identifiable example of snow influx to the rift floor because it is an episodic process associated with large visual changes to the rift lip morphology (top image: before; bottom image: after). (f) Objects in the foreground (∼65 m from the camera) appear to be buried by snow accumulation around them (top image: before; bottom image: after). The rate at which such objects are buried, based on image comparison, is assumed to reflect the general snow accumulation rate within the central part of the rift floor. (g) Comparison of images at the beginning (left) and end (right) of the camera deployment suggests that rubble in the foreground is being buried by high snow accumulation rates, that the mound of rubble in the foreground is sinking, perhaps by rotating downward toward the opposing rift wall, that the opposing rift wall is receding from the camera and the mound of rubble (with a break in the rift floor just beyond the rubble), and that a snow apron is growing against the opposing rift wall.
Rates for all these processes were estimated from the image series geometry. The series of images were used to create a model of the snowdrift processes, and infer accumulation rates within the rift (Reference Leonard, Tremblay, MacAyeal and JacobsLeonard and others, 2008). These were found to be approximately ten times the regional accumulation (1.5 m a−1 versus 0.12m a−1), likely due to both capture of saltating blowing snow and preferential capture of entrained blowing snow during high-wind precipitation events. Timing and volume of cornice formation and collapse could be determined from the image series, and is hypothesized to account for much of the net snow capture by the rift system. Evolution of the rift floor indicated both widening of the rift (at a particular point within the rift, and not at either rift wall or distributed across the rift melange) and slow submergence of snow blocks within the melange.
Multisensor analysis of unusual weather or surface events
The AMIGOS stations installed at Scar Inlet and Flask Glacier on the eastern flank of the Antarctic Peninsula are located there in part to understand how regional climate and local weather and microclimate conspire to create conditions of extensive surface melting and melt ponding that are implicated in the Larsen A and B and other ice-shelf disintegrations (e.g. Reference Vaughan and DoakeVaughan and Doake, 1996; Reference Scambos, Hulbe, Fahnestock, Domack, Burnett, Leventer, Conley, Kirby and BindschadlerScambos and others, 2003; Reference Van den BroekeVan den Broeke, 2005; N. Barrand and others, unpublished information). What has been observed at these sites is a very strong influence from transient föhn, or chinook, winds. Winds across the peninsula are generally westerly, creating a tendency towards downslope airflow on the eastern side of the peninsula ridge. Under certain climatological conditions, frequent or persistent patterns of strong chinook flow can be established, leading to astonishingly rapid transient warming, and intense surface melt and evaporation even in midwinter.
Figure 9 presents multiple sensor data from an AMIGOS station installed on the Scar Inlet remnant of the Larsen B ice shelf showing a July 2010 chinook event that induced significant melt on the surface and melt percolation into the firn. The station is located nearly due west of the Flask Glacier fjord valley, which itself is oriented east–west. Elevation increases from 47 m at the AMIGOS station to 600–800 m near the head of the glacier, and 1800 m at the peninsula ridge crest above the Flask fjord. Conditions on 14 July just prior to the chinook event were very cold (<−30°C) with nearly calm winds from variable directions. Pressure was high (1013 hPa). As winds shifted to westerly and increased, air pressure began to drop rapidly (to 972 hPa), and air temperatures rapidly increased, by ∼30°C in 4 hours. Peak temperatures (+10.1°C) occurred during the first hour of strong westerly winds. Temperatures remained above freezing for 24 consecutive hours. Relative humidity decreased from 80% to 90% in the day before the event to a minimum of 42% near the end of 15 July.

Fig. 9. Multiple sensor data from an AMIGOS station during a strong winter chinook wind and surface melt event on Scar Inlet, Antarctic Peninsula. Upper left, red line (temperature) indicates a sharp warming to +10°C, as wind shifts direction and increases to 7.5 m s−1. Melt eventually percolates into the firn at both 0.2 and 1.0 m depth. Blue numbers above the wind-speed trend line are mean wind direction for 12 hour intervals. Images show the increased drainage structures on the snow surface after the event, and the exposure of ∼10 cm of the accumulation stake.
Firn temperatures from thermistors installed at the site show that sufficient melt was generated in the first several hours of the chinook event to percolate down to some level near 1 m, causing a warming at that depth of >5°C. The near-surface layer (0.2 m) also warmed, reaching −5°C at the end of the event (from ∼−25°C prior to it). No significant temperature changes were seen at 4 or 10 m depth. In images (Fig. 9, right side), surface morphology changes in the snow indicate that ∼10 cm of snow was removed from the surface by melt or evaporation. The pocked surface pattern shows that sublimation under the windy, low-humidity conditions was a significant part of the event.
Summary and Future Directions
AMIGOS stations provide a host of geophysical and observational data that can illuminate a variety of process studies or faunal interactions with the environment. They can extend the field observation period to essentially year-round, thereby tracking events or activities that occur only at times when logistical access is very difficult. They can also act as in situ weather and surface monitors for runways or other sites, providing a cheaper alternative than stationing a human observer in remote areas. Combined with remote sensing or model analysis, they can be a powerful tool for extending local details of an event to a broader scale capable of characterizing system-wide changes (e.g. ice-sheet accelerations, climate events, changes in breeding populations, aviation conditions).
We are planning to continue development of these in situ multisensor stations. Improvements in the computation and communication of the stations will center on better processing capability, more memory and a greater uplink bandwidth. We have already designed an updated carrier board. The new carrier can host a 400 MHz ATMEL ARM9 processor (or a lower-power 200 MHz version). The new features of the carrier board include support for OTG, full-speed and highspeed USB ports, Ethernet 10/100, CAN bus, LIN bus, five serial ports, eight-channel 12-bit ADC, ten switched regulated outputs, onboard temperature, humidity, pressure and accelerometer sensors. Also new for this carrier is a real-time external clock to support a flexible sleep state for very low-power low-duty cycle modes. Both CPU modules run Linux 2.6 OS, with Perl and Python installed, flash memory up to 1 GB and 256 MB of RAM on the higher-performance module. The 400 MHz processor allows support for greater onboard processing of data streams, facilitating a reduced uplink requirement by sending more compressed data, or uplinking information extracted from data rather than raw data. Onboard analysis of sensor data could be used to trigger a shift to different modes of operation (e.g. automatic reduction of data acquisition and uplink when solar power decreases in late fall; or transition to a far greater rate of acquisition and uplinking when sensors indicate an unusual event is occurring). For data uplinking, the current Iridium modems are capable of sending greater amounts of data, but the required power greatly increases the logistical cost because of increased battery weight. A secondary concern is a larger solar array and the support structure required for it. For example, continuous systems operated by UNAVCO (University Navstar Consortium) in Greenland and Antarctica typically send 4–7 MB of data per day, but require up to ten 100 A h lead–acid batteries (typically 32 kg each) to provide continuous power to the Iridium system through the polar winter. A key improvement in battery technology, such as rechargeable lithium batteries, could provide higher energy density at lower weight and thereby present an opportunity for greater uplinked data volume.
In our upcoming designs for sensor configuration, we will aim to expand the capabilities of AMIGOS installations by adding some important sensor improvements. The success of the high-resolution cameras and precision pointing stages shows that there is value in incorporating them at more sites. We also plan to upgrade to dual weather stations at different heights (e.g. at 2 and 4 m above the initial snow surface) to determine wind and thermal gradients, which can be significant on polar ice sheets. At glaciological sites, a pair of thermal radiometers measuring both sky thermal emission and snow surface skin temperatures would facilitate surface energy-balance studies. Sites overlooking floating ice-front areas could benefit from a sensitive thermal infrared camera, to record ocean surface temperature variations at the front in summer (allowing the detection of warmer currents emerging from the sub-shelf cavity, or solar warming of sea-ice-free ice front water). An upgrade being discussed for indigenous species observations is a directional microphone, to receive penguin or seal calls.
On the glaciological side, a major current topic of interest is ice/ocean interaction, i.e. the effect of ocean circulation on ice fronts, particularly for large and deep-keeled glaciers. These systems are known to be highly sensitive to oceanographic circulation changes driven by changing climate patterns. Monitoring such sites, over the long term and covering the several environments present (glacier, ice shelf, sub-shelf and ice-front ocean), requires a system of AMIGOS-like stations that are interlinked, or a hub-andspoke array of simpler sensor instrumentation sites with a main station housing larger data storage, processing, and high-bandwidth uplink capabilities, as well as a suite of sensors of its own. Sensor sites would be linked to the main hub by a wireless network capable of spanning ∼5−20 km. This approach was discussed at several formal and informal meetings of the glaciological and polar oceanographic community in 2010 and 2011 (so-called ‘Sentinel’ in situ systems; these are not linked to the planned Sentinel satellite program). Sensor array sites would include GPS, meteorology and geophone units, long thermistor strings for ice-shelf or glacier temperature profiling, and ocean measurement systems. These may initially be ocean conductivity–temperature–density (CTD) sensors that are mounted on a cable extending through the shelf ice, with a surface station for data relay and weather measurements. More complex systems would be based on automated ocean gliders which periodically surface and uplink data to the hub. Main station sites might best be located on aircraft- or ship-accessible areas that have a broad viewshed of the ice-front study area, and would include high-resolution visible and thermal infrared cameras, seismic monitoring and the other AMIGOS instrumentation previously discussed. The main facility of the central hub, however, would be communications, data storage and high-bandwidth data uplink. This would likely be accomplished by multiple linked Iridium modems configured in an aggregating mode.
An important advance for installation, maintenance and repair, or upgrading automated multisensor stations, will be a more modular design, both in the tower structure and in the sensors, CPU and power systems. Modularity is particularly important for stations (or hub-and-spoke systems) installed in snow accumulation areas, where periodic revisits are necessary to reset or remove the systems before burial. More significantly, a modular approach will facilitate integration of new sensors, replacement of broken sensors, augmenting sensor arrays or adding to the power-supply components.
The overall goal of such installations will be to understand the processes that govern ice mass balance for the major ice sheets, and in particular those aspects of the ice/ocean system that are not easily monitored (or too infrequently monitored) by remote sensing. The AMIGOS stations, and in situ sites with similar multisensor and imaging capabilities, expand our ability to assess polar areas of interest and are a needed complement to the current observational methods of remote sensing and human-operated field methodologies.
Acknowledgements
We thank the many field support and installation personnel at Raytheon Polar Services Corporation, Instituto Antártico Argentino, Antarctic Logistical Experts (ALE), the British Antarctic Survey, the Korean Polar Research Institute, the Italian Antarctic Program and the pilots and crew of Ken Borek Air and Helicopters New Zealand. TopCon Positioning Systems Inc. donated several of the single-board GPSs for this effort. This work was funded by US National Science Foundation (NSF) Office of Polar Programs (OPP) grants 0229546, 0540915, 0732921, 0944411, KOPRI grant PP13010, and received financial support from ALE and the World Wildlife Fund. The camera station at Cape Royds is maintained under Antarctic Conservation Act permits 2006- 010 and 2011-002.
Appendix: Hardware and Software Acronymsâ


