


Introduction
Glacier equilibrium lines are very important because they represent the lowest boundary of the climatic glacierization. The climates which prevail at glacier equilibrium lines are considered to be just sufficient to maintain the existence of glaciers. A thorough knowledge of the climates at equilibrium lines is, therefore, essential for understanding the relationship between climatic changes and glacier variations. Investigations along these lines of thought were previously pursued by Reference AhlmannAhlmann (1948) and Reference LoeweLoewe (1971). In view of the recent improvement in information on the equilibrium line, availability of more climatic data and the new requirements for climate modelling, the authors decided to formulate this problem from a different viewpoint.
Glacier equilibrium lines also have other important meanings. First, the year-to-year variation of the equilibrium-line altitude (ELA) is a good indicator of the variation in the total annual mass balance of the glacier. Secondly, but closely related to the first point, the largest standard deviation of annual zonal mass balance (mass balance for a certain altitude zone) is usually observed at around the ELA. Thirdly, a substantial part of the glacier meltwater originates from near the ELA (Reference Ohmura and FunkOhmura and others, 1986).
There are, at least, two approaches to understanding the climate at the ELA. One is to pursue the processes of accumulation and melt, where the latter can be vigorously investigated from the energy-balance principle. The other approach can be made from the viewpoint of scaling, where by the relevant variables for the ELA are selected and the relationships between them and the annual accumulation or ablation are sought statistically. The present work is aimed at finding the relationship between the climate and the glacier equilibrium line, based on the second approach. The ELA values used in this work are all directly derived from the mass-balance measurements. The glaciers considered in this work are those inmid-latitudes and polar regions. The glaciers in the tropics behave differently and will be treated separately later.
Present Distribution of the ELA
Despite its importance, the ELA is often treated crudely, confused with the snow line, with little reference to the mass balance. In view of this problem, it is worthwhile looking at the large-scale distribution of the ELA in relation to some climatological elements. Figure 1a, b, c, d and e illustrate the distributions of the ELA for the west slope of Greenland, west Scandinavia, the Alps, central Asia and the Andes, respectively. Other glacioclimatologically important lines are also plotted to assist interpretation.

Fig. 1. a. Distribution of equilibrium line (dots) for West Greenland. 0°C isothermal lines for the free, atmosphere during June, July and August (solid line), for the surface during the same 3 months (broken line), and for the annual mean surface temperature (broken line and dot) are also plotted. Glaciological information is according to Reference SchyttSchutt (1955), Reference BraithwaiteBraithwaite (1980), Reference OlesenOlesen (1986), Reference Weidick and ThomsenWeidick and Thomsen (1986) and personal communications from. R.J. Braithwaite and H.H. Thomsen. Climatological data are according to Reference ScherhagScherhag (1969) and Reference OhmuraOhmura (1981). The broken line and cross represent the dry snow line by Reference BensonBenson (1962). b. Distribution of equilibrium line for Scandinavia. The ELAs of individual glaciers are expressed as dots. The meanings of the other lines are the same as in Figure 1a, except for the open circles in the top right inset which indicate annual precipitation with the scale on the righthand side. Glaciological data are according to Reference KasserKasser (1973), Reference MüllerMüller (1977) and Reference HaeberliHaeberli (1985). Climatological data are according to Reference ScherhagScherhag (1969), NCAR World Weather Disc Records — Upper Air (TD-9648), WMO (1911), British Meteorological Office (1978) and Reference WernstedtWernstedt (1985). c. Distribution of equilibrium line in the Alps. The most likely altitudes of the equilibrium lines are found within the two dotted lines. The 0°C isothermal lines are the same as for Figure 1a. Glaciological data are according to Reference HoinkesHoinkes (1970), Reference KasserKasser (1973), Reference MüllerMüller (1977), Reference KuhnKuhn (1981), Reference FunkFunk (1985), Reference HaeberliHaeberli (1985), Reference Moser, Escher-Vetter, Oerter, Rcinwarth and ZunkeMoser and others (1986), Reference Funk and AellenFunk and Aellen (unpublished). Climatological data are according to Reference ScherhagScherhag (1969) and WMO (1971). d. Distribution of equilibrium line for Central Asia. The mean altitude of the equilibrium line is shown as dots. The 0°C isothermal lines are the same as for Figure 1a. Glaciological data are according to Reference Fujii, Nakawo and ShresthaFujii and others (1976), Reference Ageta and SatowAgeta and Satow (1978), Reference Yasunari, and InoueYasunari and Inoue (1978) and Reference ShiShi (1988). Climatological data are according to NC AR World Weather Disc Records — Upper Air (TD-9648), WMO (1982) and unpublished meteorological data for Tibet, Tianshan and Altai Shan provided by the Lanzliou Institute of Glaciology and Geoeryology, Academia Sínica, e. The distribution of equilibrium lines for the Andes. The ELAs of individual glaciers are expressed as dots. The 0°C isothermal lines are the same as for Figure 1a. The glaciological data are according to Nog ami (1976). Reference JordanJordan (1984) and Reference AmesAmes (1985). Climatological data are according to Reference Prohaska and SchwerdtfegerProhaska (1976), Reference Miller and SchwerdtfegerMiller (1976), Reference Johnson and SchwerdtfegerJohnson (1976), NCAR World Weather Disc Records— Upper Air (TD-9648) and U.S. Department of Commerce (1982).
The ELA on the west slope of the Greenland ice sheet (Fig. 1a) falls from about 1500 m a.s.l. at the southern end to 700 m a.s.l. on the northern slope. Often, the annual mean 0°C isotherm is used as the ELA (Reference Källén, Crafoord and GhilKällén and others, 1979; Reference Ocrlemíins and van der VeenOerlemans and Van der Veen, 1984). It should be noted that the 0°C annual mean surface temperature barely touches the southern tip of Greenland and does not even intercept the ice sheet. This fact demonstrates how unrealistic it is to approximate the ELA with the 0°C annual mean surface temperature. If, for some reason, the 0°C annual mean surface temperature is preferred to be related to the ELA, the summer 3 months (JJA) surface temperature comes closest to the ELA on the west slope of Greenland. A local depression of the ELA at around 77° Ν is due to greater precipitation from the North Water, one of the major recurring polynyas in the Northern Hemisphere (Reference Ohmura and MüllerOhmura, 1976).
The ELAs are presently best known in Norway. The ELAs in Figure1 are all calculated by the long-term mass-balance measurements with well-chosen stake networks. All ELAs are distributed within the annual mean and summer temperature zerolines, descending on an average from 1400 to 1600 m in Folgefonni/Hardangerjöklen to 1100–1350 m in the Storsteinfjellbreen/Blaisen area over 900 km. A much steeper descent in the ELA is seen, however, from the interior of the Scandinavian peninsula to the Atlantic coast. In the latitudinal cross-section along 61°40’ Ν from Memurubreene, through Jostendalsbreen to Alfot-breen, the ELA descends from 2050 to 1150 m in just over 150 km. In the east-west cross-section of southern Scandinavia, annual precipitation decreases rapidly from over 2000 mm within the first 50 km and reaches a minimum of less than 500 mm at Totenheimen. This is one of the regions in the world where the precipitation gradient from the coast to the interior shows its effect clearly on the ELAs.
In the Alps, the ELAs (Fig. 1c) tend to appear at about 700 m above the zero annual mean temperature. The ELAs climb slowly from the French Alps to the Swiss Alps, reaching more than 3200 m on the north side of the Pennine Alps, especially in the Mischabel Range. The ELAs descend in the region of the Adula Group which is open to the Mediterranean. In the Austrian Alps, the highest ELAs are observed in the Ötztal Alps.
The ELA decrease to the south on the southern slope of the Himalaya (Fig. 1d) is due to the effect of the summer monsoon, greater precipitation and lower summer temperature in comparison with the northern lee side. On the Tibetan Plateau, the ELA falls only slightly with increase in latitude. The meridional temperature gradient in the middle troposphere is the smallest over the Tibetan Plateau within the entire Northern Hemisphere. The sudden drop in the ELA in the Tien Shan and the Altay Mountains is mainly due to the increase in vapour flux transported from the Atlantic (Reference XiaoXiao, 1981).
In the Andes (Fig. 1e), the ELA increases from the Equator towards 25° S which is at the latitude equivalent to the Atacama Desert on the Chilean coast. The ELA descends sharply from 30° to 40° S by as much as 5000 m.
This abrupt descent in the ELA is attributed to the prevailing westerlies south of 35° S, which carries moisture from the Pacific Ocean.
Suitable Variables for Describing the ELA
In view of the facts presented above, it is appropriate to use at least two variables, precipitation and temperature,which represent the effects of accumulation and ablation, respectively. As will be demonstrated later, radiation is also an important factor to be considered.
ELAs arc known accurately on about 100 glaciers at present where the annual mass-balance measurements have been carried out for a sufficiently long period. After some trial and error, it was found that the mean temperature of the summer months, June, July and August (December, January and February for the Southern Hemisphere) in the free atmosphere at theequivalent altitude as the ELA and the annual total precipitation at the ELA are convenient variables to characterize the ELA. Air temperature of the free atmosphere has an advantage over the screen-level air temperature, because the formeris more easily accessible both in Nature and in models. The free-atmospheric temperature is calculated on the basis of data from Reference ScherhagScherhag (1969) and NCAR World Weather Disc Records-Upper Air (TD-9648).
The annual total precipitation measured on the ELA is extremely rare. The annual total precipitation on the ELA is, therefore, approximated by the winter mass balance and the summer precipitation measured on the ELA, both of which are more often observed than the annual total precipitation. The difference between the accumulation on a glacier and the meteorologically observed precipitation will be discussed later in detail.
The radiation data, which are best suited for characterizing the glacier ELA, must be net radiation. As shown in Table 1, this is the prime energy source for the melt. It is, however, preferable to use global radiation plus long-wave netradiation to parameterize the ELA instead of net radiation, because the observation of net radiation on an ELA for the entire melt period is extremely rare and is liable to be influenced by local conditions, such as the albedo below the netradiometer. In addition, there is another advantage in avoiding the involvement of the albedo, because the parameterization of the ELA can be more conveniently formulated by using the glacier’s external factors as independent variables and the albedo should be considered as the glacier’s internal characteristics, which should be found as a solution. The radiative fluxes, as well as other climatological elements which are usedin this work, are summarized in Table 2.
Table 1. Energy balance on the glacier equilibrium line during the melt period in Wm−2, values in brackets are in per cent of total source or sink ( numbers in the first column correspond those in Table 3)

Table 2. Radiative components on or near the glacier equilibrium line

Climatic Characteristics of the Equilibrium Line
The information on the mean equilibrium-line altitude, winter mass balance, summer precipitation, the free-atmospheric summer temperature, global radiation, global radiation plus long-wave net radiation is given in Table 3. The ELAs in this table are evaluated by mass-balance measurements with stakes. The distribution of the ELAs of these 70 glaciers in the precipitation-temperature (P–T) diagram is presented in Figure 2. In general, it can be interpreted that, if the P–T condition of a site falls in the sector within the zone of the points, such a location has a good chance of being on the ELA. If the site is not presently glacierized, it is very close to being glacierized with a slight increase in precipitation or decrease in summer temperature. If the P–T condition falls above the zone of the points, the site is likely to be found in the accumulation area. Likewise, if the P–T value falls below the zone of the dots, the site is either in the ablation area or unglacierized. It is assumed that there exists a function of Ρ and Τ at the ELA, f(Ρ, Τ) = 0, which satisfies the condition for creat-ing the glacier equilibrium line. The best-fit polynomial regression curve for the 70 glaciers under consideration is P = a + bT + cT2, whereby a = 645, b = 296 and c = 9, and Ρ and Τ are in mm w.e. and °C, respectively. The standard error of estimate is 200 mm w.e. Although the scatter of the points around the regression line is relatively narrow, it can be explained as being largely due to the different radiation condition. Global radiation alone dots not explain the discrepancy amongst the dots, however, because of the often-observed negative correlation between global and net radiation for the ELA region (Arnbach, 1974). The inclusion of long-wave radiation data makes it possible to understand the scatter. This result offers a possibility for parameterizing the ELA for climate models.


Fig. 2. Annual total precipitation (or winter mass balance plus summer precipitation) and the mean free-atmospheric temperature observed at the ELAs for 70 glaciers. The numbers indicate the glaciers listed in Table 3. The solid line and the broken lines indicate the square regression line and the standard deviation, rcspectively. The numbers in brackets are global plus long-wave net radiation for the summer 3 months, June, July and August (December, January and February for the Southern Hemisphere), expressed in kly/3 months and Wm−2, respectively. The dotted and dashed lines indicate the best-fit curves for the glaciers with summer radiation 240 and 210 Wm−2.
It is currently possible to estimate global radiation and long-wave net radiation on equilibrium lines for only 15 glaciers. The reason for the difficulty in calculating this component for other glaciers is the lack of observations on long-wave radiation. The general trend of each glacier around the regression line in Figure 2 is that for a given annual precipitation the glacier equilibrium lines under the lower summer temperature are found for glaciers with greater amounts of radiation, and vice versa. It appears that a temperature difference of 1°C is roughly equivalent to a 7Wm−2 (1.3 kly/3 months) radiation difference and 350 mm w.e. annual precipitation.
Relationship between Precipitation and Accumulation
Although accumulation originates primarily from precipitation, it is quantitatively different. It is, however, necessary to clarify the differences between these quantities. Of the 70 glaciers listed in Table 3, 12 glaciers are identified as suitable for a comparison of the annual precipitation and the combined amount of the winter balance and summer precipitation (Table 4). For some glaciers, the annual precipitation was measured at the mean ELA, such as Rhonegletscher and Griesglctschcr. For other glaciers, such as Laika Glacier and Law Dome, meteorological stations were located very near(within 300 m altitude) the ELA. For glaciers of the other group, such as White Glacier and No. 1 Urumqi glacier, the meteorological stations were closely located but with a much larger altitude difference. In these regions, however, the altitudinal dependency of precipitation is well established, so that it was possible to correct the annual total meteorological precipitation to the ELA. On all these glaciers, the summer precipitation and the winter glacier mass balance weremeasured at altitudes very close to the ELA or right on the long-term ELA (White Glacier, Rhonegletscher and No. 1 Urumqi glacier).
Table 4. Comparison of precipitation and accumulation on glaciers (mm w.e.) on ELA

The comparison between the annual precipitation and the combined winter balance and summer precipitation shows that they are very close to each other. This is especially true for White Glacier, Rhonegletseher and Griesgletseher, for which meteorological and glaciological observations are considered to be of a very high quality. On average, the metorologically measured annual precipitation is slightly smaller than the winter balance plus summer precipitation. This is partly due to the known underestimation of precipitation gauges, particularly of solid precipitation (Sevruk, 1983). For some glaciers, however, the winter mass balance is clearly larger than the meteorologically measured precipitation, and the accumulation through snow drift may be an im-portant accumulation mechanism for such glaciers (Laika Glacier, Woolscy Glacier, Hintereisferner and Tsentrainyy Tuyuksu). The most important conclusion of this comparison is that the winter mass balance (accumulation) comes very close to the meteorological precipitation on a number of glaciers. This point justifies the approximation of the annual precipitation using the winter balance and the summer precipitation.
Climatic Change and the ELA Shift
The sensitivity of the ELA with respect to the change in climatic elements is examined. The shift of the ELA was investigated by Reference KuhnKuhn (1981) from the energy-balance viewpoint. In the present work, the statistical trend in the relationship developed in the previous section is used. For the sake of simplicity, only the variation of temperature and precipitation is considered.
In Figure 3, annual precipitation Ρ and summer temperature in a free atmosphere Τ at the original ELA denoted by zQ are indicated as solid lines which represent the present climate. The change in the climate for the altitude z0 is represented by ΔΡ and ΔT. As the result of the climatic change, the position of the ELA is shifted to z0 + Δz0 where the new precipitation and temperature are approximated by P + ∆P + ∂P/∂z∆z 0 and T + ∆T + ∂T/∂z∆z 0 respectively. The new precipitation and temperature should be on the solid line of the ELA in Figure 3. The linear approximation of the new location of the ELA in the P–T diagram is presented in Figure 3. The relationship between the new temperature and precipitation should be

where (∂P/∂P) z0 is the gradient of the function f(P,T) = 0 in Figure 2, and (∂P/∂P) z0 = b + 2cT. Re-arranging Equation (1) for Δz>0 .

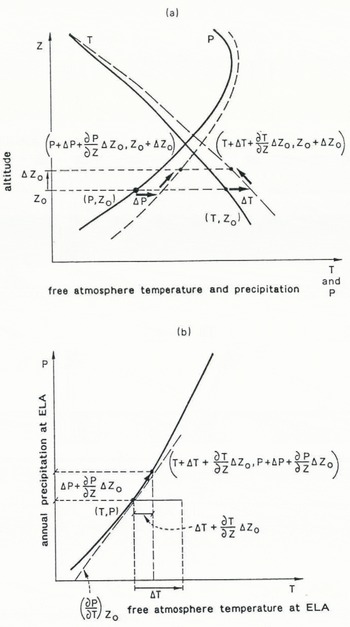
Fig. 3. Vertical distributions of annual precipitation and summer free atmospheric temperature, before (solid line) and after (broken line) the climatic change which resulted in the shift of the equilibrium line by Δz0-b. Dislocation of the. equilibrium-line precipitation and temperature on the Ρ Τ diagram as presented in Figure 2.
Equation (2) represents several important features of the climate/glacier relationship. The vertical shift of the ELA is linear with the change in temperature. The ELA shift is also linear with the decrease in precipitation, although the effectiveness of the precipitation change is not so large because  to −3.3 × 10⁻³Kmm−1. This statement is justified, as ∂P/∂T, ∂P/∂z and ∂T/∂z are almost constant and therefore independent of changes in temperature and precipitation. This means that a change in precipitation of 300 400 mm w.e. corresponds to only 1°C temperature change.
For the same change of temperature and precipitation, the glaciers in a region of large lapse rate  react less sensitively in comparison to those of small lapse rate. Since the regions of larger lapse rate are associated with a continental climate, the glaciers in arid environments must behave insensitively towards climatic changes, and vice versa.
ELA and Mass-Balance Sensitivity
Each glacier possesses a different mass-balance sensitivity with respect to the shift of the ELA. The relationship between the annual mass balance and the ELA makes it possible to translate the shift of the ELA into the change in mass balance and holds important information concerning the effect of climatic changes on the glacierization. The ELA sensitivity of the mass balance is defined as the partial differential of mean annual specific balance by the ELA, ∂ b /∂ ELA and calculated as the gradient of the b -ELA diagram. The mass-balance sensitivity of the ELA shift is calculated for 36 glaciers, for which long-term records of the mass balance and good topographic maps are available. Considering that the sensitivity can be parameterized by the annual specific turnover of the mass (τ) and the surface gradient (α) of the glacier, Figure 4 is made by taking τ/α as an independentvariable, whereby τ = ( c + | a |)/2, c and a being the mean specific accumulation and ablation, respectively.

Fig. 4. The muss-balance sensitivity of the ELA shift expressed as a function of the annual mass turnover and the surface gradient of glaciers. The solid and broken, lines indicate the linear regression line and the theoretical prediction, respectively. Numbers correspond to those in Table 3, except for 11 (Blue Glacier), 12 (Sonnblick Kees), 13 (Silvretta Gletscher), 74 (Kesselu-and/erner), 75 (Limmerngletscher) and 76 (Langtalerferner).
The explanation as to how the parameter τ/α is suited for expressing the mass-balance sensitivity ∂ b /∂ ELA is given below. We consider a simplified two-dimensional glacier of a unit length (projected on the horizontal sur-face), with a constant surface gradient α and density, extending from the origin of the coordinate system as illustrated in Figure 5. The surface change which is expected due to the mass balance of one budget year is also expressed by a linear equation z = βx - γ. If more complicated expressions for the surface altitude and the mass balance are desired, non-linear curves can be used. The x and z coordinates of the equilibrium line are found to be (γ/(β − α), αγ/(β − α)). The z-coordinate difference between the two lines is what we define as the annual mass balance in ice equivalent, therefore

Then, the mass-balance gradient of this glacier is

The total mass balance can be expressed as

Consequently,

Equation (6) is justified, because the glacier has a unit length. The glacier in steady state has B = 0, therefore

Then, the mass-balance sensitivity is

where z 0 is the altitude of the equilibrium-line ELA. Therefore,

Insofar as the linear approximation of the glacier surface and the mass balance are concerned, the mass-balance sensitivity becomes the same quantity as the negative of the mass-balance gradient.

Fig. 5. Linear expressions of the glacier surface and the change of the surface due only to annual mass balance. The solid and broken lines indicate the glacier surface with gradient a and the surface as a result of the mass balance b, but be/ore the surface has been adjusted by dynamics. X and Ζ indicate the horizontal distance and vertical height, u’here the horizontally projected glacier length is defined as unity.
However, since the mass-balance gradient is in reality variable depending on the altitude, it is desirable to replaceit with a more stable quantity which characterizes the entire glacier. We use the concept of the annual specific mass turn-over of a glacier r, defined earlier, which is the mean rate of mass inflow or outflow with respect to the unit surface area of the glacier.
For the glacier under consideration:

For glaciers with near steady state, that is Equation (7) holds, and

Therefore,

Equation (12) is applicable whether b and r are water or ice equivalent, so long as the same unit is used for both. The straight solid line in Figure 4 expresses this theoretically expected relationship, while the broken line is the statistically calculated regression line for the points. The gradient of the regression line is –7.85 and very close to the theoretical prediction of –8. The figure demonstrates that the wide range in the variety of the ELA effect on the mean annual specific mass balance can be expressed as a function of the annual mean turnover and surface gradient, both of which are relatively easy to obtain or estimate. One of the main advantages for using the turnover instead of mass balance as a variable is that the turnover is much less variable than mass balance, owing to the complementary relationship between the absolute values of ablation and accumulation. To demonstrate this point, standard deviations of annual specific turnover and annual mean specific mass balance are compared for White Glacier, Ram River Glacier and Kesselwandferner, which represent glaciers of very small, medium and very large mass-balance sensitivity of the ELA, respectively (Table 5). These glaciers also fit very well the theoretical expectation of the relationship of the ELA mass-balance sensitivity with τ/α. This relationship makes it possible to estimate the mass-balance change of a glacier as a result of climatic changes, given the ELA shift, mean turnover and geometry of the glacier.
Table 5. Comparison of the standard deviations of the annual specific turn-over and annual mean specific mass balance for selected glaciers (in mm w.e.)

Conclusions
The climate prevailing at the equilibrium lines is identified as a function of annual total precipitation and summer temperature in the free atmosphere. Refinement of the relationship is possible by introducing global and long-wave net radiation. The equivalent values for temperature, precipitation and radiation tit the glacier equilibrium lines are approximately 1°C, 350 mm w.e. and 7W m−2, respectively. Assuming this relationship holds, the effect of a climatic change on the shift of the equilibrium line, and further, the effect of the shift of the equilibrium line on the change in the mean specific mass balance, are evaluated. The sensitivity of the mean specific mass balance is found to be proportional to the annual mass turnover and reciprocally proportional to the surface gradient. The proportionality constant is –8 when the longitudinal length of a glacier is taken as a unit for lengths such as altitude and mass balance. The present work offers a possibility of predicting the mass-balance change of a glacier resulting froma climatic change.
Acknowledgements
The authors thank the following individuals and organizations for unpublished scientific data: H. Björnsson for the ELA on Vatnajökull, R. J. Braithwaite and H. H. Thomsen for the ELAs on the west slope of the Greenland icesheet, J. Dowdeswell for the ELA on Aust-fonna, Lanzhou Institute of Glaciology and Geocryology for climatologieal data for the Tien Shan and Altay Mountains, and the Danish Meteorological Institute for climatological data on Greenland. Thepresent work has been possible, due partly to the high-quality mass-balance data from Norway. We should like to thank Professor G. Ostrem for the organization which made this task possible. Our own mass-balance measurements in the Canadian Arctic were generously supported by the Polar Continental Shelf Project, DEMR, Canada. A part of the present work was financed by the Research Fund of the Eidgenössische Technische Hochschule (ΕΤΗ) No. 0330.0C0.34/4 and the Swiss National Science Foundation grant No. 2.307–0.86, No. 20–25271.88 and No. 20–29826.90 for re-evaluation of the global heat balance.
The accuracy of references in the text and in this list is the responsibility of the authors, to whom queries should be addressed.



