


1. INTRODUCTION
The glaciers in the Himalaya and Tibetan Plateau are the sources of the major rivers of Asia (Immerzeel and others, Reference Immerzeel, Van Beek and Bierkens2010), and in addition, their status is a sensitive indicator of regional climate change at high altitudes where few meteorological data are available. Both debris-free (clean) glaciers and debris-covered glaciers are common in the Himalaya and Tibetan Plateau (Benn and others, Reference Benn2012). Debris cover can either increase or decrease ablation rates depending on debris thickness (Østrem, Reference Østrem1959), thus influencing glacier mass balance and dynamic behavior (Anderson and Mackintosh, Reference Anderson and Mackintosh2012; Nicholson and Benn, Reference Nicholson and Benn2012). Debris cover is regarded as a potential contributor to the heterogeneous pattern of glacier changes in the Himalaya and Tibetan Plateau (Scherler and others, Reference Scherler, Bookhagen and Strecker2011). Understanding the different mechanisms controlling changes in both debris-free and debris-covered glaciers is therefore important for predicting glacial runoff and the future response of glaciers to climate change (Bolch and others, Reference Bolch2012).
A prerequisite for understanding glacier behavior is a comprehensive understanding of local meteorological conditions and the surface energy balance, which provide important insights into surface/atmosphere interactions at high elevations (Brock and others, Reference Brock2010; Mölg and others, Reference Mölg, Maussion and Scherer2014). Meteorological measurements and energy-balance modeling has been carried out on mountain glaciers and ice sheets worldwide on debris-free (e.g. van den Broeke, Reference van den Broeke1997; Giesen and others, Reference Giesen, Van Den Broeke, Oerlemans and Andreassen2008; Nicholson and others, Reference Nicholson, Prinz, Mölg and Kaser2013) and debris-covered glaciers (e.g. Brock and others, Reference Brock2010; Reid and Brock, Reference Reid and Brock2010; Anderson and Mackintosh, Reference Anderson and Mackintosh2012; Reid and others, Reference Reid, Carenzo, Pellicciotti and Brock2012). However, obtaining in situ records of glacial meteorology and energy balance is often difficult because of the logistical problems involved in operating in the harsh high-altitude environment of the Himalaya and Tibetan Plateau. In addition, the complex orography results in major climatic variability over short horizontal/vertical distances (Maussion and others, Reference Maussion2013) and the representativeness of limited measurements needs to be addressed.
Previous detailed meteorological and energy-balance studies in the Himalaya and Tibetan Plateau have mainly focused on debris-free glaciers (e.g. Yang and others, Reference Yang2011; Azam and others, Reference Azam2014; Sun and others, Reference Sun2014; Huintjes and others, Reference Huintjes2015). Most of the studies of debris-covered glaciers have focused on the following issues: the effect of debris cover on glacier ablation and runoff using different models (e.g. Han and others, Reference Han, Ding and Liu2006; Fujita and Sakai, Reference Fujita and Sakai2014; Collier and others, Reference Collier2015; Rowan and others, Reference Rowan, Egholm, Quincey and Glasser2015; Steiner and others, Reference Steiner2015; Zhang and others, Reference Zhang, Hirabayashi, Fujita, Liu and Liu2016); debris thermal resistance and thickness estimation using remote-sensing data (e.g. Nakawo and Rana, Reference Nakawo and Rana1999; Mihalcea and others, Reference Mihalcea2008; Zhang and others, Reference Zhang, Fujita, Liu, Liu and Nuimura2011; Rounce and McKinney, Reference Rounce and McKinney2014; Schauwecker and others, Reference Schauwecker2015); and debris properties and ablation (e.g. Mihalcea and others, Reference Mihalcea2006; Hagg and others, Reference Hagg, Mayer, Lambrecht and Helm2008; Rounce and others, Reference Rounce, Quincey and McKinney2015). Although there have been a few attempts to conduct detailed in situ meteorological and surface energy-balance measurements on debris-covered glaciers (e.g. Takeuchi and others, Reference Takeuchi, Kayastha and Nakawo2000; Sakai and others, Reference Sakai, Nakawo and Fujita2002; Steiner and Pellicciotti, Reference Steiner and Pellicciotti2015; Shea and others, Reference Shea2015; Shaw and others, Reference Shaw2016), there is a lack of synchronous comparative studies of debris-covered and debris-free glaciers on a seasonal scale. Consequently, it is difficult to conduct an in-depth quantitative assessment of regional glacier response to climate change (Scherler and others, Reference Scherler, Bookhagen and Strecker2011) and to evaluate statistically/dynamically downscaled climate fields in mountainous regions (Hofer and others, Reference Hofer, Marzeion and Mölg2015).
Here we present the results of a synchronous study of the meteorology and surface energy balance in the ablation zones of the debris-free Parlung No. 4 Glacier and debris-covered 24 K Glacier, which are 120 km apart in the southeastern Tibetan Plateau. The study was conducted in the ablation season (June–September) of 2016 using the data from two automatic weather stations (AWSs) and ablation measurements. The aims were as follows: (1) to investigate the similarities and differences of micrometeorological variables between the two types of glacier under the same influence of the Indian summer monsoon; and (2) to shed light on the differences in the energy balance between debris-free and debris-covered glaciers and subsequently to quantify their controls. It was hoped that the results of the study would reduce the uncertainties involved in future glaciological and hydrological modeling, and improve our knowledge of glacier/climate interactions in this mountainous monsoon-influenced glacierized region.
2. STUDY SITES AND MEASUREMENTS
2.1 Study sites
The study region is located in the southeastern Tibetan Plateau at the junction between the eastern Himalaya, eastern Nyainqentanglha Mountain and the western Hengduan Mountains (Fig. 1). Rotational deformation resulting from the collision of the Indian and Eurasian plates has produced an undulating terrain with deep valleys and high mountains, ranging from ~100 m a.s.l. to the highest peak in NamchaBarwa (7782 m a.s.l.). As a consequence of the tectonic activity, the Brahmaputra River turns from a west-east to a north-south direction and flows through a deep gorge, called the Grand Canyon. The Indian summer monsoon impinges on the Tibetan Plateau along this Grand Canyon (Ye and Gao, Reference Ye and Gao1979). The combination of the complex local topography and the Indian summer monsoon system results in a glacierized region of ~9470 km2 at high elevations (Shi and others, Reference Shi, Liu and Wang2008). As a result of recent climatic warming and decrease in monsoonal precipitation, glaciers in this region are retreating and experiencing significant mass loss (Yao and others, Reference Yao2012; Kääb and others, Reference Kääb, Treichler, Nuth and Berthier2015; Yang and others, Reference Yang, Guo, Yao, Zhu and Wang2016; Brun and others, Reference Brun, Berthier, Wagnon, Kääb and Treichler2017).

Fig. 1. The study region of the southeastern Tibetan Plateau: topography, glacier distribution (white shading) and locations of the debris-covered 24 K Glacier and debris-free Parlung No. 4 Glacier (black crosses) and the Bomi meteorological station (red square). Inset map shows the location of the study region in Asia.
Two glaciers (Parlung No. 4 Glacier and 24 K Glacier, 120 km apart) were selected as benchmark glaciers for meteorological and energy-balance comparisons in this region (Figs 1 and 2). The Parlung No. 4 Glacier (29°14′N, 96°56′E) is a debris-free valley glacier, which flows from 5964 m a.s.l. to 4650 m a.s.l., with an area of ~11.7 km2 and a length of nearly 8 km. It is located on the northern slope of eastern Mount Gangrigabu, the ridge altitude of which increases from west to east. The 24 K Glacier (29°45′N, 95°43′E) was selected as a comparative glacier on the western slopes of Mount Gangrigabu, and is closer to the Brahmaputra River. It is an avalanche-fed debris-covered valley glacier with ~47% of the total glacier area covered by debris. The 24 K Glacier has a lower average elevation range (from 3880 to 4800 m a.s.l.) and a smaller glacier area (2.7 km2) than the Parlung No. 4 Glacier. The debris thickness ranges from ~0.7 m at the terminus to sparse thin layers in the upper region at ~4200 m a.s.l. (Yang and others, Reference Yang, Yao, Xu and Zhou2010). Bomi city (2737 m a.s.l.), for which long-term meteorological records are available, is located in the lower part of the valley of the 24 K Glacier (Fig. 1).

Fig. 2. Topography and meteorological and glaciological monitoring at the Parlung No. 4 Glacier (a, c) and 24 K Glacier (b, d), together with the distribution of ablation stakes in the debris-covered zone. Note the different scales. The photographs shows the AWSs (a, b) and the surface types (c, d) on the respective glaciers.
2.2 Surface meteorological and ablation measurements
The AWSs were installed at 4800 m a.s.l. and 3900 m a.s.l. in the ablation zones of Parlung No. 4 Glacier and 24 K Glacier, respectively (Fig. 2). Both AWSs recorded meteorological variables (air temperature, relative humidity, wind speed/direction, incoming/outgoing shortwave and longwave radiation, and air pressure) at 30 min intervals using Campbell Scientific data loggers. The lithology of the debris surrounding the AWS at 24 K Glacier consists primarily of granites, schists and sandstones. The debris sizes are heterogeneous with boulders ranging up to 0.5 m overlying a surface with both fine-grained and gravel materials. Three debris temperature sensors were deployed at 5, 10 and 20 cm depth to measure the internal debris temperature of a 25 cm thick layer near the AWS at 24 K Glacier. All-phase precipitation at Parlung No. 4 Glacier was measured using a Geonor T-200B weighing bucket gauge, which was installed ~5.6 km north of the glacier terminus. Rainfall at 24 K Glacier was recorded using a tipping bucket HOBO RG3 rain gauge near the AWS. The records of surface albedo at both AWSs evidenced that most precipitation fell as rain on both glaciers during the observational periods. Wind direction data for Parlung No. 4 Glacier are not available due to an instrumental problem in 2016. The relevant surface meteorology and energy budget during the 2009 ablation season at Parlung No. 4 Glacier has been analyzed previously and detailed instrumental information was given in Yang and others (Reference Yang2011). Table 1 only lists the specifications of the AWS on the debris-covered 24 K Glacier. The AWSs were maintained for sensor leveling at monthly intervals from June to September, 2016.
Table 1. Specifications of the automatic weather station instrumentation on the debris-covered 24 K Glacier
One PVC ablation stake was inserted into the ice using a Heucke ice drill to measure ablation near each AWS on the two glaciers. The debris thickness at the ablation stake near the AWS on 24 K Glacier is ~20 cm. In order to assess the relationship between glacier melting and debris thickness, a total of 11 ablation stakes under debris thicknesses ranging from 36 to 1 cm were also deployed along the central axis of 24 K Glacier (Fig. 2). The ablation at each stake was measured during the maintenance of the AWSs. The stake data were converted to w.e. using an ice density of 900 kg m−3.
3. METHODS
3.1 Debris-free glacier energy-balance model
The surface energy-balance model on the debris-free Parlung No. 4 Glacier is described in detail by Yang and others (Reference Yang2011). The primary components can be specified as:
 $$S_{{\rm in}} + S_{{\rm out}} + L_{{\rm in}} + L_{{\rm out}} + H_{{\rm sen}} + H_{{\rm lat}} + G_{\rm p} + G_{\rm i} + Q_{{\rm melting}} = 0$$
where S in/S out are the incoming/reflected shortwave radiation; L in/L out are incoming/outgoing longwave radiation; H sen and H lat are the sensible and latent turbulent fluxes, respectively; G p is sensible heat energy supplied or consumed by precipitation falling on the surface; G i is the subsurface heat flux in snow/ice; and Q melting is the melting energy. Fluxes are positive when directed towards the surface and units are W m−2. The turbulent fluxes were calculated using the bulk aerodynamic method and the subsurface heat flux was estimated using a simple two-layer subsurface model:
 $$H_{{\rm sen}} = \rho _{{\rm air}} c_{\rm p} u_{\ast} T_{\ast} $$
 $$H_{{\rm lat}} = \rho _{{\rm air}} \lambda _{\rm s} u_{\ast} q_{\ast} $$
 $$G_{\rm p} = \rho _{\rm w} c_{\rm w} w(T_{{\rm air}} - T_{{\rm s})} $$
 $$G_{\rm i} = \rho _{{\rm ice}} c_{\rm s} K_{\rm s} \displaystyle{{\partial T_{{\rm ice}}} \over {\partial z}}$$
where ρ air, ρ ice and ρ w are the density of air, ice and water (kg m−3); c p, c s and c w are the specific heat capacity of air, ice and water, respectively (1005 J kg−1 K−1, 2090 J kg−1 K−1, 4181 J kg−1 K−1); λ s is the latent heat for sublimation (2.834 ×10⁶ J kg−1) or evaporation (2.514 ×10⁶ J kg−1); u *, T * and q * are defined in Yang and others (Reference Yang2011) with u * the friction velocity, and T * and q * the scaling parameters for air temperature (T air) and specific humidity (q air), respectively; w is the rainfall rate (m s−1); K s is the thermal diffusivity of ice (1.15 ×10⁻⁶ m2 s−1); T s is surface temperature (K); T ice is the ice temperature at different depths (z). The parameters and model performance for turbulent heat fluxes and melting were validated using eddy-covariance measurements and ablation stakes during the 2009 ablation season. For detailed model information and relevant parameters see Yang and others (Reference Yang2011), Guo and others (Reference Guo2011) and Reid and Brock (Reference Reid and Brock2010).
The eddy-covariance system has been moved from the AWS on Parlung No. 4 Glacier and thus the ablation recorded by the stake at different time intervals was used to corroborate the modeling accuracy during the 2016 ablation season. Figure 3a shows the modeled and measured cumulative ablation during the period from 1 June to 30 September 2016, and it is clear that modeled ablation closely matches the ablation measured by stakes. The total ablation calculated using the ablation stake and surface energy-balance model was −4.3 and −4.4 m w.e., respectively. Derived from the measurements and modeled outputs at five observational intervals, the mean absolute error was 0.12 m w.e., with RMSE of 0.15 m w.e. This result increases our confidence in the accuracy of radiation measurements and in the model's ability to capture the surface turbulent heat fluxes.
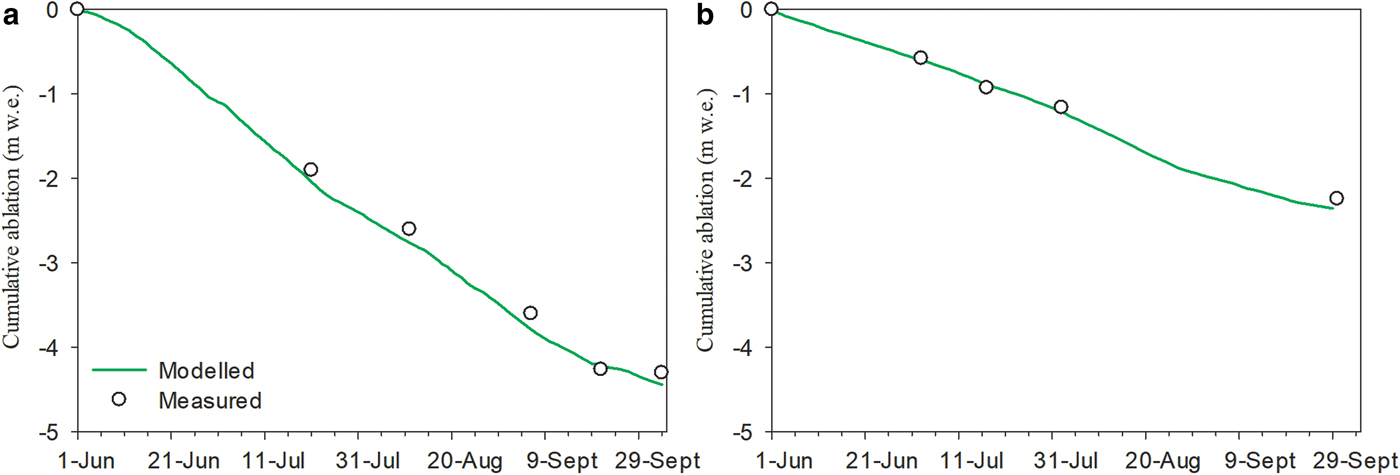
Fig. 3. Modeled and measured cumulative ablation near the AWS of Parlung No. 4 Glacier (a) and of 24 K Glacier (b). Circles represent measurements by ablation stakes.
3.2 Debris-covered glacier energy balance
Compared with debris-free glaciers, estimating the energy balance of a debris-covered surface is complicated by the highly variable surface debris temperature, surface humidity and thermal properties of the debris. The debris energy-balance model (DEB model) proposed by Reid and Brock (Reference Reid and Brock2010) was adopted in this study. The surface temperature was iteratively calculated in the model and detailed information about the parameters and detailed model description are given in Reid and Brock (Reference Reid and Brock2010). Its primary components are:
 $$S_{{\rm in}} + S_{{\rm out}} + L_{{\rm in}} + L_{{\rm out}} + H_{{\rm sen}} + H_{{\rm lat}} + G_{\rm p} + G_{\rm d} = 0$$
 $$H_{{\rm sen}} = \rho _{{\rm air}} \displaystyle{{c_{\rm p} k^2 u\,(T_{{\rm air}} - T_{\rm s} )} \over {(\ln (z_a /z_{0m} ))\,(\ln (z_a /z_{0t} ))}}(\Phi _{\rm m} \Phi _{\rm h} )^{ - 1} $$
 $$H_{{\rm lat}} = \rho _{{\rm air}} \displaystyle{{\lambda _{\rm s} k^2 u\,(q_{{\rm air}} - q_{\rm s} )} \over {(\ln (z_a /z_{0m} ))\,(\ln (z_a /z_{0q} ))}}(\Phi _{\rm m} \Phi _{\rm v} )^{ - 1} $$
 $$G_{\rm d} = k_{\rm d} \displaystyle{{T_{\rm d} (1) - T_{\rm s}} \over h}$$
where G d is the conductive heat flux (W m−2); k is von the Karman's constant (0.41); u is the wind speed (m s−1); z 0m , z 0t , z 0q are surface roughness lengths (m) for momentum, heat and humidity, respectively (assuming z 0m = z 0t = z 0q ); q air and q s are the specific humidity at the measurement height (z a = 2 m) and at the surface, respectively; Φm, Φv, Φh are nondimensional stability functions for momentum, moisture and heat, respectively; k d is thermal conductivity of debris (W m−1 K−1); T d is the debris temperature for different depths (K); and h is the thickness of each layer (0.01 m). Fluxes are also positive when directed towards the surface. The debris temperature in contact with the ice surface was assumed to be continuously at melting point throughout the observational period.
It is difficult to determine the latent heat flux without detailed knowledge of the relative humidity at the surface. Precipitation was abundant at 24 K Glacier, and following, more or less, the method similar to that of Rounce and others (Reference Rounce, Quincey and McKinney2015), the surface relative humidity of the debris was assumed to be 100% when it was raining (hourly total precipitation above 0.2 mm) and 0% when the debris was dry (H lat = 0).
Based on the linear function of the debris mean temperature recorded by three debris thermal sensors, the mean debris thermal conductivity (K d = 1.33 W m−1 K−1) was determined using the average thermal gradients and the in situ ablation measurements near the AWS (Drewry, Reference Drewry1972) and was subsequently assumed to be constant in the model. The K d at 24 K Glacier was within the ranges reported by previous studies in the Himalaya (e.g. Nakawo and Young, Reference Nakawo and Young1982; Rounce and others, Reference Rounce, Quincey and McKinney2015). With regard to the visibly greater roughness near the AWS (see the photograph in Fig. 2b) and the possible roughness boundaries (Rounce and others, Reference Rounce, Quincey and McKinney2015), the z 0m (0.028 m) was optimized to guarantee the minimum RMSE between the modeled and measured ablation during the observational period (Fig. 3b). The model was run using hourly-averaged values of meteorological variables and the debris temperature.
The modeling performance was validated using in situ measurements, including surface temperature (T s) derived from measured L out assuming that the debris acts as a black body, the debris temperature data at 5 cm, 10 cm and 20 cm depth near the AWS during the observational period. Figure 4 compares the simulated and measured surface temperature and internal debris temperature at different depths. The Nash–Sutcliffe model efficiency coefficient (E NS ) between modeled and measured T s and within-debris temperature at 5 cm, 10 cm and 20 cm depth demonstrated that the DEB model can reproduce the hourly variations with a good degree of fit (Fig. 4). The RMSE values between modeled and measured hourly T s and debris temperature at the three depths were 2.0, 2.0, 0.9 and 0.8°C, respectively. These multi-method comparisons indicated that the DEB model captures the primary processes, as well as demonstrating the appropriateness of the relevant parameters.

Fig. 4. Simulated and measured hourly and mean diurnal surface temperature (a, b) and debris internal temperature at 5 cm (c, d), 10 cm (e, f) and 20 cm depth (g, h) near the AWS on the 24 K Glacier, E NS is the Nash–Sutcliffe model efficiency coefficient.
3.3 Data processing under varying weather conditions
To compare the variation of atmospheric variables and energy fluxes in different weather conditions, we categorized subsets of the data for clear-sky and overcast conditions. Cloudiness index was firstly estimated from the measured incoming longwave radiation and air temperature, following the method suggested by van den Broeke and others (Reference van den Broeke, Reijmer, Van As and Boot2006) and Giesen and others (Reference Giesen, Van Den Broeke, Oerlemans and Andreassen2008). Polynomial fits through the 5th and 95th percentile levels of the incoming longwave radiation, binned into air temperature intervals of 0.5 K, are assumed to represent the minimum and maximum possible incoming longwave radiation at a given air temperature, corresponding to a cloudiness of 0 and 1, respectively. Assuming cloudiness increases linearly between these two limits, linear interpolation was used to calculate the cloud index for each hourly interval from corresponding measurements of the air temperature and incoming longwave radiation. We defined clear-sky conditions to occur when cloudiness values were <0.4 and overcast conditions when cloudiness values exceeded 0.9. Using this definition, atmospheric variables and energy fluxes for these contrasting weather conditions were compared in the following sections.
4. RESULTS
4.1 Surface meteorological comparison of debris-free and debris-covered glaciers
4.1.1 Air temperature and relative humidity
Mean air temperature at 24 K Glacier was 5.4°C higher than at Parlung No.4 Glacier, reflecting differences in elevation and surface type (Table 2). Because excess energy is used for melting the snow/ice surface at Parlung No. 4 Glacier, the overlying air is cooled (e.g. van den Broeke, Reference van den Broeke1997; Greuell and Böhm, Reference Greuell and Böhm1998) and the daily mean temperature on Parlung No. 4 Glacier rarely exceeded 6°C. In contrast, the air is warmed by radiative and convective heating from the underlying debris during daytime (Brock and others, Reference Brock2010). These cooling/warming effects contribute to the observed differences in daily and diurnal temperature variations between the debris-free Parlung No. 4 Glacier and the debris-covered 24 K Glacier (Figs 5a and 6a). The Std dev.s/diurnal amplitudes were 1.0/3.5°C and 1.5/4.7°C for Parlung No. 4 Glacier and 24 K Glacier, respectively. The warming effect at the debris-covered surface was particularly significant in clear-sky weather conditions (Fig. 7a and Table 3). The averaged air temperature in clear-sky conditions was ~1.1°C higher than that in the overcast conditions at 24 K Glacier, in comparison with the value of 0.5°C at Parlung No. 4 Glacier. The difference in diurnal amplitude between clear-sky conditions and overcast conditions was 5.5°C at 24 K Glacier, but only 2.0°C at Parlung No. 4 Glacier (Fig. 7a). This indicates that under clear-sky conditions, the presence of a thick debris layer greatly influences the air temperature, which was mainly driven by convective and radiative heating during daytime and cooling by sensible heat transfer at nighttime. Overall, the daily air temperatures at both glaciers were significantly correlated with a correlation coefficient of 0.6 (p < 0.01).
Table 2. Summary of monthly and seasonal mean meteorological variables from the 24 K Glacier (24 K) and Parlung No. 4 Glacier (Parlung)

Fig. 5. Comparison of mean daily meteorological data, including air temperature (a), relative humidity (b), incoming shortwave (c) and longwave radiation (d), wind speed (e) and precipitation (d), during the 2016 ablation season (June–September) between the Parlung No. 4 and 24 K Glaciers.

Fig. 6. Comparison of the diurnal variation of meteorological data between the Parlung No. 4 and 24 K Glaciers.

Fig. 7. Comparison of the diurnal variation of meteorological data for both Parlung No. 4 Glacier (Parlung) and 24 K Glacier (24 K) between clear-sky conditions and overcast conditions.
Table 3. Summary of mean meteorological variables and energy fluxes in overcast and clear-sky conditions at 24 K Glacier and Parlung No. 4 Glacier
The air was very humid at both glaciers with an average relative humidity of ~81% (Fig. 5b and Table 2). In addition, the fluctuations in daily relative humidity at both glaciers were similar, with a correlation coefficient of 0.71 (p < 0.01). Dramatic shifts from low to high humidity occurred in mid-June at both glaciers. In terms of diurnal fluctuations, both glaciers exhibited higher relative humidity during nighttime but drier air conditions during the afternoon (Fig. 6b). In contrast with the uniformity of the values on the debris surface during nighttime, the relative humidity at the snow/ice surface increased continuously until early morning due to water condensation by the cooled surface. The mean diurnal amplitudes are 23.1 and 12.6% for Parlung No. 4 Glacier and 24 K Glacier, respectively. During clear-sky weather conditions, both glaciers exhibit significant diurnal fluctuations with the mean amplitude being 26.0% for Parlung No. 4 Glacier and 29.4% for 24 K Glacier (Fig. 7b and Table 3). In contrast, the mean diurnal amplitudes during the overcast conditions were greatly reduced, with values of 18% at Parlung No. 4 Glacier and 6.2% at 24 K Glacier. Indeed, the continuous rainfall at 24 K Glacier (see in Section 4.1.4) provided abundant moisture and thus contributed to the lesser diurnal amplitude of relative humidity during the overcast and rainy days. In contrast, the debris surface warmed the above surface air by convective and radiative heating in clear-sky conditions, thus contributing to the significant diurnal fluctuations of relative humidity.
4.1.2 Incoming shortwave (S in) and longwave (L in) radiation
Both glaciers received approximately the same mean S in during the observational period (~213.0 W m−2) and exhibit similar diurnal variations (Fig. 6c). However, there were obvious differences in the pattern of daily variations (Fig. 5c) and correlation is moderate (r = 0.23, p < 0.05). During the whole observational period, the daily mean S in at 24 K Glacier was generally lower than at Parlung No. 4 Glacier, except for August. The mean S in in August at 24 K Glacier was 301.7 W m−2, ~97 W m−2 higher than the corresponding value at Parlung No. 4 Glacier. This reflects the different cloud and moisture conditions between the two glaciers (Fig. 5b and Table 2). The daily mean cloudiness was estimated to be ~0.69 at Parlung No. 4 Glacier but 0.75 at 24 K Glacier. The daily mean S in at 24 K Glacier exhibited high seasonal variability, with Std dev.s of 58.9 and 112.9 W m−2 during the whole observational period for Parlung No. 4 Glacier and 24 K Glacier, respectively. During the overcast conditions, the difference in mean S in between the two glaciated regions was limited (~17 W m−2) and their diurnal fluctuations had a similar form. In contrast, the mean value of S in during clear-sky weather conditions at 24 K Glacier was ~130 W m−2 greater than that at Parlung No. 4 Glacier and the peak in S in occurred 2 h earlier at 24 K Glacier (Fig. 7c and Table 3). This indicates that there were distinct differences in atmospheric transmissivities characteristics (e.g. water vapor, cloud thickness) between these two different climatic regimes during the clear-sky conditions.
The mean L in values were ~303 and 345 W m−2 for Parlung No. 4 Glacier and 24 K Glacier, respectively (Fig. 5d), with a strong correlation between the two glaciers (r = 0.80, p < 0.01). The larger L in at 24 K Glacier is a result of the warmer and cloudier weather. The temporal variability of L in was generally similar to that of the relative humidity. The correlation coefficients between L in and relative humidity are 0.86 and 0.79 for Parlung No. 4 Glacier and 24 K Glacier, respectively (p < 0.01). The diurnal patterns of L in between the two glaciers exhibit obvious phase differences, with the maximum values at 14 : 00 at Parlung No. 4 Glacier but at 16 : 00 at 24 K Glacier (Fig. 6d). Compared with the high variability of S in, the relatively low Std dev.s of daily mean L in (14.8 vs 20.9 W m−2), and a lower degree of diurnal variations in both clear-sky and overcast conditions (Fig. 7c), indicated the lesser role of L in in controlling both daily and diurnal variations in melting energy during the 2016 ablation season at the two glaciers.
4.1.3 Wind direction and speed
Despite the lack of wind direction data at Parlung No. 4 Glacier due to an instrumental problem in 2016, a previous study indicated that persistent katabatic (glacier) winds control the near-surface air flow (Yang and others, Reference Yang2011). For 24 K Glacier, the dominant wind direction ranged from 310° to 330°, corresponding to the glacier flow path (the orientation of the glacier's central axis is ~310°) and indicating that katabatic winds were also common at this debris-covered glacier.
Although both glaciers are influenced by katabatic winds, local factors including glacier size, length and surface conditions (melting snow/ice and debris cover), contribute to the different magnitudes of katabatic wind. The wind speeds were on average 1.8 times higher at Parlung No. 4 Glacier (Fig. 5e and Table 2); in addition, they were more variable with a Std dev. of 0.69 m s−1, in comparison with 0.24 m s−1 at 24 K Glacier. The wind speeds at both glaciers did not exhibit significant seasonal trends over the observational period. The correlation coefficient in mean daily wind speeds was modest (r = 0.33, p < 0.05). There was a significant difference during the daytime when katabatic winds were common at Parlung No. 4 Glacier. At Parlung No. 4 Glacier, the wind speed increased dramatically when the sun rose at ~09 : 00, reached a maximum at 18 : 00, and then decreased; the diurnal amplitude was 3.5 m s−1 (Fig. 6e). In contrast, the wind speed at the debris-covered 24 K Glacier was characterized by lower diurnal variability, with a mean amplitude of 0.78 m s−1. During clear-sky conditions, the mean wind speed (2.34 m s−1) at Parlung No. 4 Glacier was ~0.58 m s−1 greater than that in overcast conditions (2.92 m s−1), while it was slightly increased from 1.57 to 1.67 m s−1 at 24 K Glacier (Table 3). Wind speed in the afternoon during clear-sky conditions was significantly larger than that during overcast conditions at Parlung No. 4 Glacier, which shows that under clear sky conditions the katabatic wind is much stronger (Fig. 7d). In contrast, there were limited changes in both mean wind speed and diurnal amplitude at the debris-covered 24 K Glacier between clear-sky and overcast conditions.
4.1.4 Precipitation
The most striking difference between the two glaciers was in precipitation (Fig. 5f). The total precipitation amount during the observational period at 24 K Glacier was approximately nine times that at Parlung No. 4 Glacier (1696.8 vs 189.6 mm). The continuous and abundant precipitation at 24 K Glacier was punctuated by an episode of lower precipitation in August. The maximum monthly precipitation totals were concentrated in September (638.8 mm) at 24 K Glacier and in July (89.7 mm) at Parlung No. 4 Glacier, while the minimum totals were in August (158.6 mm) and June (16.2 mm). Precipitation during nighttime (21 : 00–8 : 00) accounted for ~60 and 67% for the precipitation at 24 K Glacier and Parlung No. 4 Glacier, respectively (Fig. 6f). Figure 8 also compares precipitation intensity between the two glaciers. The most common precipitation intensity was 8–16 mm d−1 and occasional strong rainfall storms (>60 mm d−1) were recorded at 24 K Glacier; on 23 September the maximum daily total precipitation even exceeded 88 mm. In contrast, at Parlung No. 4 Glacier, 98 of the 122 days from June to September were rain-free or experienced little precipitation (<2.0 mm d−1).
Fig. 8. Comparison of precipitation intensity between the Parlung No. 4 and 24 K Glaciers from June to September.
Such large differences can be partly explained by the complex topography and terrain exposure. Geographically, the east-west Gangrigabu Mountain plays a critical role as a barrier for precipitation (Fig. 1); 24 K Glacier is located on the windward side, whereas Parlung No. 4 Glacier is located on the leeward side. In addition, 24 K Glacier is closer to the Brahmaputra Grand Canyon, which acts as a corridor for long-range moisture transfer (He and others, Reference He, Li and Zhang2007); moreover, the ridge of eastern Gangrigabu Mountain is lower in the vicinity of 24 K Glacier. Therefore, the windward 24 K Glacier received exceptionally heavy orographic rainfall, whereas much less precipitation fell on the leeward Parlung No. 4 Glacier. This high degree of precipitation variability means that knowledge of the horizontal and altitudinal distribution of precipitation is essential for regional glaciological and hydrological studies throughout the mountainous southeastern Tibetan Plateau region.
4.2 Surface energy balance comparison between debris-free and debris-covered glaciers
Figure 9 illustrates the mean daily and diurnal cycles of surface energy fluxes near the AWSs on the two glaciers during the period from June to September 2016. For Parlung No. 4 Glacier the main energy contribution was net shortwave radiation (S net: + 142.6 W m−2), followed by the sensible heat flux (H sen : + 17.1 W m−2). A minor release of heat by water vapor condensation contributed to the surface melting (H lat: + 1.5 W m−2). The net longwave radiation acts as a heat sink (L net: −13.0 W m−2) and the subsurface heat flux G i is <−2.4 W m−2 and the sensible heat by precipitation G p is negligible (+0.07 W m−2). Most of the surface energy was used for surface snow/ice melting (Q melting: −145.9 W m−2). Overall, the S net was mirrored by Q melting at both daily and diurnal scales. The hourly melting energy reached a maximum at ~15 : 00, which corresponded to the maximum hourly S in .

Fig. 9. Daily mean and diurnal cycle of surface energy fluxes near the AWSs on the debris-free Parlung No. 4 Glacier (a, b) and debris-covered 24 K Glacier (c, d), together with daily fluctuations in surface albedo.
For the debris-covered surface at 24 K Glacier, mean energy supply by precipitation (~+0.1 W m−2) was negligible compared with the other fluxes. The S net was assumed to be the only net energy input (+201 W m−2) during the ablation season. The other energy components were all energy sinks, accounting for −87.1 W m−2 by H sen, −25.2 W m−2 by L net, −25.0 W m−2 by H lat (evaporative) and −63.8 W m−2 by G d. Significant negative correlations between S net and H sen were observed during the observational period (r = 0.97, p < 0.01). These results indicate that the debris surface was heated by S in and the corresponding surface temperature rise resulted in increased energy output mainly through H sen (Brock and others, Reference Brock2010). With regard to the diurnal magnitude of each flux, maximum G d occurred at 11 : 00–12 : 00 at the debris surface on 24 K Glacier. The DEB model showed that thermal conduction required 10–11 h to result in peak melt beneath the 25 cm thick debris layer.
In spite of the same mean S in during the observational period (~213 W m−2) at the two glaciers, the lower mean surface albedo (0.05) due to the dark debris material at 24 K Glacier contributed to ~58 W m−2 more solar energy absorbed by the debris surface than that at the debris-free Parlung No. 4 Glacier with a mean surface albedo of 0.32 (Fig. 9 and Table 4). In addition, due to the more humid and warm air at 24 K Glacier, the L in was ~42 W m−2 higher; energy supply from the atmosphere to the debris surface was therefore significantly greater in the vicinity of 24 K Glacier. However, the energy supply (S net + L in: 545.8 W m−2) was mainly consumed by heating the debris surface, which led to higher surface temperatures than air temperatures (Fig. 10). Most of the energy at 24 K Glacier was consumed by L out, H sen, and H lat. The G d was restricted to only −63.8 W m−2 at the AWS location. The debris cover, therefore, provided effective insulation for the underlying ice by returning the energy supply to the atmosphere as longwave radiation, sensible heat flux and evaporation. In contrast, due to the upper limit of the temperature (0°C) of the snow/ice surface, the air temperature during the ablation season was generally higher than the surface temperature at Parlung No. 4 Glacier (Fig. 10). The mean value of L out on the debris-free surface remained at constant values of −316.1 W m−2; however, the energy supply (S net + L in + H sen + H lat) was as much as 461.8 W m−2, leading to a residual energy of ~145.9 W m−2 for snow/ice melting. Thus, the existence of the debris layer not only resulted in a different surface albedo (0.05 vs 0.32), but it also resulted in differences in energy fluxes, particularly for the outgoing longwave radiation and turbulent fluxes between the debris-free and debris-covered glacier. Consequently, the calculated daily melt rates were 35.2 mm d−1 at Parlung No. 4 Glacier, in comparison with 19.5 mm d−1 at 24 K Glacier.

Fig. 10. Mean diurnal variations of 2-m air temperature and surface temperature at the snow/ice surface on the Parlung No. 4 Glacier (a) and on the debris-covered surface of the 24 K Glacier (b).
Table 4. Mean meteorological and energy fluxes at the debris-free Parlung No. 4 Glacier and debris-covered 24 K Glacier in 2016 (1 June–29 September), together with available comparative data for the Parlung No. 4 Glacier in 2009 (21 May–8 September, Yang and others, Reference Yang2011) and the debris-covered Miage Glacier, Italy in 2005 (22 June–2 September, Brock and others, Reference Brock2010)
* The Miage Glacier Data are for the lower AWS at 2030 m a.s.l; – represents no data available.
5. DISCUSSION
5.1 Comparison of the energy fluxes under different weather conditions
To investigate the melting magnitudes and their controlling energy fluxes under different extreme weather conditions, the energy fluxes between clear-sky and overcast weather conditions were compared between Parlung No.4 Glacier and 24 K Glacier (Fig. 11). Table 3 lists in detail the values of energy fluxes under different weather conditions. It is clear that for Parlung No. 4 Glacier, a large difference in surface energy balance occurs in S in and L in. Overall, compared with clear-sky conditions, the decrease in S in at Parlung No. 4 Glacier was mainly compensated by the increased L in supply in overcast conditions. Such radiation compensation has been also recorded in many temperate glaciated regions (e.g. Conway and Cullen, Reference Conway and Cullen2016). In addition, the decreased H sen was to some extent balanced by the increased H lat release by water condensation in the overcast conditions. Consequently, the surface energy for melting during overcast conditions was only 3.3 W m−2 lower than that in clear-sky conditions and average daily melt rates were of a similar magnitude between overcast and clear-sky conditions.
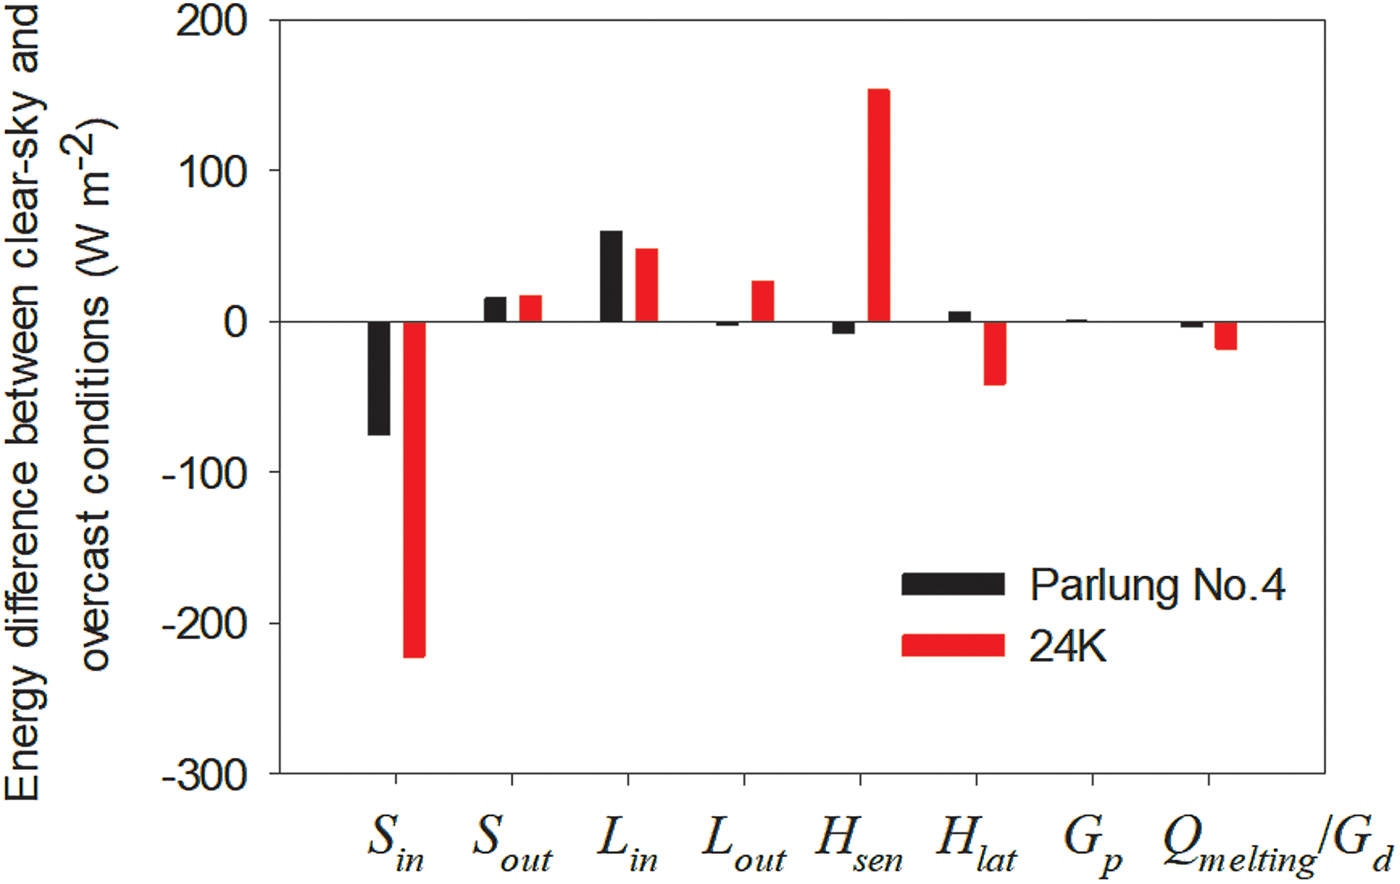
Fig. 11. Differences in surface energy fluxes between overcast and clear-sky conditions at Parlung No. 4 Glacier and 24 K Glacier.
In contrast, the energy discrepancy between overcast and clear-sky conditions exhibits a different pattern at the debris-coved 24 K Glacier. The difference in mean S in between these two contrasting weather conditions was ~222 W m−2. In contrast to the radiation compensation at Parlung No.4 Glacier, the decrease in S in in overcast conditions was significantly compensated by the weakened sensible heat loss, rather than the increased L in (Table 3). Thus there is a S in–H sen compensation pattern in the case of the debris-covered 24 K Glacier. In addition, due to the wetter conditions when the sky was overcast, the energy consumption by surface evaporation was also greater than in clear-sky conditions. Overall, the surface energy for melting in overcast conditions was 18 W m−2 less than that in clear-sky conditions. This comparison, on the one hand, reveals different response patterns of surface energy fluxes to weather conditions. On the other hand, it indicates that debris-covered glaciers in relatively warm and humid climatic regimes, similar to 24 K Glacier, are more sensitive to the sky conditions, which affected the relevant energy fluxes. This finding raises the important possibility that the evolution of the Indian summer monsoon would result in different responses of glacier energy balance and mass loss between debris-free and debris-covered glaciers in the monsoon-influenced Tibetan Plateau (e.g. Conway and Cullen, Reference Conway and Cullen2016; Yang and others, Reference Yang, Guo, Yao, Zhu and Wang2016).
5.2 Comparison of the energy fluxes with those of other studies
The surface energy fluxes during the 2016 ablation season at the debris-free Parlung No. 4 Glacier were compared with the available results for the 2009 ablation season in order to clarify the dominant fluxes controlling the annual changes of surface melting in the ablation zone (Table 4). The energy fluxes between the two ablation seasons exhibit similar magnitudes and patterns, reflecting the basic energy characteristics in the ablation zone of the debris-free glaciers in the southeastern Tibetan Plateau. However, the surface energy for melting (Q melting) during the 2016 ablation season was ~29 W m−2 less than during 2009, in spite of the same mean air temperature (3.7°C). It is noteworthy that the total amount of precipitation was ~58% greater during the 2016 ablation season. The more humid air and cloudier conditions, therefore, resulted in a substantial reduction in S in (−29 W m−2). However, the mean atmospheric conditions during the 2016 summer season were not as humid/cloudy as that in the extreme overcast conditions in Section 5.1 (e.g. relative humidity: 81.0 vs 88.1%), while there was a lesser increase in L in (+8 W m−2) and the decrease in S in was not greatly compensated by the increased L in supply. In addition, the surface albedo in 2016 was higher than that in 2009, partly contributing to the lower absorption of solar radiation at the snow/ice surface. Moreover, due to the weaker katabatic wind (3.2 m s−1 in 2009 vs 2.7 m s−1 in 2016), H sen decreased from +28 to +17 W m−2. Both L out and H lat exhibited limited differences between the two ablation seasons. Overall, the reduced Q melting in the 2016 ablation season was mainly attributed to the significant decrease in both S in and H sen. These comparisons of the energy components between the two different ablation seasons and the two extreme weather conditions in Section 5.1 indicate that the magnitudes of snow/ice melting were indeed linked to the variation of atmospheric conditions (e.g. cloud and water vapor), which control the magnitude of surface energy fluxes, and further demonstrates that the Indian summer monsoon significantly influences the glacier energy balance and mass loss in the southeastern Tibetan Plateau (Yang and others, Reference Yang, Guo, Yao, Zhu and Wang2016).
Few detailed energy-balance results are available for debris-covered glaciers. However, the published results (e.g., Takeuchi and others, Reference Takeuchi, Kayastha and Nakawo2000; Brock and others, Reference Brock, Rivera, Casassa, Bown and Acuñn2007, Reference Brock2010) indicate that the net surface energy balance of the thick debris surface was supplied solely by solar radiation but was consumed by H sen, L out, H lat and G d. A detailed meteorological and energy-balance study of a debris-covered glacier was conducted at Miage Glacier in the Italian Alps (Brock and others, Reference Brock2010). Although both Miage Glacier and 24 K Glacier likely experience significant interannual variability in meteorology, the comparison of meteorological variables and energy fluxes between the two glaciers is potentially helpful for understanding the different mechanism of glacier response in the Himalaya compared with the European Alps. Comparison of the available energy fluxes during the 2005 ablation season on Miage Glacier (Table 4) with those for 24 K Glacier in the present study indicates that there is a significant difference in L in and S in, which reflects the different climatic contexts of glaciers in the European Alps and in the Himalaya. The 24 K Glacier was significantly influenced by the Indian summer monsoon, with higher moisture, precipitation and cloud cover: relative humidity at 24 K Glacier was ~81.4%, in contrast to the value of 66% for the Miage Glacier. In addition, total precipitation was ~5 times greater in the case of 24 K Glacier (Table 4). The monsoonal climate is therefore characterized by higher L in but smaller S in. In addition, the albedo of the dark debris material at the 24 K Glacier (0.05) is significantly lower than that at Miage Glacier (0.13), reflecting differences in debris lithology. The energy supply (S net + L in: 545.8 W m−2) at 24 K Glacier was ~28 W m−2 higher than that at the Miage glacier in the Alps. However, the corresponding greater energy loss by H sen, L out and H lat at 24 K Glacier, in turn, lead to a limited difference (7 W m−2) in G d compared with the Miage Glacier. This comparison indicates that despite the significant difference in energy supply in the different climatic regimes, the occurrence of a debris cover greatly attenuates sub-surface melting by changing the magnitude and pattern of surface energy loss.
5.3 The role of debris thickness on surface energy balance and melting
Previous studies have demonstrated that debris thickness greatly influences glacier melting (e.g. Sakai and others, Reference Sakai, Nakawo and Fujita2002; Benn and others, Reference Benn2012; Zhang and others, Reference Zhang, Hirabayashi, Fujita, Liu and Liu2016). Based on the ablation stake measurements with different debris thicknesses on the 24 K Glacier (Fig. 2), there is clearly an exponential relationship between debris thickness and sub-debris ice melting (Fig. 12a). The maximum melt rate was ~57 mm w.e. day−1 beneath the thin debris layer (~1–2 cm) at the upper limit of the debris cover, in spite of the relatively lower air temperature at higher elevations. The minimum melting was only ~8 mm w.e. day−1 beneath a debris thickness of 36 cm at the glacier terminus. The maximum rate of change in melt rates occurred within a debris thickness of <~10 cm, which was in agreement with previous measurements during the 2008 ablation season (Yang and others, Reference Yang, Yao, Xu and Zhou2010).

Fig. 12. (a) Measured daily melt rate at the ablation stakes and the modeled melting curve near the AWS for 24 K Glacier, assuming the same meteorological input, as a function of debris thickness. (b) Variations in energy components calculated for different debris thicknesses.
In order to ascertain the influence of debris thickness on melting from a surface energy perspective, the surface energy-balance model described in Section 3.2 was re-run under different debris thicknesses and under a clear-ice condition with the assumed same meteorological conditions at the AWS location. The experiment under different debris thicknesses ignored the warming effect of debris on the air temperature because of the limited availability of data required to quantitatively exclude the effect (Brock and others, Reference Brock2010). The theoretical melting curve and energy fluxes in relation to debris thickness at the location of the AWS at 3900 m a.s.l are illustrated in Fig. 12b. It is clear that with the decrease in debris thickness, the energy consumption by H sen is dramatically reduced while G d increases synchronously. Although the magnitudes of changes in both L net and H lat were dissimilar to that of H sen, they exhibited a similar pattern of decrease to H sen. Notable changes in G d from −270 to −105 W m−2 occurred between a debris thickness of 1 and 10 cm (Fig. 12b). The rate of reduction in G d was attenuated with a thickness ranging from 10 cm to 40 cm and exhibited a negligible change when the debris thickness exceeded ~40 cm. When the AWS location at 24 K was assumed to be bare ice, similar to Parlung No. 4 Glacier, turbulent heat fluxes were calculated by using the debris-free glacier energy-balance model in Section 3.1 by assuming the mean ice albedo of 0.25 and the same ice roughness of 0.8 mm. The results showed that L net changed from −25 to +28 W m−2, H sen from −87 to +6.1 W m−2, and H lat from −25 to +5.7 W m−2. The total energy for melting would increase greatly to −199.4 W m−2. This means that the existence of the 25 cm thick debris layer would produce a 68% decrease in the energy for melting compared with assumed bare ice conditions. When the debris was sufficiently thin (~1–2 cm), the surface debris temperature was actually as low as the melting point (0°C). The sign of H sen, H lat and L net turned from negative to positive, indicating a shift from energy consumption to energy supply and greater energy transport from the warm and humid air to the glacier surface. Consequently, the maximum ablation generally occurs in the thin layers due to both the greater absorption of S in as a result of the low surface albedo and the pattern of changes in the surface energy balance. However, in the upper sections of the glacier, the sparsely scattered thin debris cover would have a higher albedo than a completely debris-covered surface. When the debris cover is less than a certain ‘effective thickness’ (Kirkbride and Dugmore, Reference Kirkbride and Dugmore2003), the melt rate will decrease towards the bare-ice melt rate as the debris thickness tends toward zero, which is in agreement with the ‘Østrem curve’ (Østrem, Reference Østrem1959). Therefore, melting on the debris-covered 24 K Glacier not only depends on the energy supply from the atmosphere, but is also critically linked to the distribution of debris thickness which will alter the patterns and magnitudes of supply and consumption (in particular of H sen, H lat and L net), especially beneath a thin (<10 cm) debris layer.
6. CONCLUSIONS
We have conducted a comparative investigation of the meteorology and surface energy balance of a debris-free and a debris-covered glacier in the southeastern Tibetan Plateau. Although the distance between the two glaciers is only 120 km, there are considerable differences in the meteorological conditions and energy balance due to the contrasting surface conditions and local climatic backgrounds. Notable differences in temporal fluctuations of meteorological variables between the two glaciers occur in precipitation, S in and wind speed; and they may reflect local factors such as topography, glacier scale and surface conditions (snow/ice, debris). The total precipitation amount at 24 K Glacier was approximately nine times larger than that at Parlung No. 4 Glacier. In contrast, the wind speeds were on average 1.8 times higher at Parlung No. 4 Glacier. During the whole observational period, the daily mean S in at 24 K Glacier was generally lower than that at Parlung No. 4 Glacier, except for August. Other variables, including air temperature, relative humidity and L in, exhibited a simultaneous pattern of fluctuations, indicating a synoptic-scale pattern in the monsoon-influenced southeastern Tibetan Plateau. The 24 K Glacier experiences a relatively warmer and wetter climate, while the Parlung No. 4 Glacier experiences a colder and drier climate.
Although the two glaciers received the same amount of S in during the observational period (~213 W m−2), more solar energy (58 W m−2) was absorbed at the debris surface due to the lower mean surface albedo (0.05). In addition, the warm and humid air at the 24 K Glacier contributed ~45 W m−2 more to L in than at the Parlung No. 4 Glacier; therefore, the radiation supply was significantly greater in the area of the 24 K Glacier. However, the debris cover provided effective insulation for the underlying ice by returning energy to the atmosphere in the form of H sen, L out and H lat (evaporation). The existence of a debris layer not only led to the differences in surface albedo (0.05 vs 0.32), but was also responsible for the differences in energy fluxes including the L out (−370 W m−2 for 24 K Glacier vs −316 W m−2 for Parlung No. 4 Glacier) and the turbulent fluxes (H sen: −87 W m−2 for 24 K Glacier vs +17 W m−2 for Parlung No. 4 Glacier; H lat: −25 W m−2 for 24 K Glacier vs + 1.5 W m−2 for Parlung No. 4 Glacier) between the debris-free and debris-covered glaciers. In addition, comparison of energy fluxes between overcast and clear-sky weather conditions revealed that the compensation by increase L in for lower levels of S in contributed to the similar magnitude of energy fluxes for melting between clear-sky and overcast conditions at Parlung No. 4 Glacier. A contrasting S in–H sen compensation pattern dominated at the debris-covered 24 K Glacier. Overall, the energy available for melting in clear sky condition was 18 W m−2 more than that in overcast conditions at 24 K Glacier.
In addition, both in situ measurements and a sensitivity experiment indicated that debris thickness greatly influences glacier melting within a ~10 cm range of debris thickness, due to the dramatic positive-direction changes in energy components. With the decrease in debris thickness, the energy consumption by turbulent heat fluxes and outgoing longwave radiation would be dramatically reduced and the sign of turbulent heat fluxes and net longwave radiation turned from negative to positive when the debris was sufficiently thin. Comparison of meteorological variables and energy fluxes between the 2009 and 2016 ablation seasons at Parlung No. 4 Glacier indicated that the change in monsoonal precipitation and katabatic wind could significantly influence the magnitude of surface melting by changing the energy input of S in and sensible heat fluxes. Finally, more detailed studies of the spatiotemporal variation of monsoonal precipitation and debris thickness are needed for future regional glaciological and hydrological studies in this mountainous glacierized region.
ACKNOWLEDGEMENTS
Special thanks to T.M. Reid for providing the debris surface energy balance model. The meteorological data exploited in this study are available at the Third Pole Environment Database (http://en.tpedatabase.cn/). We thank two anonymous reviewers and scientific editor Dr Joe Shea for valuable insights that greatly strengthened the manuscript. This study was jointly funded by the National Natural Science Foundation of China (Grants 91547104, 91647205 and 41371085) and the Chinese Academy of Sciences (Grant QYZDY-SSW-DQC003).


 Open access