

Introduction
The change in mass is a key value in glaciology. It is the direct response to climate variations, and regulates ice dynamics and glacier behaviour. The measurement of mass balance as a main task of glaciological research is of great scientific and practical interest.
There are three methods for determining mass balance: glaciological, geodetic and hydrological (Reference HoinkesHoinkes, 1970). The glaciological method is also called the direct, traditional or stakes-and-pits method, while synonyms for the geodetic method are the photogrammetric/topographic method and map comparison. New technologies such as global positioning system (GPS) surveying (Reference Hagen, Melvold, Eiken, Isaksson and LefauconnierHagen and others, 1999; Reference Theakstone, Jacobsen and KnudsenTheakstone and others, 1999) and airborne laser profiling (Reference Sapiano, Harrison and EchelmeyerSapiano and others, 1998; Reference Favey, Geiger, Gudmundsson and WehrFavey and others 1999) are simplified versions or extensions of the geodetic method. Although they represent future trends in mass-balance measurement techniques, they are still at the assessment and improvement stage.
As the accuracy of the glaciological and hydrological methods is difficult to assess, it is valuable to apply several methods when possible. However, this requires a considerable logistical effort and financial cost, so it can rarely be done.
In the Tuyuksu glacier region in the Tien Shan, Central Asia, a map from 1958 (Reference Simon, T¨ppler and PillewizerSimon and others, 1961) and a long series of direct mass-balance and hydrometeorological measurements were the basis for producing an up-to-date contour map (KfG, 2003). Consequently, it is now possible to apply and compare all three conventional methods of mass-balance determination in a Central Asian glacier region. This study describes the application of the methods and discusses the results with regard to the quality and significance of the individual methods of mass-balance determination.
Geographical Setting
The Tuyuksu area (Fig. 1) is located on the northern slope of the Zailiskiy range in the Kazakh part of the Tien Shan. For the nearby city of Almaty, the glacier region is both a major water supplier and a natural hazard, and as such attracted public and scientific interest as early as the beginning of the 20th century. Detailed investigations began in 1956 as part of the International Geophysical Year, and since then the Tuyuksu region has been a major focus of glaciological, hydrological and climatological research in Central Asia.
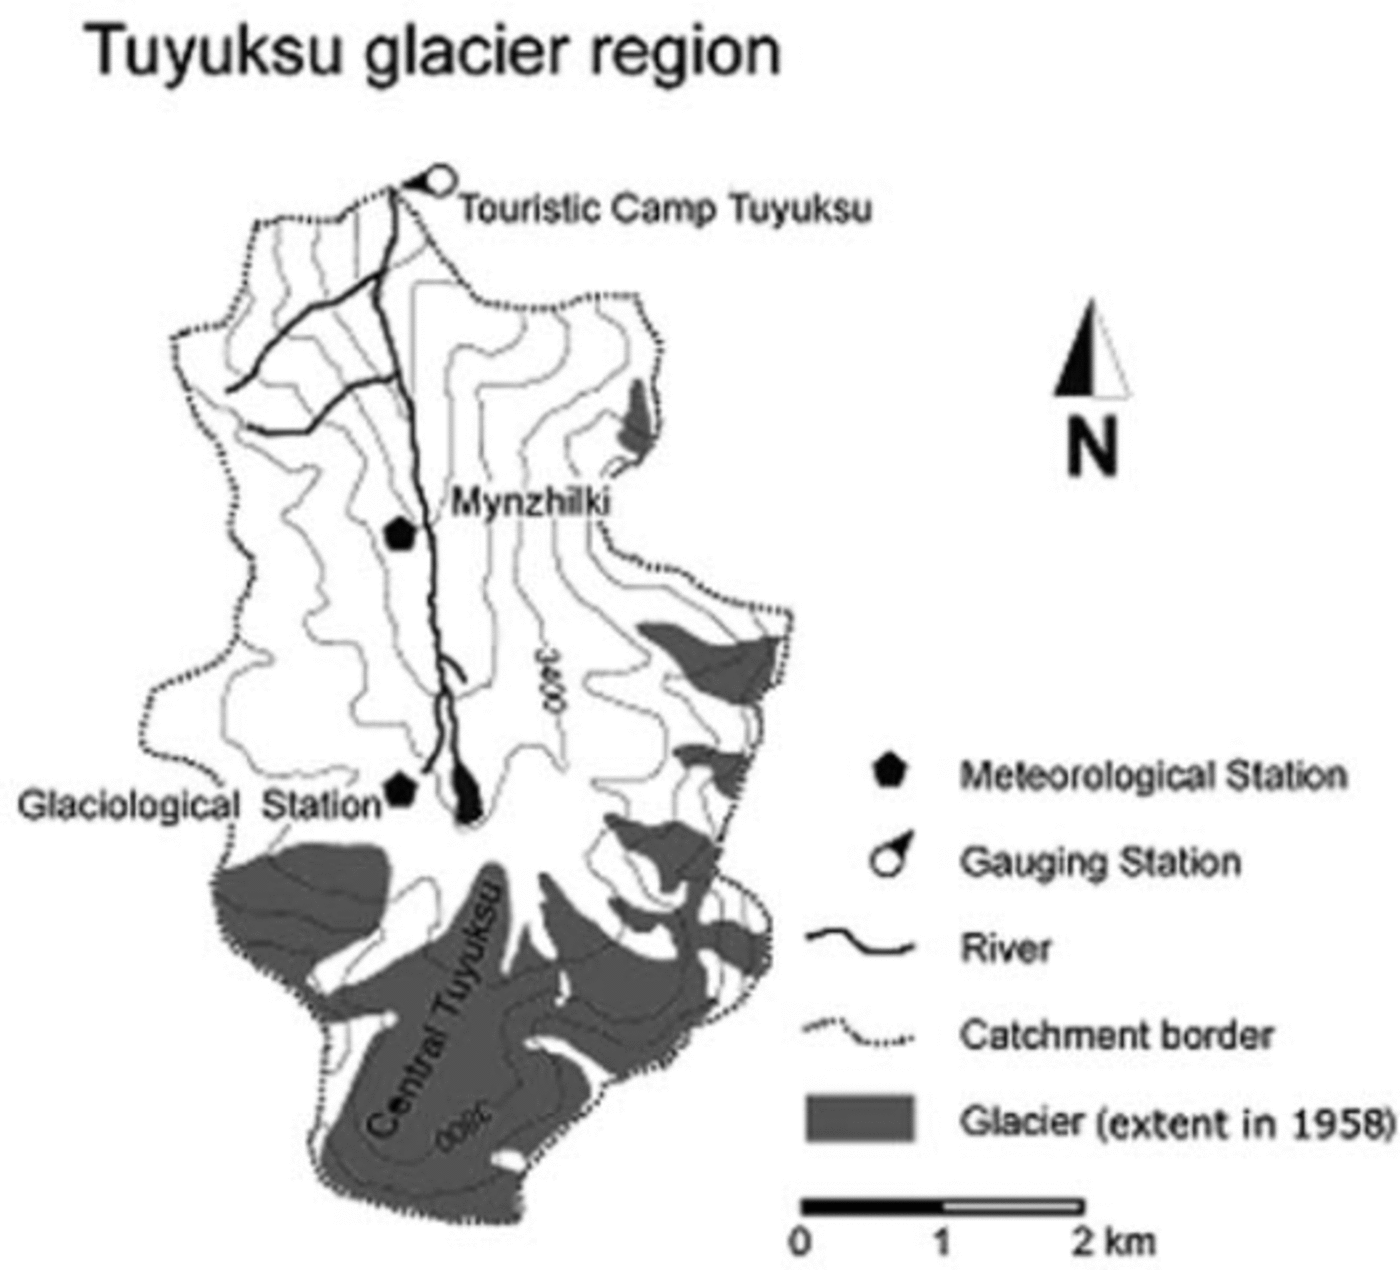
Fig. 1. Schematic sketch of the investigation area.
Meteorological measurements have been carried out since 1956 at the Glaciological Station (3434m a.s.l.) and since 1937 at the Mynzhilki station (3017 ma.s.l.). Daily means are derived from seven manual measurements. Runoff data are taken from the gauging station, ‘Tourist Camp Tuyuksu’, where the water level is observed twice a day and related to discharge by repeated current-meter calibrations. The catchment area is 28km2, with a total glaciation of 7 km2. The largest of the nine glaciers is central Tuyuksu, a valley-type glacier with an area of 2.6 km2 and an altitudinal range of 3415–4219 m a.s.l. (in 1998). The smaller cirque and hanging glaciers are, in decreasing order of size: Igli Tuyuksu, Molodoshny, Mametova, Kosmodem-janskaja, Majakowski and Ordshonikidse. Partisan glacier is treated in this study as part of Igli Tuyuksu. The basin is drained by the Little Almatinka river, a tributary of Ili river, which ends in Balkash lake.

Fig. 2. Topography and observational network of central Tuyuksu (from Reference Haeberli, Frauenfelder and HoelzleHaeberli and others, 2001).
In the northern Tien Shan, a recent pronounced glacier retreat can be observed. From 1955 to 1990, the glacierized area and the ice volume on the northern slope of the Zailiskiy range was reduced by about 30%. In the 1980s, the retreat was twice that from 1955 to 1979 (Reference Vilesov and UvarovVilesov and Uvarov, 1998). This development is of great importance for the water supply of Almaty and the irrigation of the surrounding areas.
Methods
Glaciological method
The usual method for determining the mass budget is to measure income and expenditure on the glacier surface, referenced to the melt horizon (summer surface) of the previous year. In the accumulation area, the thickness and density of the snow and firn are normally investigated in cores or pits. Ablation of ice is determined by means of stakes, assuming an ice density of around 900kg m–3. In regions with very deep snow, accumulation is also sometimes measured using stakes. This often leads to problems due to sinking of the stakes into the firn (Reference Østrem and BrugmanØstrem and Brugman, 1991). The measurements should be carried out at representative points, and difficulties can arise on glaciers with larger inaccessible areas. Even if a number of appropriate points can be found, the interpolation for the whole glacier area constitutes the main source of error (Reference PatersonPaterson, 1994). Additional errors are made in the measurements (random error) or by a bias in methodology (systematic error) such as an insufficient number of stakes or the neglecting of percolating meltwater (internal accumulation) into the previous year’s firn layer (Reference DyurgerovDyurgerov, 2002). Mass balances from direct measurements are always combined with a measure of uncertainty, as their accuracy is difficult to assess. In most cases, the accuracy of the method is in the centimeter to decimeter range (Reference Haeberli, Hoelzle, Suter and FrauenfelderHaeberli and others, 1998).
In the Tuyuksu region, mass-balance measurements have been carried out since 1956, representing the longest time series in Central Asia (Reference Dyurgerov, Uvarov and KostjashkinaDyurgerov and others, 1996). Up to the mid-1960s, there existed a network of stakes along longitudinal profiles and cross-sections on central Tuyuksu (Reference MakarevichMakarevich and others, 1969). During the International Hydrological Decade (1965–74) this network was expanded to 150–180 stakes over the entire glacier except the steep slopes (Fig. 2).
The stakes measure accumulation in the firn area or ice melt in the ablation area. The density of the snow is measured in pits along profiles and at representative points. The balance year is defined to begin on 1 October, independent of the timing of the first snowfall (fixed date system). The amount of meltwater that percolates into the previous year’s firn layer is also considered for mass-balance calculations. From 1957 to 1978, this ‘internal accumulation’ was investigated by temperature measurements at different depths of the firn layer. It constitutes 6–7% of the total accumulation (Reference TsykinTsykin, 1962), while the absolute value is estimated to be as large as 50kgm–2 (Reference Golubev and DyurgerovGolubev and Dyurgerov, 1973). After 1978, internal accumulation (IA) was calculated as a portion of total accumulation by the Vilesov equation (Reference Vilesov and UvarovVilesov and Uvarov, 2001):

where Ab is ablation, Ac is winter accumulation and both values have to be known in each elevation zone of the accumulation area. This equation is only applicable above the equilibrium line, where Ac is larger than Ab.
In a final step, areas of equal accumulation and ablation are defined on a map by drawing isolines, and the basic components of mass balance are calculated for 50 m elevation zones and for the entire glacier. The absolute error of annual mass balance is estimated to be 40–60 mmw.e., based on the standard errors of winter and summer accumulation, ice and snow ablation, internal accumulation and the accumulation due to superimposed ice.
Mass balances for the other glaciers in the Tuyuksu region tend to be rough estimates. Accumulation is determined by extrapolation from slopes of the central Tuyuksu having comparable steepness, and corrected by means of precipitation data from 22 totalizers located in the area (Reference Makarevich, Vilesov, Golovkova, Demisova and ShabanovMakarevich and others, 1984). The annual mass balance of all glaciers, determined by the glaciological method, is shown in Figure 3.

Fig. 3. Cumulative specific mass balances for glaciers in the Tuyuksu region.
Geodetic method
The geodetic method is based on comparison of accurate topographic maps and determination of the volume change for the period between the photogrammetric surveys. The water equivalent can be calculated by mean densities for firn and ice. This method allows conclusions for the whole glacier only, because elevation changes in the glacier surface are regulated not only by accumulation and ablation, but also by ice movement (Reference HoinkesHoinkes, 1970). The accuracy of the method is mainly determined by the scale and quality of the photographs, surface conditions on the glacier and the quality of the geodetic network (Reference Østrem and BrugmanØstrem and Haakensen, 1999). Some inaccuracies arise from map compilation, paper shrinkage and drafting (Reference HaakensenHaakensen, 1986). Wrong densities for converting ice volume to water equivalent are another source of error, aside from geodetic measurements and map processing. The resulting maximum error can be fairly well determined mathematically. Moreover, the accuracy of the maps can easily be checked by comparing the contour lines of the surrounding rock areas, which are assumed to be stable.
The Tuyuksu region was mapped at a 1:10000 scale by a German–Soviet expedition in 1958 (Reference Simon, T¨ppler and PillewizerSimon and others, 1961). The Commission for Glaciology (KfG) of the Bavarian Academy of Sciences has recently initiated a new survey of the region in cooperation with the Academy of Sciences of the Republic of Kazakhstan, and the Institute for Photo-grammetry and Cartography, Technical University of Munich (TUM-IPK). The field campaign was carried out in 1998, and the mapping was based on the same coordinate system as 40 years before. This was possible because five ground-control points from 1958 were identified and served as fixed points for coordinate transformations (Reference Eder, Geiß, Rentsch, Kokarev, Uvarov, Haeberli, Zemp, Frauenfelder, Hoelzle and Ka¨a¨bEder and others, in press). The use of the same USSR coordinate system is an important precondition for precisely calculating changes in mass, volume and area (Reference Eder, Geiß, Hornik, Rentsch and TremelEder and others, 2002). The accuracy of the 1998 map benefits from the absence of fresh snow during the survey. The absolute error in elevation measurement of a single point is not more than 1m (personal communication from H. Reference Eder, Geiß, Rentsch, Kokarev, Uvarov, Haeberli, Zemp, Frauenfelder, Hoelzle and Ka¨a¨bRentsch, 2003) and is randomly distributed.
From the two maps, regular digital elevation models (DEMs) with a 20m grid size were generated at the Institute for Photogrammetry and Cartography to calculate the volume difference between 1958 and 1998. To determine the water equivalent, mean densities for firn (650kgm–3) and ice (900kg m–3) were assumed, taking into account the mean equilibrium-line altitude (ELA) of the individual glaciers. For entire glaciers, these mean densities for conversion into water equivalent range between 830kgm–3 (Kosmodemjanskaya) and 900kg m–3 (Ordshonikidse). This method differs from other investigations (Reference HaakensenHaakensen, 1986; Reference AndreassenAndreassen, 1999; Reference KrimmelKrimmel, 1999), which generally assume a mean density for the whole glacier of 900 kg m–3. The differentiation between firn and ice densities should deliver better results because the volume changes take place at the glacier surface where this distinction actually exists, and they are accounted for by the glaciological method. A disadvantage arises from the fact that if the ELA is derived by direct measurement, this approach becomes, to some degree, a combination of the geodetic and glaciological methods (Reference KrimmelKrimmel, 1999). The water equivalents were calculated with reference to the mean of the 1958 and 1998 glacier area.
Hydrological method
The hydrological method calculates glacier mass balance as a storage term in the water balance. Subtraction of runoff and evapotranspiration from precipitation delivers the glacier mass budget for the whole catchment area. Large relative errors can arise from the fact that the result is calculated from the difference in large numbers. In particular, basin precipitation is highly inaccurate due to the well-known errors in point measurements (Reference SevrukSevruk, 1982) and the extrapolation to the whole basin. Gauging stations near glaciers are rare, and due to high inaccuracies this method is very seldom applied; the World Glacier Monitoring Service published mass-balance data derived by the hydrological method for only one glacier, Aletschgletscher, Switzerland.
In the Tuyuksu region, the terms of the water balance were calculated using the conceptual runoff model HBV-ETH, which was developed from the HBV model (Berg-stro¨m, 1976) for glacierized catchments (Reference Braun and RennerBraun and Renner, 1992). The HBV-ETH model needs daily means of temperature and precipitation as input, and works on a daily timestep. Precipitation for different elevation zones is calculated by a precipitation gradient which is derived by calibration and checked against measurements. Moreover, the point measurement is corrected with factors for snow and rain to accommodate measurement errors and the representativeness of the meteorological station. The aggregational state of precipitation is determined for each elevation zone with a threshold temperature. Lapse rates, precipitation correction factors and all other free parameters are calibrated by comparing simulated with measured runoff (Reference Hagg, Braun, De Jong, Collins and RanziHagg and Braun, 2005). Actual evapotranspiration is determined from the potential evapotranspiration, which is dependent on soil moisture storage and which is assumed to vary sinusoidally throughout the year, with a maximum in summer. The snow and glacier routine of the HBV-ETH model works with elevation and exposition classes and therefore delivers, unlike the classical hydrological method, not only the mass balance for the whole catchment, but a spatially differentiated picture (Reference HaggHagg, 2003). Melting of snow and ice is calculated with a temperature-index approach using a seasonally variable degree-day factor with a calibrated maximum and minimum at the summer and winter solstice, respectively. Stronger melt rates of ice compared to snow are considered by a multiplicative factor. The model also accounts for the influence of slope aspect by multiplying melt on south-facing slopes by a factor and dividing it on north-facing slopes by the same factor.
Results and Discussion
Comparison of glaciological and hydrological method
The HBV-ETH model was calibrated with measured runoff data, which were available for 4 years only. With this parameter set, based on an optimal agreement between measured and calculated runoff, the whole time period between the two maps was simulated. The time segment with measured runoff seemed to be too short to subdivide it into a calibration and a validation period, because particular weather conditions would have an overwhelming influence on parameter optimization. Fortunately, the climatic conditions of this short calibration period can be regarded as representative for the whole time period, as summer and annual temperatures and precipitation sums are almost identical to the long-term means. Figure 4 shows the relationship between simulated values and direct measurements. Because of a reduction in financial means since the collapse of the Soviet Union, central Tuyuksu is the only glacier for which mass balance has been determined since 1990. The quality of these data is questionable due to reduced measurement efforts. Data from these uncertain years were excluded from this analysis.

Fig. 4. Scattergram of specific glacier mass balances derived by the hydrological method and by direct measurements of the years 1958/59 to 1989/90 for the catchment of ‘Tourist Camp Tuyuksu’.
The sum of the hydrological method (-4513 mm) differs greatly from that of direct measurements (-3077 mm). If the parameters of the HBV-ETH model are changed such that the sum is almost equal to the glaciological method (-3072 mm), the agreement of the annual glacier mass-balance values of the two methods increases (R 2 = 0.63), while the agreement of measured and modelled daily runoff slightly decreases (Nash-Sutcliffe criterion drops from R 2 = 0.81 to R 2 = 0.77). Note that the above-mentioned sums are related to the catchment area and exclude the years from 1990/91 to 1997/98. Therefore, these values differ from those in Figures 3 and 5.

Fig. 5. Specific mass-balance curves for the catchment of the gauging station ‘Tourist Camp Tuyuksu’, derived by the hydrological and glaciological method, before and after the adjustment to the geodetic method.
Verification using the geodetic method
At TUM-IPK, the areal difference across all glaciers in the study area between 1958 and 1998 was calculated to be -20%. Changes for the individual glaciers are shown in Table 1.
Table 1. Changes in area and volume of glaciers in the Tuyuksu region, determined by map comparison (1958–98)
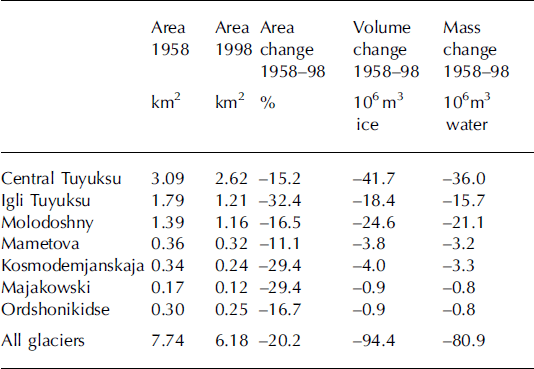
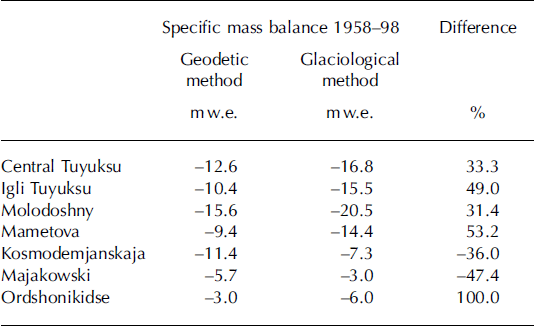
The volume change is equal to 94.4 × 10⁶m3, which is, according to the method described above, equivalent to 80.9×10⁶m3 of water. Table 2 shows specific mass balances for all glaciers in the basin as determined by the geodetic and the glaciological method. For this purpose, the earlier excluded direct measurements on central Tuyuksu during the uncertain 1990s (Fig. 4) must also be considered.
Table 2. Comparison of mass balances determined by the geodetic and the glaciological method on different glaciers
The data gap for the subsidiary glaciers in the same period was closed by correlations from central Tuyuksu, benefiting from the parallel glacier behaviour in the basin.
For the three larger glaciers (ϡ km2), the values obtained by the glaciological method are on average almost 40% higher than those of the photogrammetric method, and the small glaciers show a wide range of deviations in both directions. In Table 3, the results for central Tuyuksu, where direct measurements were carried out most accurately, are compared with differences between the mass-balance methods from other glaciers reported in the literature.
Table 3. Comparison of geodetic and glaciological mass-balance measurements on different glaciers
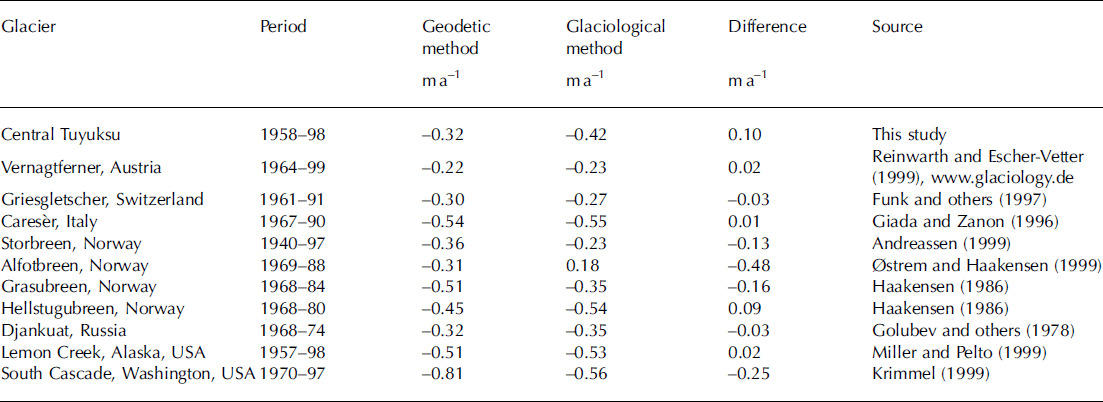
Good agreement of the two methods can only be claimed in a few cases (Vernagtferner, Austria; Griesgletscher, Switzerland; Carese`r, Italy; Djankuat, Russia; Lemon Creek, Alaska, USA); the others show a smaller or larger discrepancy, which is magnified if multiplied by the number of years or if the relative error is calculated. At central Tuyuksu, the annual difference of 0.1m lies within the scope of the other glaciers, which ranges from 0.01 to 0.25 m. Only Alfotbreen, Norway, is an exception, with a deviation of almost 0.5 ma–1 and different signs for the two methods. Here, the large discrepancy is explained by inaccuracies in direct measurements due to sinking stakes and probing errors in deep snow (Reference Østrem and BrugmanØstrem and Haakensen, 1999). Table 3 shows that deviations between the two methods can go in either direction. Analysis on Storbreen, Norway (Reference AndreassenAndreassen, 1999), and South Cascade Glacier, Washington, USA (Reference KrimmelKrimmel, 1999), has shown that even on the same glacier, the glaciological method can deliver more negative values than the geodetic method for one period, and more positive values for another. Larger discrepancies are explained by inaccuracies in the maps used (Reference AndreassenAndreassen, 1999), measurement difficulties due to superimposed ice (Reference HaakensenHaakensen, 1986), or systematic errors in the glaciological method (Reference KrimmelKrimmel, 1999). At central Tuyuksu, the difference is greater than the expected maximum error (6cm) of the direct measurements. Most of this deviation can be attributed to imperfections in the glaciological method, as the maps show a very high degree of accuracy in the non-changing bedrock surroundings.
The photogrammetric method was also used to verify the results of the HBV-ETH model. The sum of the simulated mass balances relative to the catchment area (–5247 mm) showed a larger difference from the geodetic results (–2793 mm) than the glaciological method (–4055 mm).
The HBV-ETH model cannot properly simulate glacier mass balance. This means that the hydrological method fails, most likely because of the insufficient quality and the short period (4 years) of runoff measurement (Reference HaggHagg, 2003). On the other hand, the geodetic volume balance displays an additional opportunity to calibrate the runoff model. For this purpose, the threshold temperature which distinguishes between snow and rain, and above which melt is assumed, was shifted from –0.68C to 08C, corresponding to a general temperature change. Figure 5 illustrates the cumulated mass balances derived by the hydrological method, before and after calibration with the geodetic method. In addition, the annual net balances from the glaciological method were linearly adjusted to the geodetic results (Fig. 5).
The uncalibrated curves are clearly too negative; in particular, the values calculated by the runoff-calibrated HBV-ETH model are clearly below the volume difference in the two maps. After the calibration, the curves are in good agreement during the first half of the period. When stronger mass losses begin to occur, the glaciological method delivers a more negative curve, which approaches the hydrological curve again in the 1990s. However, a parallelism in the two curves can be observed. There is a problem with data quality in the 1990s, due to a reduction in financial means since the collapse of the Soviet Union. Moreover, the meteorological input data of the HBV-ETH model have been delivered by a different station since 1992/93, introducing an additional discontinuity in the data series. From 1993/94 onwards, a steeper decline in the glaciologically measured values can be observed. The divergence of the two curves in the last 5 years leads to their discrepancy in the 1980s and early 1990s after the adjustment to the geodetic method. Despite this, the calibrated curves deliver a band in which more realistic values than the uncalibrated curves can be expected.
Conclusion
Accurate glacier maps are valuable for verifying other methods of mass-balance determination. Their greatest advantage is that their error can be fairly well estimated and they usually cover a relatively long time period. If the glaciological method implies a systematic error in one direction, this error becomes more obvious in cumulative mass-balance curves. Therefore, the geodetic method is the best for detecting long-term changes, but cannot replace traditional measurements, where annual, seasonal and spatial patterns can be observed. The hydrological method is only appropriate if very accurate precipitation and runoff data are available. However, it should be applied where possible. If the accuracy of one method is difficult to estimate, it can be helpful to use several approaches to try to improve them all by careful comparisons.
Acknowledgements
The processing of the 1998 map and the calculation of volume changes were the basis for this paper. The authors thank K. Eder, H. Rentsch, R. Wu¨rla¨nder and T. Gei, ß from TUM-IPK. I. Severskiy provided essential data for the application of the runoff model, and S. Clarke polished the English. The comments of R. Braithwaite, an anonymous referee and scientific editor H. Rott are gratefully acknowledged.


