


1. Introduction
The Greenland Ice Sheet (GrIS) has lost mass to the ocean at an increasing rate over recent decades (Rignot and others, Reference Rignot, Box, Burgess and Hanna2008, Reference Rignot, Velicogna, van den Broeke, Monaghan and Lenaerts2011; Shepherd and others, Reference Shepherd2012, Reference Shepherd2020; Enderlin and others, Reference Enderlin2014; King and others, Reference King2018; Mouginot and others, Reference Mouginot2019), and now has the largest contribution to global sea-level rise of any individual ice body (Vaughan and others, Reference Vaughan and Stocker2013; Bamber and others, Reference Bamber, Westaway, Marzeion and Wouters2018). Estimates indicate that ~48–66% of this mass loss can be attributed to glacier dynamics, with this dynamic loss driven by the acceleration and retreat of marine-terminating glaciers and increasing by 14% between 1985–1999 and 2007–2018 (King and others, Reference King2020), and the remaining ~34–52% due to surface mass balance (SMB) (Mouginot and others, Reference Mouginot2019; Shepherd and others, Reference Shepherd2020). Following a step-increase in ice discharge in the early-2000s, the GrIS is suggested to have entered a state of persistent mass loss (King and others, Reference King2020), and recent model intercomparison work projects a future sea-level rise contribution of 32 ± 17 to 90 ± 50 mm by 2100 (Goelzer and others, Reference Goelzer2020). Almost all of our current observations of long-term change are concentrated at the margins of the ice sheet, which have been characterised by thinning (Pritchard and others, Reference Pritchard, Arthern, Vaughan and Edwards2009; McMillan and others, Reference McMillan2016; Sørensen and others, Reference Sørensen2018) and both substantial velocity accelerations (Rignot and Kanagaratnam, Reference Rignot and Kanagaratnam2006; Joughin and others, Reference Joughin, Smith, Howat, Scambos and Moon2010, Reference Joughin, Smith and Howat2018; Moon and others, Reference Moon, Joughin, Smith and Howat2012) and near-ubiquitous retreat of marine-terminating outlet glaciers (Murray and others, Reference Murray2015; Bunce and others, Reference Bunce, Carr, Nienow, Ross and Killick2018), especially in the northwest and southeast.
In contrast, our understanding of changes in the dynamics of inland regions of the ice sheet is far more limited, and yet any such changes would be important for several reasons. At land-terminating margins, while the impacts of variable hydrological forcing on ice flow have been well-studied near the ice margin (van de Wal and others, Reference van de Wal2008, Reference van de Wal2015; Bartholomew and others, Reference Bartholomew2010; Sole and others, Reference Sole2013; Tedstone and others, Reference Tedstone2015), it remains unclear whether meltwater can access the bed, and efficient subglacial channels form, further into the ice-sheet interior where the ice is thicker and rates of surface melting are lower (Nienow and others, Reference Nienow, Sole, Slater and Cowton2017). This is particularly important given that as the ELA rises in response to projected increases in surface melt (Hanna and others, Reference Hanna2008), the area of the ice-sheet surface undergoing melt will increase exponentially due to the hypsometry of the ice-sheet surface (Bartholomew and others, Reference Bartholomew2011; Machguth and others, Reference Machguth2016). Furthermore, some studies have postulated that ice motion will scale positively with surface melting at high elevations (Doyle and others, Reference Doyle2014; Gagliardini and Werder, Reference Gagliardini and Werder2018), and others that the presence of liquid water within the englacial hydrological system may increase ice deformation rates over time scales of years to decades (Phillips and others, Reference Phillips, Rajaram and Steffen2010, Reference Phillips, Rajaram, Colgan, Steffen and Abdalati2013). More generally, considering conservation of mass, the thickness of ice in the interior is considerably greater than that at the margin, and so any increase in ice motion has the potential to result in a much larger increase in mass flux when compared to marginal regions (Doyle and others, Reference Doyle2014), particularly for marine-terminating margins which are characterised by faster flow velocities and can discharge any increase in mass flux directly into the ocean. As a consequence, future sea-level change projections are strongly dependent on how quickly mass can be transported from the ice-sheet interior to the margin (Price and others, Reference Price, Payne, Catania and Neumann2008, Reference Price, Payne, Howat and Smith2011; Felikson and others, Reference Felikson2017, Reference Felikson, Catania, Bartholomaus, Morlighem and Noël2020), as well as the time required for the ice sheet to reach a new steady-state following a perturbation. For example, modelling work indicates that ~75% of the projected sea-level rise from Greenland, which would result from the response of the ice sheet to forcing over the past few decades, is yet to come (Price and others, Reference Price, Payne, Howat and Smith2011). Furthermore, additional estimates suggest thinning may continue for hundreds (Wang and others, Reference Wang, Li and Zwally2012) to thousands (Price and others, Reference Price, Payne, Catania and Neumann2008) of years until a new steady-state is reached.
Several mechanisms have been proposed to drive a change in the ice dynamics within regions inland of Greenland's tidewater glacier termini. Changes to the surface slope and thickness of the ice, as a result of ice dynamical and/or SMB change, impact upon the driving stress, in turn affecting the rates of ice flow through internal deformation of the ice (Cuffey and Paterson, Reference Cuffey and Paterson2010). Such a change in driving stress, and thus internal deformation, can be driven through the up-glacier propagation of changes at the terminus of tidewater glaciers (i.e. Howat and others, Reference Howat, Joughin, Fahnestock, Smith and Scambos2008; Price and others, Reference Price, Payne, Catania and Neumann2008, Reference Price, Payne, Howat and Smith2011; Nick and others, Reference Nick, Vieli, Howat and Joughin2009; Felikson and others, Reference Felikson2017, Reference Felikson, Catania, Bartholomaus, Morlighem and Noël2020); for example, the loss of back-stress as a result of the loss of a floating ice tongue, or an increase in strain rate as the terminus retreats into deeper water (Price and others, Reference Price, Payne, Howat and Smith2011). This perturbs the force-balance, and the resultant acceleration leads to thinning of nearby upstream ice, steepening the local glacier surface thereby increasing the driving stress, resulting in further acceleration causing thinning and acceleration to propagate upstream (Nick and others, Reference Nick, Vieli, Howat and Joughin2009). The propagation of this thinning can be modelled as a diffusive kinematic wave (Nye, Reference Nye1960, Reference Nye1963; Nick and others, Reference Nick, Vieli, Howat and Joughin2009; Price and others, Reference Price, Payne, Howat and Smith2011; Felikson and others, Reference Felikson2017, Reference Felikson, Catania, Bartholomaus, Morlighem and Noël2020). This process can initiate a dramatic change in inland velocities, as observed during large ‘surging’ events at some Arctic ice caps (i.e. McMillan and others, Reference McMillan2014; Willis and others, Reference Willis2018; Zheng and others, Reference Zheng, Pritchard, Willis and Stearns2019).
Recent work (Felikson and others, Reference Felikson2017, Reference Felikson, Catania, Bartholomaus, Morlighem and Noël2020) suggests there may be geometrical constraints on the ability for thinning (and thus velocity) perturbations to propagate inland. These studies calculate the Péclet number (Pe), which describes the ratio of the rate at which a kinematic wave diffuses upstream or advects downstream. A threshold value of Pe = 3 is argued to represent the location at which 89% of dynamic change has occurred (Felikson and others, Reference Felikson, Catania, Bartholomaus, Morlighem and Noël2020), thus offering a possible empirical threshold by which to measure the ability of changes at the margin to propagate inland. Through applying this to 141 tidewater glaciers across the GrIS, Felikson and others (Reference Felikson, Catania, Bartholomaus, Morlighem and Noël2020) suggest two end-member geometries describe those glaciers with the greatest potential for dynamic mass loss; those with a relatively low mass flux but with basal topography permitting thinning to diffuse far inland (i.e. northwest Greenland), and those with high mass flux but with thinning limits close to the margin (i.e. southeast Greenland).
In spite of the wealth of studies, there is little observational data to constrain these theoretical and model results, especially at higher elevations further inland. Direct observations of velocity change inland of fast-flowing marine-terminating outlet glaciers are limited to sparse GPS measurements of seasonal flow variations at a few individual glaciers (Sole and others, Reference Sole2011; Ahlstrøm and others, Reference Ahlstrøm2013), and a single long-term (multi-decadal) study observing changes in ice motion extending ~80–100 km from the grounding line at Zachariae Isstrøm in northeast Greenland (Mouginot and others, Reference Mouginot2015). Recent measurements of mass change from ICESat and ICESat-2 show thinning extending inland to elevations of 2000–2500 m (a.s.l.) in western and southern Greenland, particularly inland of Jakobshavn Isbrae and tidewater glaciers in the northwest, and to 1500 m (a.s.l.) in northeast Greenland (Smith and others, Reference Smith2020), although thinning is the result of both dynamic change and changes in SMB. To disentangle the relative contribution of dynamic and SMB, thereby isolating the dynamic signal of mass loss, surface elevation change (SEC) can be corrected with SMB fields derived from regional climate models (Pritchard and others, Reference Pritchard, Arthern, Vaughan and Edwards2009; Zwally and others, Reference Zwally2011; McMillan and others, Reference McMillan2016; Felikson and others, Reference Felikson2017). The majority of pronounced dynamic thinning is found in a relatively narrow set of regions; Jakobshavn Isbrae, Upernavik Isstrøm and Steenstrup Glacier on the west coast, Kangerlussuaq in the southeast, and Zachariae Isstrøm in the northeast (McMillan and others, Reference McMillan2016). While dynamic thinning has been observed to penetrate inland of fast-flowing outlet glaciers (Pritchard and others, Reference Pritchard, Arthern, Vaughan and Edwards2009; Zwally and others, Reference Zwally2011; McMillan and others, Reference McMillan2016), the amplitude of thinning from a small perturbation in ice velocity is expected to be well below the combined uncertainty of altimetry and SMB models and so the inland limit of dynamic thinning comes with large uncertainty. Consequently, there is a need for additional robust measurements of dynamics, and thus potentially dynamic change, within the accumulation zone of the GrIS in order to quantify how the interior of the GrIS has responded to climate warming and associated ice marginal dynamic perturbations.
During the period 1993–1997, a line of 161 stakes located ~30 km apart was installed in a ‘girdle’ around the entire GrIS at ~2000 m elevation as part of the NASA-led Program for Arctic Regional Climate Assessment (PARCA) project, in order to estimate the mass balance of the ice-sheet interior (Thomas and others, Reference Thomas, Csatho, Gogineni, Jezek and Kuivinen1998, Reference Thomas2000, Reference Thomas2001). At each stake, annual ice velocity was calculated using GPS observations recorded over a 1-year return period sometime between 1993 and 1997. This period was characterised by stable mass balance (Sørensen and others, Reference Sørensen2018) and preceded both the recent rapid acceleration in ice motion observed at many of Greenland's marine-terminating outlet glaciers (Thomas and others, Reference Thomas2003; Joughin and others, Reference Joughin, Abdalati and Fahnestock2004; Luckman and others, Reference Luckman, Murray, de Lange and Hanna2006; Holland and others, Reference Holland, Thomas, de Young, Ribergaard and Lyberth2008; Murray and others, Reference Murray2010; Bevan and others, Reference Bevan, Luckman and Murray2012; Hill and others, Reference Hill, Carr, Stokes and Gudmundsson2018), and the slowdown in the southwest land-terminating sector (Tedstone and others, Reference Tedstone2015; van de Wal and others, Reference van de Wal2015; Stevens and others, Reference Stevens2016; Williams and others, Reference Williams, Gourmelen and Nienow2020), which both began in the late-1990s to early-2000s. While inland velocity measurements have previously been limited to GPS data, the launch of Landsat-8 in 2013, among other advances in satellite imaging, has led to the extension of large-scale feature tracking into the ice-sheet interior (Fahnestock and others, Reference Fahnestock2016; Gardner and others, Reference Gardner2018, Reference Gardner, Fahnestock and Scambos2019). Since 2013, some marine-terminating glaciers have continued to accelerate while others have stabilised or slowed down (Joughin and others, Reference Joughin, Smith and Howat2018, Reference Joughin, Shean, Smith and Floricoiu2020; Lemos and others, Reference Lemos2018; Khazendar and others, Reference Khazendar2019; Mankoff and others, Reference Mankoff2020). Few, however, have remained stable since the 1990s or returned to speeds comparable to those prior to the initial acceleration (Bevan and others, Reference Bevan, Luckman and Murray2012; Joughin and others, Reference Joughin, Smith and Howat2018).
Here, we compare recent satellite-image-derived velocities in the ice-sheet interior to those collected at the PARCA GPS stakes along the 2000 m elevation contour in the mid-1990s to quantify how the interior of the GrIS has responded to the period of dramatic change observed at marine-terminating margins of the GrIS during the 2000s and 2010s. We measure multi-decadal ice velocity change at 45 sites inland of tidewater margins, encompassing all regions of the ice sheet. Subsequently, we assess the observed pattern of change with respect to the patterns of velocity change at the margins, ice geometrical constraints and modelled SMB from MAR v3.10 (Fettweis and others, Reference Fettweis2017).
2. Data and methods
2.1 PARCA ice velocities around the 2000 m traverse
The PARCA dataset consists of GPS receivers at 161 stakes, located ~30 km apart and spanning the entire 2000 m elevation contour of the GrIS, except for the southwest where the stakes were placed at higher elevations to avoid nunataks, mountains and crevasses (Thomas and others, Reference Thomas, Csatho, Gogineni, Jezek and Kuivinen1998, Reference Thomas2000). At each GPS station, an annual ice velocity (m a−1) was recorded within the period 1993–1997, as well as surface elevation (m a.s.l.) and ice thickness (m), the latter of which was measured by ice-penetrating radar. The precision of annual velocity measurements from these GPS sites is <0.5 m a−1, and better than 0.2 m a−1 in most cases (Thomas and others, Reference Thomas, Csatho, Gogineni, Jezek and Kuivinen1998). We apply a conservative uncertainty of ±0.5 m a−1 at all sites.
It should be noted that while the GPS sites are located at approximately the same surface elevation, there are considerable differences in the distance from their respective glacier termini (Fig. S6), with a notable increase in distance inland in the north and northeast.
2.2 NASA MEaSUREs ITS-LIVE ice velocities
Recent advances in satellite imaging have enabled the routine mapping of ice velocities (Dehecq and others, Reference Dehecq, Gourmelen and Trouvé2015; Fahnestock and others, Reference Fahnestock2016), with enhanced coverage in the interiors of the ice sheets (Gardner and others, Reference Gardner2018). Here, we use the NASA MEaSUREs ITS-LIVE annual velocity mosaics (v0) of the GrIS, generated from Landsat imagery through the auto-RIFT feature tracking processing chain (Gardner and others, Reference Gardner2018), covering the period 1985–2018 and gridded to 240 m (Gardner and others, Reference Gardner, Fahnestock and Scambos2019). Full documentation of this dataset is available from https://its-live.jpl.nasa.gov/#documentation. We use this dataset as the ice velocity measurements extend to the 2000 m elevation contour and both effective pair length (dt) and centre date are provided at each pixel such that we can assess the impact of any seasonality introduced in our analyses. Moreover, a recent assessment of satellite-image-derived ice velocities within the Greenland interior shows that when compared to GPS velocities from 2015 to 2019, located ~150 km from the ice divide in the Northeast Greenland Ice Stream (NEGIS; 75°38N, 35°60W), ITS-LIVE velocities from 2013 to 2018 are characterised by the lowest bias (0.31 m) of all velocity products assessed (Hvidberg and others, Reference Hvidberg2020). For the calculation of multi-decadal ice velocity change, we use the data spanning 2014–2018, produced from Landsat-8 imagery. While Landsat-8 imagery was used to compute the 2013 velocity field, it was used in conjunction with Landsat-7 imagery, and so the uncertainties are much higher than for 2014–2018 given the lower radiometric resolution of Landsat-7 compared to Landsat-8. Given the slow ice speeds within the interior, any such uncertainty can make up a considerable part of the observed change, hence we do not include data earlier than 2014 in our analyses.
2.3 ITS-LIVE velocity extraction at PARCA GPS sites
Prior to velocity extraction, we exclude pixels with a velocity below 10 m a−1, reasoning that the associated uncertainties constitute an unacceptably high percentage at very low velocities. Following this thresholding, we extract ice velocity (m a−1), ice velocity uncertainty (m a−1), effective pair length (days) and effective centre date from a 3 × 3-pixel (720 × 720 m) window around each of the 161 PARCA GPS sites, taking the median value of each from the extracted window. We repeat this for each year in the period 2014–2018, and then calculate the median velocity and uncertainty across the 2014–2018 period (calculated from whichever years we have data at a given GPS site) to account for any year-to-year variability in ice velocity.
Seasonal variability in ice velocities has been observed near the margins of tidewater glaciers in Greenland (Lemos and others, Reference Lemos2018), as well as up to at least ~70 km inland at Kangiata Nunaata Sermia in southwest Greenland (Sole and others, Reference Sole2011) and at an elevation of 1850 m (a.s.l.), 140 km inland in the southwest land-terminating sector (Doyle and others, Reference Doyle2014). We calculate the potential impact of such seasonality on the satellite-image-derived velocity data at the PARCA GPS sites, as described in Supplementary Text 1, and observe no coherent pattern showing any clear evidence of seasonality in the velocity data at these elevations.
2.4 Calculating velocity change
For each GPS site, we use the 2014–2018 median ITS-LIVE velocity to calculate a decadal velocity change through the following:


It should be noted that for inland regions where the ice is flowing much more slowly than at the margins, any uncertainties in the ice velocity measurements may equal a considerable proportion of any measured velocity change. Following this, we first remove any sites where the measured velocity change (m a−1) is less than or equal to the 2014–2018 median velocity uncertainty (m a−1) extracted from the ITS-LIVE data added to the 0.5 m uncertainty of the GPS measurements (Thomas and others, Reference Thomas, Csatho, Gogineni, Jezek and Kuivinen1998). To assess temporal variability, at each GPS site, we calculate the std dev. of the annual velocity for the period 2014–2018. We remove any GPS sites where our measured velocity change (2014–2018 median) is less than or equal to the std dev. at that site. The locations of these sites are shown in Figure S7. Following this filtering, we measure decadal velocity change at 45 GPS sites.
At these 45 sites, ITS-LIVE velocity uncertainties range from 0.1 to 11.5 m a−1, with a mean uncertainty of 1.8 m a−1, for the years 2014–2018 (Fig. S8). At the majority of the GPS sites included in our analyses, both median ice velocity uncertainty (m a−1) and the ice velocity std dev. (m a−1) across the 2014–2018 ITS-LIVE data are very low, often <1–2 m a−1 (Fig. S8). In addition, almost all of the GPS sites have ITS-LIVE data in all 5 years (2014–2018, Fig. S8D), such that the median velocity and velocity uncertainty are representative of the entire period, thereby limiting any temporal bias.
We observe absolute magnitudes of change ranging from −9.4 ± 3.3 to +28.1 ± 8.3 m a−1 (Fig. 1a), and also report these as percentage changes (Fig. 1b). Where there are multiple GPS sites inland of a glacier, we report the range of velocity change values observed across these sites, and we also report the combined ITS-LIVE and GPS uncertainties.

Fig. 1. Ice velocity change (a: m a−1, b: %) at 45 GPS sites inland of tidewater margins between the periods 1993–1997 and 2014–2018. The base image is the 2016 velocity field from the NASA MEaSUREs ITS-LIVE v0 product (Gardner and others, Reference Gardner2018, Reference Gardner, Fahnestock and Scambos2019).
2.5 Velocity time series creation
To compare acceleration in the interior with changes in ice motion at the margins, we create time series of ice velocity at the ice-sheet margin using the full ITS-LIVE dataset from 1985 to 2018 (Gardner and others, Reference Gardner2018, Reference Gardner, Fahnestock and Scambos2019). For each glacier studied, we define an area of interest (AOI) near the terminus. Within this AOI, we then remove pixels that are flowing slower than a specified minimum velocity, as well as pixels with an uncertainty greater than a specified threshold value, for each year of ITS-LIVE data. These velocity and uncertainty thresholds differ between sites, with full input parameters given in Table S1. We then calculate the pixels common to all years of ITS-LIVE data within the AOI, such that there is no spatial bias influencing the time series. These pixels are shown for each site in Figures S9–S25.
At fast-flowing outlet glaciers, the pair lengths used to compute velocity are often smaller than those further inland where greater temporal separation is necessary to measure displacement given the slower flow speeds. Seasonal velocity variability has been observed at several of Greenland's tidewater glaciers from both GPS measurements (Sole and others, Reference Sole2011) and satellite remote sensing (Lemos and others, Reference Lemos2018), and may impact upon the extracted velocities and thus time series. As such, we calculate the percentage of summer (JJA) coverage at each common pixel for each year using the centre-date and effective pair length, as described in Supplementary Text 1. We then calculate the median summer coverage across all common pixels for each year of data, and colour-code the scatter points in Figures 2–4 by these values.
2.6 Surface mass balance
Changes in ice motion can be driven by changes in SMB, for example, through meltwater input to the bed (Tedstone and others, Reference Tedstone2015), cryo-hydrologic warming (Phillips and others, Reference Phillips, Rajaram and Steffen2010, Reference Phillips, Rajaram, Colgan, Steffen and Abdalati2013) or simply the impact on local driving stress through ice thinning and surface slope change (Tedstone and others, Reference Tedstone2015). We obtain SMB data from the MAR v3.10 regional climate model (Fettweis and others, Reference Fettweis2017), forced by NCEP-NCARv1 from 1992 to 2019. Modelled melt production and SMB are extracted from a 3-by-3-pixel window around each GPS station, for the years 1990–1999 and 2014–2018. Mean values are calculated for each of these time periods, which are then differenced to calculate the change in modelled melt production and SMB between the GPS and satellite velocity measurement periods.
3. Results
3.1 Multi-decadal velocity change around the 2000 m traverse
We observe a near-ubiquitous acceleration inland of marine-terminating glaciers on the west coast (Fig. 1). Across four GPS sites ~117 km inland of the terminus of Jakobshavn Isbrae, the largest and fastest flowing outlet glacier of the GrIS (Joughin and others, Reference Joughin, Abdalati and Fahnestock2004, Reference Joughin, Shean, Smith and Floricoiu2020; Holland and others, Reference Holland, Thomas, de Young, Ribergaard and Lyberth2008; Khazendar and others, Reference Khazendar2019), we observe an acceleration ranging from 7.6 ± 4.2 to 28.1 ± 7.8 m a−1.
Similarly, we observe accelerations up-glacier from Narsap Sermia (3.6 ± 0.8 to 4.6 ± 1.6 m a−1) in the southwest, and inland of Rink Isbrae (7.8 ± 2.7 to 14.6 ± 7.5 m a−1), Upernavik Isstrøm (4.9 ± 1.9 to 6.3 ± 2.2 m a−1) and Kong Oscar Gletsjer (3.3 ± 1.0 to 3.7 ± 2.4 m a−1) in central to northwest Greenland. The only glacier where we observe inland deceleration on the west coast is Umiammakku Isbrae (−5.5 ± 2.8 m a−1).
North Greenland is characterised by very small changes in inland flow (−1.8 ± 0.7 to +2.1 ± 0.8 m a−1), with minor accelerations of 1.1 ± 0.4 m a−1 and 1.0 ± 0.3 to 2.1 ± 0.3 m a−1 inland of Petermann Gletsjer and Ryder Gletsjer, respectively. In contrast, the NEGIS (which drains into 79 North Glacier and Zachariae Isstrøm) has seen a slowdown of −1.3 ± 0.7 to −1.8 ± 0.6 m a−1. To the north of the NEGIS, Academy Gletsjer also shows inland deceleration (−1.3 ± 0.2 to −1.8 ± 0.2 m a−1).
In contrast to west Greenland, interior acceleration has been largely absent from the east coast. In central-east Greenland, the inland region draining into Daugaard-Jensen Gletsjer has decelerated by −1.3 ± 0.4 to −1.5 ± 0.3 m a−1. Further south, Kangerlussuaq has a more complex pattern, with a 1.7 ± 0.8 to 7.5 ± 2.2 m a−1 interior acceleration inland of two of its flow branches, and a −4.0 ± 1.9 m a−1 deceleration inland of the most southerly branch. In the southeast, we observe decelerations inland of Helheim Gletsjer (−4.1 ± 1.2 to −6.8 ± 1.3 m a−1) and Ikertivaq (−4.9 ± 2.0 to −9.4 ± 2.8 m a−1).
We next assess multi-decadal (1985–2018) time series of near-terminus ITS-LIVE ice velocity (Gardner and others, Reference Gardner2018, Reference Gardner, Fahnestock and Scambos2019) downstream of our inland velocity change measurements to investigate whether the observed inland velocity change may be driven by the up-glacier propagation of acceleration at the terminus.
3.2 Near-terminus velocity change
Numerous studies have measured multi-annual ice velocity change near the terminus of Greenland's tidewater glaciers (e.g. Rignot and Kanagaratnam, Reference Rignot and Kanagaratnam2006; Howat and others, Reference Howat, Joughin and Scambos2007, Reference Howat, Joughin, Fahnestock, Smith and Scambos2008; Joughin and others, Reference Joughin2008, Reference Joughin, Smith, Howat, Scambos and Moon2010, Reference Joughin, Smith and Howat2018; Murray and others, Reference Murray2010; Bevan and others, Reference Bevan, Luckman and Murray2012; Moon and others, Reference Moon, Joughin, Smith and Howat2012; Mouginot and others, Reference Mouginot2015). Through assessing ITS-LIVE ice velocity change (Gardner and others, Reference Gardner2018, Reference Gardner, Fahnestock and Scambos2019) from 1985 to 2018 at tidewater glacier margins (Fig. 2) alongside these studies, we observe that those sites where ice velocities were greater between 2014 and 2018 than during the 1990s have also undergone large and/or rapid perturbations downstream. Conversely, five of the six sites without inland acceleration also exhibit acceleration downstream (Fig. 3).

Fig. 2. Time series of ITS-LIVE ice velocity (m a−1) from 1985 to 2018 measured near the terminus (see Supplementary Figs S9–S15 for exact locations) for glaciers inland of which multi-decadal acceleration is observed; (NS) Narsap Sermia, (JI) Jakobshavn Isbrae, (RI) Rink Isbrae, (UI) Upernavik Isstrøm (Central), (KO) Kong Oscar Gletsjer, (PG) Petermann Gletsjer, (K) Kangerlussuaq. Scatter points are colour-coded in greyscale by the percentage of summer (JJA) days over which ice velocities were measured in that particular year (see Methods/Supplementary Information). At each site, only points common to every annual velocity field included in the time series were used for velocity extraction (see Supplementary Figs S9–S15). The dashed line displays the average velocity between 1990 and 1999, and the dotted line displays the average velocity between 2014 and 2018. Input parameters are given in Table S1.

Fig. 3. Time series of ITS-LIVE ice velocity (m a−1) from 1985 to 2018 measured near the terminus (see Supplementary Figs S17–S22 for exact locations) for glaciers inland of which no multi-decadal acceleration is observed; (UmI) Umiammakku Isbrae, (AG) Academy Gletsjer, (79N) 79 North Glacier, (ZI) Zachariae Isstrøm, (DJ) Daugaard-Jensen Gletsjer, (HG) Helheim Gletsjer. Scatter points are colour-coded in greyscale by the percentage of summer days over which ice velocities were measured for that particular year (see Methods/Supplementary Information). At each site, only the points common to every velocity field included in the time series were used for velocity extraction (see Supplementary Figs S16–S21). The dashed line displays the average velocity between 1990 and 1999, and the dotted line displays the average velocity between 2014 and 2018. Input parameters are given in Table S1.
Where multiple GPS sites are present upstream of an individual glacier terminus, inland change is largely consistent across these GPS sites (Fig. 1). At Kangerlussuaq however, the response is more complex. While the glacier terminus underwent a substantial acceleration between 2000 and 2006 (Rignot and Kanagaratnam, Reference Rignot and Kanagaratnam2006; Howat and others, Reference Howat, Joughin and Scambos2007, Reference Howat, Joughin, Fahnestock, Smith and Scambos2008; Bevan and others, Reference Bevan, Luckman and Murray2012; Moon and others, Reference Moon, Joughin, Smith and Howat2012; Khan and others, Reference Khan2014), flow diverges into four distinct branches inland (Fig. 4), with acceleration inland of the central flow branches (2 and 3) and deceleration inland of the most southerly branch (1) between 1993–1997 and 2014–2018. For the flow branches (2 and 3) where we observe inland acceleration (of 3.2 ± 1.0 to 6.5 ± 1.4 m a−1 and 1.7 ± 0.8 to 7.5 ± 2.2 m a−1 respectively, Fig. 1), we observe downstream speed-ups of ~ 100 m a−1 (~25%) and 75 m a−1 (~20%) between ~2000 and ~2008. A similar ~100 m a−1 acceleration is observed at the most easterly branch (4), although the GPS sites inland of this flow branch are filtered out of our analysis. For the most southerly flow branch (1), inland of which we observe a deceleration (−4.0 ± 1.9 m a−1, Fig. 1), we observe minimal downstream change, indicating that differences in downstream flow dynamics may explain the different inland responses of upstream tributaries at Kangerlussuaq.

Fig. 4. Time series of ITS-LIVE ice velocity (m a−1) from 1998 to 2018 measured at the four flow branches of Kangerlussuaq, with velocity extraction from pixels within the rectangle on each branch. Scatter points are colour-coded by the percentage of summer days over which ice velocities were measured for that particular year (see Methods/Supplementary Information). At each site, only the points common to every velocity field included in the time series were used for velocity extraction (see SI Figs S22–S25). Input parameters are given in Table S1.
3.3 Influence of ice geometry
While glaciers that show interior acceleration are characterised by downstream acceleration, several glaciers that have also experienced downstream speed-up exhibit no inland acceleration. Consequently, dynamical change at the margin alone is not necessarily indicative of interior acceleration. To assess whether downstream ice geometry can explain the inland heterogeneity in velocity change between 1993–1997 and 2014–2018, we compare the observed velocity change to basal topography and the extent of subglacial troughs (Fig. 5, Table 1). It is clear that for six out of the eight glaciers where we observe inland acceleration, the overdeepened subglacial trough extends further or at least a comparable distance inland to the PARCA GPS stations (Table 1). This is most evident at Jakobshavn Isbrae, where we observe inland acceleration at four GPS sites, all of which lie within an extensive region underlain by deep basal topography (Fig. 5). Conversely, for four of the seven glaciers where we observe inland deceleration, the GPS stations are largely located far beyond the maximum extent of any subglacial trough, indicating that subglacial topography (and thus ice geometry) may play an important role limiting the propagation distance of perturbations at the terminus for certain glaciers. This pattern, however, is not ubiquitous; for example, we do not observe inland acceleration at 79 North Glacier or Zachariae Isstrøm despite extensive subglacial troughs while conversely, we observe acceleration inland of Kangerlussuaq despite the GPS sites being located ~50 km further inland than the head of the respective subglacial trough.
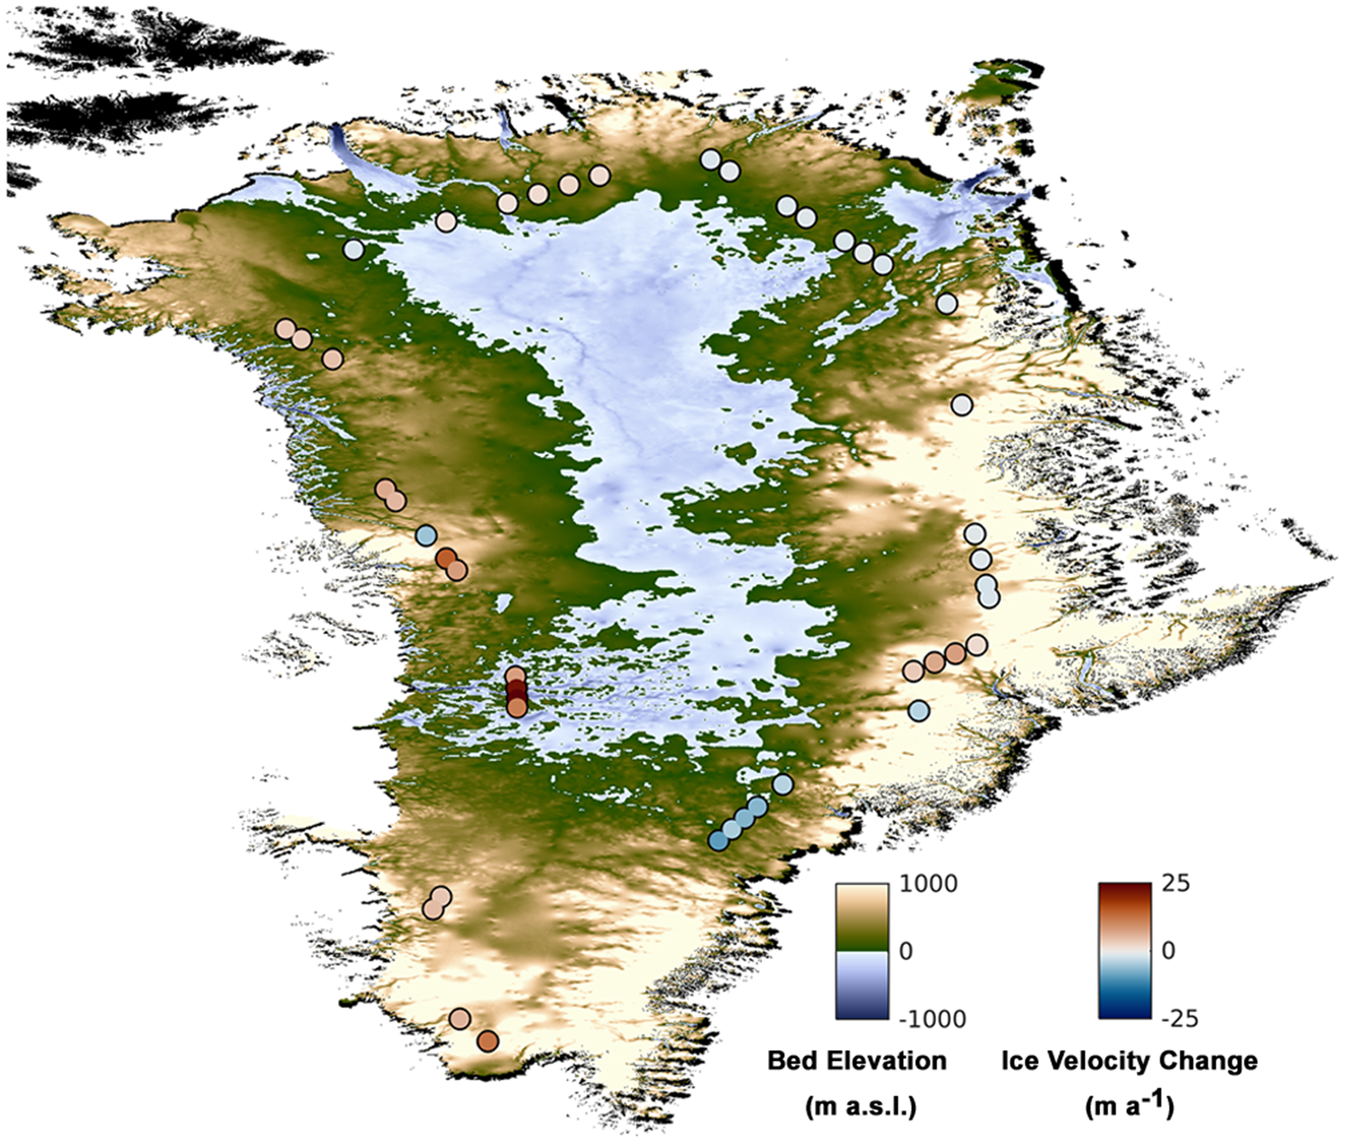
Fig. 5. Ice velocity change (m a−1) at 45 GPS sites inland of tidewater margins between the periods 1993–1997 and 2014–2018, compared to basal topography from BedMachineV3 (Morlighem and others, Reference Morlighem2017).
Table 1. Comparison of PARCA GPS distance inland and measured velocity change (m a−1) between 1993–1997 and 2014–2018 with the extent of subglacial troughs (Morlighem and others, Reference Morlighem, Rignot, Mouginot, Seroussi and Larour2014, Table S1) at 15 tidewater glaciers on the Greenland Ice Sheet

As neighbouring GPS sites may have differing distances from the margin, we compare the average distance of these sites inland of a particular glacier to the subglacial trough length at that glacier.
a Subglacial trough lengths were calculated by Morlighem and others (Reference Morlighem, Rignot, Mouginot, Seroussi and Larour2014, Table S1) using the longest flowline that connects the ice front to the interior of the ice sheet, and do not necessarily follow the glacier centreline.
b Daugaard-Jensen Gletsjer is stated to have a trough length of 70 km in the main manuscript, with a maximum trough length of 124 km given in Supplementary Information.
3.4 Influence of surface mass balance
Within the accumulation zone in southwest Greenland, increases in surface melt have been hypothesised to drive acceleration through hydro-dynamic coupling (Doyle and others, Reference Doyle2014) and/or cryo-hydrologic warming (Phillips and others, Reference Phillips, Rajaram and Steffen2010, Reference Phillips, Rajaram, Colgan, Steffen and Abdalati2013). Data from MAR v3.10 (Fettweis and others, Reference Fettweis2017) suggest ice-sheet-wide increases in modelled surface melt production within the interior (Figs 6a, b) between the periods 1990–1999 and 2014–2018. The largest increases (42–270 mm a−1) are observed in the west and southeast, whereas increases in the north and northeast are very small (0–45 mm a−1). All of the PARCA GPS sites are characterised by positive SMBs during both the 1990–1999 and 2014–2018 periods (Figs 6c, d), which range from ~90–200 mm a−1 in the north to more positive values of ~200–1900 and ~300–650 mm a−1 along the east and west coasts, respectively.

Fig. 6. (a) Modelled surface melt production change (mm a−1), (b) modelled surface melt production change (%), (c) mean modelled 1990–1999 SMB (mm a−1) and (d) mean modelled 2014–2018 SMB (mm a−1) at 45 GPS sites inland of tidewater margins. Modelled melt production change is calculated between the 1990–1999 and 2014–2018 means. The base image is the 2016 velocity field from the NASA MEaSUREs ITS-LIVE v0 product (Gardner and others, Reference Gardner2018, Reference Gardner, Fahnestock and Scambos2019). Modelled surface melt production and SMB data are from MAR v3.10 (Fettweis and others, Reference Fettweis2017).
4. Discussion
4.1. Mechanisms driving inland change
Our results reveal a complex pattern of inland velocity change over the ~20-year period between 1993–1997 and 2014–2018, for which there exist several possible driving mechanisms.
While we do observe increases in modelled surface melt production at all of the GPS sites, and decreases in modelled SMB at most (Fig. 6), we see no evidence that any of the sites have undergone a transition from the accumulation to the ablation zone during the study period. Although cryo-hydrologic warming may also occur in the wet snow zone of the lower accumulation zone (Phillips and others, Reference Phillips, Rajaram, Colgan, Steffen and Abdalati2013), all 45 sites remain well within the accumulation zone as evidenced by positive modelled SMBs during 2014–2018 (all >~10 cm w.e., with a mean of 43 cm w.e., Fig. 6d). This is consistent with in situ stake observations which show no evidence of negative SMB above ~1700 m (a.s.l.) across 17 sites in Greenland (Machguth and others, Reference Machguth2016), and a persistent positive SMB at site S10 (1850 m a.s.l.) of the K-transect in southwest Greenland (van de Wal and others, Reference van de Wal2012), despite increases in surface melt at this site (Doyle and others, Reference Doyle2014). Furthermore, analysis of surface strain rates indicates that moulins and crevasses are unlikely to form above 1600 m (a.s.l.), and so meltwater access to the englacial drainage system is likely limited at these elevations (Poinar and others, Reference Poinar2015) and will instead flow along surface streams into moulins further downstream.
Ice flow may also be affected by the presence of firn aquifers, which are thought to be extensive in southeast Greenland (Miège and others, Reference Miège2016; Brangers and others, Reference Brangers2020) and which may store significant quantities of meltwater for several decades (Harper and others, Reference Harper, Humphrey, Pfeffer, Brown and Fettweis2012; Forster and others, Reference Forster2014; Miller and others, Reference Miller2018). Water stored in firn may increase ice motion through latent heat transfer (Phillips and others, Reference Phillips, Rajaram and Steffen2010, Reference Phillips, Rajaram, Colgan, Steffen and Abdalati2013; Poinar and others, Reference Poinar2017) and/or through drainage to the bed (Miège and others, Reference Miège2016; Poinar and others, Reference Poinar2017, Reference Poinar, Dow and Andrews2019). In the case of the latter, the presence of a firn aquifer may buffer the supply of meltwater to the bed, and thus possibly mask any long-term trend between ice velocity and meltwater production. However, drainage from firn aquifers is thought to most likely occur where there exists a downstream crevasse field through which it can drain to the bed (Miège and others, Reference Miège2016), and so may have a limited impact upon ice flow at the inland locations assessed in this study.
Changes in surface slope and/or ice thickness through both ice dynamical and SMB-related processes cause changes in driving stress and can thus contribute to changes in ice motion through changes to the internal deformation rate. To assess whether the velocity changes observed may be explained by changes in local driving stress, we estimate the expected change in velocity as a result of changes in ice thickness and surface slope at PARCA GPS site 36, inland of Jakobshavn Isbrae, where we observe the largest velocity increase. Applying this calculation elsewhere is difficult as the observed velocity changes are small (Fig. 1), the uncertainties associated with the SEC are proportionally large, and the potential errors associated with the following 20-year approximate SEC reconstruction, and thus the 1990s slope estimate, are too great, thus reducing confidence in our ability to make any meaningful comparison.
We extract ice thickness and surface slope, the latter calculated using surface elevation and under the assumption that ice flows in the direction of the steepest slope, at this location from BedMachineV3 (Morlighem and others, Reference Morlighem2017), and consider this as a representative for the period 2014–2018. We then use the CCI SEC v2.0 product (Simonsen and Sørensen, Reference Simonsen and Sørensen2017; Sørensen and others, Reference Sørensen2018) to calculate the cumulative SEC at each pixel within the 3 × 3-pixel window surrounding site 36, across the periods 1993–1997, 1998–2002, 2003–2007, 2007–2011 and 2012–2016. By adding this SEC to the ice thickness from BedMachineV3, we get a rough estimate of the initial ice thickness in 1993. Similarly, by adding the cumulative SEC to the BedMachineV3 surface elevation within the same 3 × 3-pixel window, we calculate an approximate initial surface slope for 1993. We subsequently calculate the change in ice thickness and surface slope.
The first-order relative change in surface velocity (δu s) as a result of changes in ice thickness and surface slope can be characterised by the following (Tedstone and others, Reference Tedstone2015):

where u s represents the initial ice surface velocity (194.5 m a−1), S and H represent the initial surface slope (0.018 m m−1) and ice thickness (1740.2 m), respectively, and δS and δH represent the change in surface slope (0.001 m m−1) and ice thickness (−7.2 m), respectively. The resultant approximation for a change in deformational velocity is 35.02 m a−1, which is within the uncertainty range of the observed velocity change (28.1 ± 7.8 m a−1) and thus compares well.
We also assess the role that SMB-driven thickness changes play in driving velocity change (Mernild and others, Reference Mernild2013). There has been extensive SMB-driven thinning around Greenland (van den Broeke and others, Reference van den Broeke2009; Mouginot and others, Reference Mouginot2019), for example, at site 36, modelled melt production increases by 150 mm a−1 between the 1990–1999 and 2014–2018 means (Fig. 6a). However, we observe no obvious spatial correlation between changes in ice velocity (Fig. 1) and modelled surface melt production. While we do observe large increases in surface melting (>100 mm a−1) at some GPS sites where we observe acceleration (i.e. inland of Jakobshavn Isbrae, Upernavik Isstrøm and Kong Oscar Gletsjer in the central to northwest), the GPS sites on the east coast show an almost pervasive deceleration despite increases in modelled melt production. This is most notable at the south-eastern GPS sites, where increases in modelled melt production are of a similar or greater magnitude (47–270 mm a−1) to those in the central and northwest (42–162 mm a−1).
To assess the impact of this SMB forcing alone, we follow Tedstone and others (Reference Tedstone2015) by taking a 100 km transect, extending 50 km on either side of site 36, and calculating the slope change from the linear change in ice thickness over this distance. Modelled melt production increased by 184.5 and 41.3 mm a−1 between the 1990–1999 and 2014–2018 means at the downstream and upstream ends of the transect, respectively, a difference of 143.2 mm a−1, and the concurrent change in accumulation rate is negligible. Assuming a linear increase in melt production over 20 years, this gives a total thinning of 1.5 m and a steepening of 0.000015 m m−1.
Applying the above equation, we estimate the associated change in deformational velocity as −0.18 m a−1, indicating that at site 36, SMB changes alone are unable to explain the observed velocity acceleration, and counteract some of the observed velocity increase. The modelling therefore suggests that in this inland region of the ice sheet, changes in surface slope are insufficient to overcome the reduction in driving stress caused by thinning. At all other sites where we observe acceleration, modelled melt production increase is either similar (northwest Greenland) or less than that observed inland of Jakobshavn Isbrae (Fig. 6a). As such, assuming a relatively consistent ice-sheet hypsometry, this suggests that a change in SMB may often act to oppose acceleration and is unlikely to drive an inland velocity change of more than several tens of cm a−1.
Changes to SMB have also been hypothesised to influence ice motion through cryo-hydrologic warming in regions transitioning from the accumulation to the ablation region (Phillips and others, Reference Phillips, Rajaram and Steffen2010, Reference Phillips, Rajaram, Colgan, Steffen and Abdalati2013). Despite increases in modelled melt production, we observe that all of the PARCA GPS sites have strongly positive modelled SMB in both the 1990–1999 and 2014–2018 periods (Figs 6c, d), and so we observe no evidence of a transition between accumulation and ablation zones at any site, with all 45 GPS sites remaining well within the accumulation zone.
As a result, we argue that our observations of inland acceleration are most likely driven by the upstream propagation of changes initiated at the terminus (Howat and others, Reference Howat, Joughin, Tulaczyk and Gogineni2005, Reference Howat, Joughin and Scambos2007; Joughin and others, Reference Joughin2008; Price and others, Reference Price, Payne, Catania and Neumann2008, Reference Price, Payne, Howat and Smith2011; Nick and others, Reference Nick, Vieli, Howat and Joughin2009; Felikson and others, Reference Felikson2017). This mechanism is discussed in more detail in the subsequent sections.
4.2. Observed velocity changes and regional differences
We observe almost ubiquitous acceleration across the GPS sites inland of tidewater glaciers in west Greenland with a slowdown at Umiammakku Isbrae being the only exception. The largest acceleration is observed ~117 km inland from the terminus of Jakobshavn Isbrae (7.6 ± 4.2 to 28.1 ± 7.8 m a−1), which is unsurprising given the high magnitude of acceleration and thinning observed near the terminus between the late-1990s and early-2010s (Joughin and others, Reference Joughin, Abdalati and Fahnestock2004, Reference Joughin2008, Reference Joughin, Smith, Shean and Floricoiu2014, Reference Joughin, Smith and Howat2018; Luckman and Murray, Reference Luckman and Murray2005; Holland and others, Reference Holland, Thomas, de Young, Ribergaard and Lyberth2008; Moon and others, Reference Moon, Joughin, Smith and Howat2012), primarily as a result of reduced back-stress through the loss of its floating ice tongue (Joughin and others, Reference Joughin, Abdalati and Fahnestock2004; Thomas, Reference Thomas2004; Holland and others, Reference Holland, Thomas, de Young, Ribergaard and Lyberth2008; Motyka and others, Reference Motyka2011). Moreover, modelling of dynamic thinning suggests that faster ice flow facilitates a larger magnitude propagation inland, with modelled thinning rates at 2000 m elevation of nearly −0.4 m a−1 within a drainage system with a mean flow velocity of ~120 m a−1 as opposed to an ice-sheet-wide average of ~−0.1 m a−1 with a mean velocity of ~60 m a−1 (Wang and others, Reference Wang, Li and Zwally2012), and Jakobshavn Isbrae is the fastest flowing outlet glacier on the GrIS (i.e. Joughin and others, Reference Joughin, Smith, Shean and Floricoiu2014, Reference Joughin, Smith and Howat2018).
We also observe inland acceleration at other tidewater glaciers in west Greenland that have undergone terminus retreat and associated near-terminus acceleration, such that their 2014–2018 ice velocities were greater than during the 1990s (Fig. 2). For example, the northern and central branches of Upernavik Isstrøm underwent rapid calving, retreat and acceleration beginning during the mid-late 2000s (Khan and others, Reference Khan2013; Larsen and others, Reference Larsen2016), and Narsap Sermia accelerated and retreated by ~3.3 km between 2010 and 2014, primarily as a result of increased submarine melting (Motyka and others, Reference Motyka2017). Similarly, Kong Oscar Gletsjer and Rink Isbrae retreated by several kilometres during the mid-2000s (Bevan and others, Reference Bevan, Luckman and Murray2012) and the mid-late 1990s (Catania and others, Reference Catania2018) respectively, in conjunction with acceleration (Fig. 2). Inland of these west coast glaciers, we observe acceleration ranging from 3.3 ± 1.0 to 3.7 ± 2.4 m a−1 inland of Kong Oscar Gletsjer up to 14.6 ± 7.5 m a−1 inland of Rink Isbrae. However, we observe a clear contrast between the dynamics of west and east Greenland. While outlet glaciers on the west coast almost all demonstrate inland acceleration, there is little evidence of propagation of downstream change inland of tidewater glacier termini on the east coast. We observe no evidence of inland acceleration at Helheim Gletsjer, Zachariae Isstrøm and 79 North Glacier, all of which have undergone significant frontal retreat and acceleration at some point between our measurement periods of 1993–1997 and 2014–2018 (Howat and others, Reference Howat, Joughin, Tulaczyk and Gogineni2005, Reference Howat, Joughin and Scambos2007, Reference Howat, Joughin, Fahnestock, Smith and Scambos2008; Rignot and Kanagaratnam, Reference Rignot and Kanagaratnam2006; Murray and others, Reference Murray2010; Bevan and others, Reference Bevan, Luckman and Murray2012; Mouginot and others, Reference Mouginot2015; our Fig. 3).
The duration of a specific terminus perturbation does not appear to control the likelihood of that perturbation propagating inland. We observe inland acceleration at sites with long-term perturbations (Jakobshavn Isbrae, Upernavik Isstrøm, Kong Oscar Gletsjer) as well as at sites with relatively short-term accelerations (i.e. Kangerlussuaq, Narsap Sermia), although all sites where we observe acceleration were flowing faster in their terminus regions during 2014–2018 than during 1990–1999. Moreover, we observe no inland acceleration at Zachariae Isstrøm despite continual acceleration since the early-2000s, or at Helheim Gletsjer which underwent a rapid speed-up of short duration from ~2002 to 2005 (Fig. 3). It may be that perturbations at the terminus have yet to propagate to the PARCA GPS sites inland of some tidewater glaciers, particularly in the north and northeast (Fig. S6) where the GPS sites are ~165–240 km inland from the terminus as opposed to ~85–141 km on the east and west coasts. Thinning has been observed to propagate along ice streams in West Antarctica at the rates of 6–15 km a−1 (Konrad and others, Reference Konrad2017) while acceleration near the terminus of Kangerlussuaq propagated 10 km up-glacier between 2005 and 2006 (Howat and others, Reference Howat, Joughin and Scambos2007). While recent work observes propagation rates in the lowest 20 km of Jakobshavn Isbrae an order of magnitude faster than the local mean flow speed (Riel and others, Reference Riel, Minchew and Joughin2021), the rates of propagation have not been observed further inland, or elsewhere in Greenland, and we are unable to determine propagation rates given the gap in our time series. Surface velocities derived from Landsat missions prior to Landsat-8 are characterised by both a reduced spatial coverage in inland regions, due to insufficient radiometric resolution to measure subtle features on the ice-sheet surface (Fahnestock and others, Reference Fahnestock2016), and increased uncertainties, which are particularly problematic given the slow surface velocities as one moves inland. Regardless, it is plausible that perturbations have not yet had the time to propagate sufficiently far inland to be observed at the PARCA GPS sites in northeast Greenland, especially given that the rate of propagation will slow as it moves further inland (van der Veen, Reference van der Veen2001). This is supported by separate velocity measurements, which show no evidence of acceleration beyond ~80–100 and ~50 km inland of Zachariae Isstrøm and 79 North Glacier, respectively (Mouginot and others, Reference Mouginot2015; their Fig. 2). Further south at Daugaard-Jensen and Helheim Gletsjers however, the PARCA GPS sites are a comparable distance inland to those on the west coast, as well as those at Kangerlussuaq, which have undergone acceleration in response to terminus perturbations, indicating that there may be an alternative control on the speed and/or limit of propagation (i.e. Felikson and others, Reference Felikson2017, Reference Felikson, Catania, Bartholomaus, Morlighem and Noël2020).
4.3. Influence of basal topography and ice geometry
Basal topography is a crucial factor controlling ice flow. Beneath the GrIS, widespread ice-filled valleys have been observed to extend significantly deeper below sea level and farther inland than previously thought (Morlighem and others, Reference Morlighem, Rignot, Mouginot, Seroussi and Larour2014), thereby channelling ice flow over distances from tens to hundreds of kilometres. Since deep troughs and the associated thicker ice lead to both higher driving stresses and warmer ice, they will encourage faster ice flow and potentially greater propagation distances (Wang and others, Reference Wang, Li and Zwally2012). We observe almost ubiquitous interior acceleration in the central and northwest regions, across areas that are characterised by low surface slopes and bed topography that remains below sea level for tens to hundreds of kilometres inland (Morlighem and others, Reference Morlighem2017).
For example, Jakobshavn Isbrae flows through a subglacial valley extending ~170 km inland (Morlighem and others, Reference Morlighem, Rignot, Mouginot, Seroussi and Larour2014), whereas the PARCA GPS sites are located ~117 km from the terminus (Table 1). Under these conditions, not only do we observe the large acceleration at the terminus, but this acceleration is likely to be channelled to, and beyond, the site at which we measure inland velocity change in this study. Similar patterns are observed at other west coast glaciers, where PARCA GPS sites are closer to the margin than the extent of the associated subglacial valleys, or, if further inland than the head of the valley, are at least within the theoretical stress-coupling length (4–10× the ice-thickness (Kamb and Echelmeyer, Reference Kamb and Echelmeyer1986)) of the maximum subglacial valley extent. In contrast, the one glacier on the west coast where we do not observe inland acceleration is Umiammakku Isbrae, despite near-terminus flow velocities ~200 m a−1 greater in the 2000s and 2010s compared to the early- to mid-1990s (Fig. 3). Here, an overdeepened subglacial valley extends just ~39 km from the terminus (Morlighem and others, Reference Morlighem, Rignot, Mouginot, Seroussi and Larour2014), whereas the PARCA GPS site is located ~115 km inland.
In the north, we observe no inland acceleration at Academy Gletsjer, where the head of the submarine valley is ~57 km closer to the terminus than the PARCA GPS sites. Similarly, outside of two flow branches of Kangerlussuaq, we observe no evidence of interior propagation on the east coast, where despite the existence of deep subglacial valleys (Morlighem and others, Reference Morlighem2017), basal topography rises quickly to plateaus above sea level (Morlighem and others, Reference Morlighem, Rignot, Mouginot, Seroussi and Larour2014), suggesting that these rapid rises in basal topography may limit the inland propagation of any thinning perturbation. This is the case at Helheim Gletsjer and Daugaard-Jensen Gletsjer, which are both grounded below sea-level for ~70 km, whereupon rises in basal topography over a short-distance have been theorised to prevent rapid glacier retreat or ice-sheet draw-down (Morlighem and others, Reference Morlighem, Rignot, Mouginot, Seroussi and Larour2014). Given that the PARCA GPS sites inland of Helheim Gletsjer and Daugaard-Jensen Gletsjer are ~118–120 and 108–137 km from the terminus, respectively, it is plausible that any perturbation at the terminus is limited by the rapid rise in basal topography at the end of the subglacial trough, such that no inland response is observed in our study.
This hypothesis, and our observations, is largely consistent with recent work that argues that steep rises (termed ‘knickpoints’) in bedrock topography act to limit the extent of inland thinning, such that the gentle basal topography of the northwest facilitates the propagation of thinning far into the ice-sheet interior, and the mountainous basal topography of the central east and southeast limits propagation to near the margin (Felikson and others, Reference Felikson, Catania, Bartholomaus, Morlighem and Noël2020). We observe inland acceleration at Rink Isbrae, Upernavik Isstrøm and Kong Oscar Gletsjer in the northwest, consistent with proposed thinning limits of >400, >300 and ~500 km, respectively (Felikson and others, Reference Felikson, Catania, Bartholomaus, Morlighem and Noël2020). Likewise, our observation of no inland speed-up at Umiammakku Isbrae is consistent with a thinning limit of 43.8 km, considerably downstream of the PARCA GPS site. Our results are also in agreement on the east coast, where Daugaard-Jensen Gletsjer and Helheim Gletsjer are characterised by thinning limits of 53.5 and 26.7 km (Felikson and others, Reference Felikson, Catania, Bartholomaus, Morlighem and Noël2020), again located >50 km downstream of the PARCA GPS sites and in line with the lack of inland acceleration observed in this study. While both 79 North and Zachariae Isstrøm show no inland acceleration despite extensive subglacial valleys extending beyond the PARCA GPS sites, as noted previously, it is plausible that since these sites are several hundred kilometres from the margin, the propagation speed is such that any downstream perturbation has not yet reached them. Alternatively, knickpoints in bed topography may limit any dynamic propagation to ~100–120 km inland of the termini of these glaciers, considerably downstream from the PARCA GPS sites in this region (Felikson and others, Reference Felikson, Catania, Bartholomaus, Morlighem and Noël2020).
Our observations of inland acceleration at Jakobshavn Isbrae, Narsap Sermia and Kangerlussuaq, however, are in contrast to the thinning limits suggested by Felikson and others (Reference Felikson, Catania, Bartholomaus, Morlighem and Noël2020) at these glaciers (57.9, 37.3 and 35.3 km, respectively). Since Felikson and others (Reference Felikson, Catania, Bartholomaus, Morlighem and Noël2020) argue that the Pe = 3 threshold accounts for 89% (with an interquartile range of 76–100%) of the total dynamic loss, our observations of acceleration inland of these glaciers may represent the remaining ~11% of dynamic change that has propagated beyond the empirical thinning limit. Alternatively, at Jakosbhavn Isbrae, there may be some uncertainty associated with the choice of flowline within the Pe analysis, with earlier work indicating a thinning limit of 240 km (Felikson and others, Reference Felikson2017) compared to the more recent 57.9 km estimate (Felikson and others, Reference Felikson, Catania, Bartholomaus, Morlighem and Noël2020).
While we observe acceleration inland of the suggested thinning limits at Jakobshavn Isbrae and Narsap Sermia, these accelerations remain consistent with the extent of underlying subglacial troughs (Table 1). In contrast, at Kangerlussuaq, our observed acceleration is both ~100 km inland of the thinning limit proposed by Felikson and others (Reference Felikson, Catania, Bartholomaus, Morlighem and Noël2020), and ~49 km inland of the maximum subglacial trough extent. Consequently, while basal topography and ice geometry appear to offer a compelling explanation for much of the observed inland velocity change, it is clear that the processes controlling tidewater glacier dynamics are complex. As such, multiple controls will likely impact the ability of a terminus perturbation to propagate inland, thus affecting how different inland regions of the GrIS have responded and will continue to respond to climate warming.
4.4. Comparison with other studies
Recent measurements of mass change between 2003 and 2019 from ICESat and ICESat-2 show a clear pattern of coastal thinning around the entire periphery of the GrIS, which decreases inland and changes to thickening at 2000–2500 m (a.s.l.) in southern and western Greenland, and at 1500 m (a.s.l.) in the northeast (Smith and others, Reference Smith2020). Thinning extends furthest inland at Jakobshavn Isbrae and in the northwest, consistent with our observations of multi-decadal accelerations in these inland regions. Similarly, mass change is far more limited in extent in the central east and northeast regions where we do not observe inland acceleration, although in the southeast, thinning appears to extend to approximately the locations of the GPS sites at which we observe no acceleration. As the dynamic component of mass change is not isolated in these ICESat and ICESat-2 data, the south-eastern thinning may be influenced by a decrease in SMB, which has contributed to 36 ± 12% of mass loss in this region between 1972 and 2018 (Mouginot and others, Reference Mouginot2019).
Measurements of SEC can be used to isolate the dynamic component of a thinning signal through the differencing of measured elevation change and modelled SMB (i.e. Pritchard and others, Reference Pritchard, Arthern, Vaughan and Edwards2009; McMillan and others, Reference McMillan2016). This methodology has revealed extensive dynamic thinning, penetrating deep into the ice-sheet interior. At Jakobshavn Isbrae, thinning has been observed ~120 km inland (Pritchard and others, Reference Pritchard, Arthern, Vaughan and Edwards2009), extending upwards of 2000 m surface elevation as early as 2001 (Thomas and others, Reference Thomas2003). Similar pervasive thinning has been observed inland of other fast-flowing tidewater glaciers, notably Helheim Gletsjer, Kangerlussuaq, Upernavik Isstrøm and Zachariae Isstrøm (Pritchard and others, Reference Pritchard, Arthern, Vaughan and Edwards2009; McMillan and others, Reference McMillan2016). On a regional scale, the northwest and southeast margins are characterised by the strongest dynamic thinning (Pritchard and others, Reference Pritchard, Arthern, Vaughan and Edwards2009; Zwally and others, Reference Zwally2011; Csatho and others, Reference Csatho2014) although the furthest propagation of thinning inland is observed in the west and northwest, with thinning in the southeast less extensive (Zwally and others, Reference Zwally2011; Csatho and others, Reference Csatho2014). Moreover, in the southeast, the inland extent of dynamic thinning has been observed to rapidly decrease between the period 2003–2005 and 2009 (Csatho and others, Reference Csatho2014), and outside of Kangerlussuaq, significant signals of dynamic thinning are not clear (McMillan and others, Reference McMillan2016).
These observations are reinforced by modelling work, which indicates that dynamic thinning may penetrate deep into the ice sheet in as little as 10 years of an initial perturbation, with modelled thinning rates of up to 40 cm a−1 extending to 2000 m elevation in central west and northwest Greenland (Wang and others, Reference Wang, Li and Zwally2012). For the fast-flowing outlet glaciers of Jakobshavn Isbrae, Helheim Gletsjer and Kangerlussuaq, modelling of dynamic thinning along the centre-profile between 2003 and 2005 suggests thinning during this period would reach ~80–100 km inland of the terminus at Jakobshavn Isbrae and ~30–40 km inland at both Helheim Gletsjer and Kangerlussuaq (Price and others, Reference Price, Payne, Howat and Smith2011).
Our work largely supports these studies. We observe a strong interior acceleration inland of Jakobshavn Isbrae, a region characterised by extremely strong dynamic thinning (Pritchard and others, Reference Pritchard, Arthern, Vaughan and Edwards2009; Zwally and others, Reference Zwally2011; Csatho and others, Reference Csatho2014; McMillan and others, Reference McMillan2016), with speed-ups of smaller magnitude inland of other west coast tidewater glaciers. We observe interior acceleration upstream of two of the main flow branches of Kangerlussuaq on the east coast, and do not measure any long-term interior acceleration inland of Helheim Gletsjer or Zachariae Isstrøm, despite indications of some penetration of dynamic thinning inland at these glaciers (Pritchard and others, Reference Pritchard, Arthern, Vaughan and Edwards2009; McMillan and others, Reference McMillan2016). Our observations in northeast Greenland are supported by other satellite-image-derived velocities, which indicate little if any interior acceleration inland of Zachariae Isstrøm and 79 North Glacier beyond ~80–100 and ~50 km from the terminus, respectively (Mouginot and others, Reference Mouginot2015).
5. Conclusions
In this study, we present the first multi-decadal analysis of ice-sheet-wide changes in ice velocity within the accumulation zone of the GrIS. Along the west coast, we observe evidence of inland acceleration, most likely in response to perturbations originating at tidewater glacier termini. In contrast, away from Kangerlussuaq, we observe no inland acceleration on the east coast, despite acceleration and thinning at the terminus of many of these marine-terminating glaciers. The complexity within the observed pattern of inland change likely reflects a range of controls, including the speed at which a perturbation can propagate inland, and the influence of ice geometry and basal topography in facilitating or limiting the extent to which a perturbation can propagate up-glacier.
These findings are of great importance with regards to Greenland's future contribution to global sea-level rise, as they indicate that ice acceleration at many tidewater glaciers has the potential to propagate considerable distances into the ice-sheet interior, accelerating the draw-down of greater volumes of thicker ice towards the margins, thus accelerating mass loss. Moreover, our results indicate that this mass loss as a result of the draw-down of ice from the interior should be further exacerbated by future acceleration and thinning perturbations at tidewater margins. However, our results also support recent work that indicates that local ice geometry and bed topography are crucial in facilitating or limiting the ability for a perturbation at the terminus to propagate inland (Morlighem and others, Reference Morlighem, Rignot, Mouginot, Seroussi and Larour2014, Reference Morlighem2017; Felikson and others, Reference Felikson2017, Reference Felikson, Catania, Bartholomaus, Morlighem and Noël2020), and suggest that as a result of steep down-glacier bed topography, inland regions in east Greenland may be more resilient to the impacts of future outlet glacier acceleration than those in the west. This is consistent with recent work that suggests that the presence of steep subglacial knickpoints limits the extent to which thinning can diffuse inland, particularly in the southeast, whereas the gentle bed topography of the northwest facilitates the propagation of thinning hundreds of kilometres inland (Felikson and others, Reference Felikson, Catania, Bartholomaus, Morlighem and Noël2020). Consequently, we expect that Greenland's future contribution to global sea-level rise will be spatially complex and will depend on the ability for dynamic changes at the termini of individual outlet glaciers to propagate inland.
Supplementary material
The supplementary material for this article can be found at https://doi.org/10.1017/jog.2021.31
Acknowledgements
J.J.W. was funded by a UK Natural Environment Research Council (NERC) doctoral training partnership grant (NE/L002558/1). We thank Xavier Fettweis for providing the MAR v3.10 SMB data, and Denis Felikson for helpful discussions with regards to the propagation of terminus perturbations inland. We also thank the two reviewers whose suggestions and comments helped improve the manuscript.
Author contributions
J.J.W., N.G. and P.N. contributed to the design of the study and the writing of the paper. J.J.W. performed data processing and analyses.


 Open access