

1. Introduction
Thwaites Glacier dominates the mass balance of the Amundsen Sea Embayment of the West Antarctic ice sheet (WAIS; Fig. 1) (Reference RignotRignot and others, 2008). The bounding ice shelf of Thwaites Glacier is disintegrating (Reference MacGregor, Catania, Markowski and AndrewsMacGregor and others, 2012; Reference Pritchard, Ligtenberg, Fricker, Vaughan, Van den Broeke and PadmanPritchard and others, 2012), allowing the glacier’s grounded fast-flowing main trunk to lower and expand rapidly (Reference RignotRignot and others, 2008; Reference Pritchard, Arthern, Vaughan and EdwardsPritchard and others, 2009), losing a net 360 Gt of ice between 1992 and 2011 (Reference ShepherdShepherd and others, 2012). The bedrock geometry underlying Thwaites Glacier has been hypothesized, if such a retreat continues, to induce a significant self-reinforcing retreat through the marine ice-sheet instability. Therefore, the collapse of Thwaites could contribute to the collapse of much of the WAIS (Reference HoltHolt and others, 2006; Reference SchoofSchoof, 2007), raising sea levels by up to 3 m (Reference Bamber, Riva, Vermeersen and LeBrocqBamber and others, 2009).

Fig. 1. AGASEA bed elevation data (colored lines) in the context of the West Antarctic ice sheet, with surface elevation contours (Reference FretwellFretwell and others, 2013) (m) and ice velocities (Reference Rignot, Mouginot and ScheuchlRignot and others, 2011) in grayscale. Boxed area shows location of Figure 3. Inset shows location within Antarctica.
To provide a framework for understanding the evolution of Thwaites Glacier, the Airborne Geophysical Survey of the Amundsen Sea Embayment, Antarctica (AGASEA) project conducted the first comprehensive areogeophysical survey of the entire glacier catchment (Fig. 1), using ice-penetrating radar (Reference HoltHolt and others, 2006), laser altimetry (Reference Young, Kempf, Blankenship, Holt and MorseYoung and others, 2008) and gravity measurements (Reference Diehl, Holt, Blankenship, Young, Jordan and FeraccioliDiehl and others, 2008). The remote nature of Thwaites Glacier restricted the line spacing for this survey to a minimum of 15 km. The survey revealed that Thwaites Glacier lies in a well-defined subglacial basin, with complex topography consisting of highlands, lowlands and channelized morphology.
Grounding line retreat interacts with underlying topography in a number of ways now captured by high-order ice-sheet models (Reference ParizekParizek and others, 2013). Longitudinal stresses transmitted both from the grounding line and basal relief contribute to the force balance driving sliding ice flow (Reference JoughinJoughin and others, 2009). Grounding line retreat is sensitive to short length scales. In addition, subglacial relief at all scales can play a critical role in routing and focusing subglacial water, which lubricates the base of the ice sheet (Reference Carter, Blankenship, Young and HoltCarter and others, 2009; Reference JoughinJoughin and others, 2009; Reference Schroeder, Blankenship and YoungSchroeder and others, 2013).
To accurately model the flow of ice across bedrock topography, we require a digital rendering of the topography at a scale that is much smaller than the typical cross-line resolution of an aerogeophysical radar survey. For example, the Thwaites Glacier survey collected data along track lines spaced 15 km apart. In contrast, a sensitivity analysis by Reference Durand, Gagliardini, Favier, Zwinger and LeMeurDurand and others (2011) indicated that a digital elevation model (DEM) resolution of 1 km or better is required for accurate glacier modeling, particularly nearer to the coast. Logistical and financial hurdles typically preclude obtaining such high-resolution radar data. An alternative, however, is to interpolate the data in a manner that replicates the small-scale roughness observed in the available data. This form of interpolation is termed a ‘conditional simulation’, perhaps most notably used in the hydrocarbon literature for the purpose of reservoir modeling and in mining literature for mapping of ore deposits (e.g. Reference Journel and HuijbregtsJournel and Huijbregts, 1978; Reference ChristakosChristakos, 1992; Reference Deutsch and JournelDeutsch and Journel, 1992). Although a conditional simulation is non-unique, it provides a modeling surface that is realistically rough rather than unrealistically smooth. Furthermore, the non-uniqueness allows the generation of multiple realizations that effectively sample the probability space of the surface given the data available (i.e. the ‘conditions’ for the simulation), allowing modelers to investigate uncertainty in their results.
The aim of this paper is to present a method for conditional simulation applied to the bed of Thwaites Glacier, and which could readily find application to other glacier beds. The Thwaites Glacier bed presents four challenges for interpolation/conditional simulation, which we demonstrate in subsequent sections, that guided the development of our methodology:
1. The Thwaites Glacier bed is dichotomous, with what we term a ‘lowland’ and ‘highland’ morphology that is often separated by a sharp boundary. Abrupt transitions are problematic for any method of statistical characterization, which requires finite quantities of data. Statistical analysis that incorporates data from both sides of the transition will result in a characterization that is in some way an average of the two regions, and truly representative of neither. Here we develop a new method for ‘provincing’ the data in order to separate the statistical analyses of lowlands and highlands.
2. The Thwaites Glacier bed exhibits channelized morphology, sinuous to a significant degree and present in various orientations. Such channels may be very important for modeling glacier flow, and we seek to generate a modeling surface that maintains their continuity. Standard interpolation techniques invariably fail to maintain the continuity of channelized morphology unless the data track spacing is small relative to the width of the channel. To address this issue, we update and apply a methodology developed by Reference Goff and NordfjordGoff and Nordfjord (2004) for interpolation of buried river channels discerned in reflection seismic data.
3. The Thwaites Glacier bed is strongly heterogeneous in its statistical character, within each province as well as between them. This represents a significant complication for algorithms that generate the random component of the conditional simulation (the ‘unconditional’ simulation), which typically assume a constant statistical model over the area being simulated. Here we incorporate a convolution method for simulation designed by Reference Goff and ArbicGoff and Arbic (2010) for the purpose of global realization of abyssal hill morphology. Though computationally inefficient, particularly compared to the equivalent Fourier method, the convolution method nevertheless allows statistical parameters to be fully specified as a function of location.
4. The onus of conditional simulation of any glacier bed will be to match the observed small-scale roughness, i.e. the roughness at scales near the resolution limit of the simulation grid. This is a critical factor for determining basal drag and the primary factor that more typical interpolation techniques get most wrong. Statistical models constrain small-scale roughness using a fractal dimension, which specifies small-scale spectral amplitudes in relation to larger-scale spectral amplitudes. The challenge here is that direct estimation of the fractal dimension requires a large quantity of data, and thus provides a poor measure for constraining small-scale roughness amplitude where it varies on short distance scale (e.g. between the floor of a channel and the flanking terrain just a few kilometers away). In this paper, we develop a new methodology for inferring the fractal dimension: an iterative algorithm that, with the large-scale height and distance parameters determined through established means, adjusts the fractal dimension so that the small-scale roughness of a simulated surface matches the small-scale roughness measured in the data.
Our final objective is a complete conditional simulation of the Thwaites Glacier bed, which will be available for download through the lead author of this paper. For guidance through the various steps of the methodology, a flow chart is provided in Figure 2.

Fig. 2. Flow chart outlining the conditional simulation methodology applied to the bed of Thwaites Glacier. Numbers above upper left corner of each box indicate text section numbers where those steps are described.
2. Radar Sounding Data
The radar sounding data (Fig. 3) were selected to have similar processing parameters. We used chirped 60 MHz High-Capability Radar Sounder (HiCARS) coherent radar data (Reference Peters, Blankenship and MorsePeters and others, 2005) with a bandwidth of 15 MHz, providing a theoretical range resolution in ice of 6 m. All data were processed with one-dimensional (1-D) focusing (Reference Peters, Blankenship, Carter, Kempf, Young and HoltPeters and others, 2007; Reference Blankenship and YoungBlankenship and Young, 2012), where echoes were located within the along-track pulse-limited footprint of the radar, and echoes fore and aft of the footprint were discarded. These data were down-sampled to~ 17 m along track. The limiting nadir along-track resolution is ~10 m, and at the sampling used for this study we can distinguish features ~35 m in size.

Fig. 3. Thwaites Glacier bed topography derived from radar sounding data (Reference HoltHolt and others, 2006; Reference Young, Kempf, Blankenship, Holt and MorseYoung and others, 2008). Location shown in Figure 1. Cross-hatched regions represent our identification of a ‘lowland’ province. Unstippled regions are identified as ‘highlands’. Lines drawn indicate our interpretation of channel center line (solid) and edges (dashed).
Processed radar data were log-detected and semi-automatically interpreted for surface and bed reflectors; the range to these reflectors was then used to determine nadir ice thickness. Cross-track clutter is the major source of ambiguity. The cross-track antenna beam pattern on the ice bed covers ~3 km; cross-track slopes of greater than ~25˚ will tend to map echoes closer in range than the nadir bed. As this phenomenon does not affect along-track echoes in the focused data, orthogonal crossovers in rough areas can produce large differences. Over mountainous regions west and south of the survey area, maximum crossover differences are ~150 m, whereas over the central catchment they are ~33 m. These differences are largely averaged out by binning in the conversion from track line to gridded representations.
2.1. Provincing and channel identification
The Thwaites Glacier radar bed topography data exhibit two significant morphological characteristics that will present important challenges for the formulation of a model surface: provinces and channels.
We use the term ‘provinces’ to indicate terrains that are separated by an abrupt transition. We do not imply that the statistical characteristics of the topography within each province are uniform. Indeed, we expect heterogeneity within each province, but with gradual, rather than abrupt, transitions in character. An abrupt transition is illustrated in Figure 4a, which plots the topographic data derived from a radar track through the central basin of Thwaites Glacier. From the mouth of the glacier to the left, the topography deepens gradually with approximately similar roughness properties. However, at ~380 km from the start of the profile, the topography rises by ~1 km over a span of ~5 km, a clear departure from the behavior of the profile to the left of this transition. In addition, the vertical variability is noticeably increased to the right of the transition, while the lateral scale of variability appears to have decreased. We identify the terrain to the left of the transition as ‘lowlands’ and to the right as ‘highlands’. This may appear a slight misnomer, as some of the lowland terrain at the far left of the image is roughly the same topographic height as the highlands to the right. However, this terminology is primarily intended to reflect the nature of the transition between the two terrains.

Fig. 4. (a) Bed topography data profile through the overdeepened center of Thwaites Glacier, displaying an abrupt transition between lowland and highland morphology at 380 km track distance. (b) Radargram displaying candidate channels (bars). Locations shown in Figure 3.
For the purposes of statistical characterization described in Section 5.1, we have separated the Thwaites Glacier bed topography data into lowland and highland provinces based on our identification of an abrupt transition in topographic height (cross-hatched region in Fig. 3, which also incorporates channel features as described below). Some of the boundary is not nearly as abrupt as the example shown in Figure 4a, but was necessary to choose in order to maintain continuity of the province identification.
Channels can often be identified in cross sections on the radar reflection images (Fig. 4b). Adapting and modifying methods described in Reference Goff and NordfjordGoff and Nordfjord (2004), we map channels by first identifying ‘candidate’ channel segments in radargram cross section (deep ‘U’- or ‘V’-shaped features), and then transfer those interpreted locations to map view along with their color-coded topographic values in an ArcGIS® application. Channel identification is an iterative process where the map view helps to identify locations where channels are likely, or expected based on trends, so that the profiles can be examined with greater scrutiny. The course of a channel can confidently be identified where candidate channels line up well on successive tracks. Candidate channel segments that could not be associated in this way with other candidate channels were not utilized in the final interpretation. Using ArcGIS® 1 utilities, we trace the edges of each identified channel, which may have variable width, along with an approximate center line (Fig. 3); these lines are used to guide the channel interpolation algorithm described in Section 4. Channel features are generally contiguous with the lowland areas and are therefore treated here as a subset of the lowland province.
The channel interpretation is, of course, a subjective product; different interpreters may not produce identical results. We also cannot know a priori that proximal ‘U’- or ‘V’-shaped morphological features are connected through areas that are not covered by data, although that is certainly a reasonable assumption given what we know about subglacial topography. While we can assert that including the channels represents a more accurate representation of the interpolated surface than not including the channels, the procedure nevertheless introduces an uncertainty factor that is difficult to quantify.
3. Conditional Simulation Algorithm
There are two general classes of conditional simulation algorithms. One is known as sequential Gaussian simulation (sGs), with a variety of derivative forms (Reference Deutsch and JournelDeutsch and Journel, 1992). Such algorithms work by sequentially choosing an unsampled grid location at random, and then determining the Gaussian probability density function at that location given the conditions determined by proximal data values and previously simulated values; the distribution is determined by a statistical model for the surface that specifies both the local mean and semivariogram properties. A random value is then chosen from that distribution, it becomes a new condition, and the operation is repeated until all unsampled locations are simulated in this manner.
The second class of conditional simulation algorithms separately formulate (1) a deterministic surface by some form of smooth interpolation of the data (typically by kriging), and (2) an unconditional simulation by random realization of a statistical model (typically by inverse fast Fourier transform). The conditional simulation is then generated by ‘draping’ the unconditional simulation over the deterministic surface in such a way as to leave data values unaltered. More formally, the algorithm can be expressed as follows (Reference Journel and HuijbregtsJournel and Huijbregts, 1978; Reference Fouquet, Armstrong and DowdFouquet, 1994; Reference Goff and JenningsGoff and Jennings, 1999). Let Z (x) be a topographic field of interest that has data samples at locations ![]()
Step 1: Compute a deterministic interpolation of data points, Z I (x)
Step 2: Compute an unconditional simulation, ZU(x) from a stochastic model for Z (x).
Step 3: Sample Z U (x) at data locations x i, (i ϵ 1, 2, …, N), and compute a deterministic interpolation, Z UI (x), from these values in the same manner as in step 1.
Step 4: Compute a conditional simulation:
For the purposes of the work presented here, the primary advantage of this ‘draping’ algorithm over sGs is that it allows great flexibility in how the deterministic interpolation surface is formulated. In sGs algorithms, deterministic (i.e. the mean) and stochastic components of the simulation are integrated into a single formulation. Normally this would be seen as advantageous, due to the greater mathematical rigor and prospects for quantification of uncertainty. However, the complexity of the Thwaites Glacier bed, particularly the channelized morphology, which requires very specialized interpolation techniques, as well as the abrupt changes in mean altitude described in the previous section, make application of sGs algorithms very challenging. We therefore utilize the draping algorithm. Sections 4 and 5 address, respectively, the formulation of the deterministic interpolation and the stochastic unconditional simulation components of the conditional simulation for the Thwaites Glacier bed.
The approach taken here for generating a deterministic interpolation is strictly geometrical, which provides an entirely independent surface model for use in flow models. An alternative, physics-based approach is the ‘mass-conserving bed’ algorithm (Reference Morlighem, Rignot, Seroussi, Larour, Ben Dhia and AubryMorlighem and others, 2011; Reference McNabbMcNabb and others, 2012), which estimates ice thickness based on measurements of ice flux. It works by combining surface velocities, surface mass-balance estimates and ice thickness observations in a solution of the mass conservation equation. There are two important disadvantages to this approach: (1) bed elevation estimates are not independent of the ice flow measurements, which can lead to circular reasoning in application of flow models, and (2) the spatial resolution of the bed elevation estimates has not been defined. On the other hand, the mass-conserving bed approach may be of great assistance in better defining channelized bed topography. Further investigation of this approach will be reserved for future study.
4. Deterministic Interpolation
In this section, we describe the methodology used to generate a deterministic interpolation of the Thwaites Glacier bed topography (Fig. 2, deterministic path). The primary steps include: (1) interpolation of channels within a channel-centric coordinate system, and then (2) merging the channel interpolation with an interpolation of all available data in geographic coordinates.
4.1. Channel interpolation algorithm
Within a channelized surface, channel orientations can vary widely (e.g. in a dendritic system), and individual channels can be sinuous and thus subject to large changes in orientation along their course. Channel orientations are therefore highly unpredictable. Unless data-track spacing is smaller than the width of the channel, any interpolation technique applied to the channelized surface as a whole will invariably fail to maintain the essential morphology of the channel, which is the continuity of the channel along its course. This difficulty is illustrated in Figure 5a, a spline-in-tension interpolation (Reference Smith and WesselSmith and Wessel, 1990) applied to the Thwaites Glacier bed topography data shown in Figure 3. The continuity of all of the thinner channels (i.e. widths less than the ~15 km track spacing) that were identified in Figure 3 has not been preserved in interpolation, which has instead errantly rendered them as a series of basins along their course.

Fig. 5. (a) Interpolation of Thwaites Glacier bed topography data using a spline-in-tension algorithm (Reference Smith and WesselSmith and Wessel, 1990). Topography from several mountain tops that breach the glacier surface were incorporated from high-slope (>0.258) portions of the 400 m Antarctic DEM (Reference Liu, Jezek and LiLiu and others, 1999). (b) Same as (a) with the addition of channel interpolation points.
The Reference Goff and NordfjordGoff and Nordfjord (2004) algorithm for channel interpolation (Fig. 2) works by forcing the channel orientation to be predictable rather than unpredictable. This is done through a coordinate transformation that moves the data points from geographic coordinates into a coordinate system specified by distance along the channel for the x –axis, and distance across the channel for the y –axis. In this channel-centric coordinate system, the channel is straight and oriented along the x –axis. Coordinate transformation must be done individually for each channel but, once accomplished, it is straightforward to interpolate a channel oriented along the x –axis such that the continuity of the channel is maintained along its length. Retransformation can then bring the channel interpolation back into geographic coordinates.
This approach is demonstrated in Figure 6 for the channel identified by arrows in Figures 3 and 5. The initial coordinate transformation of data (Fig. 6a) is guided by the center line traced for the channel (Fig. 3), as described by Reference Goff and NordfjordGoff and Nordfjord (2004). The continuity of the channel is maintained by interpolating in three steps: (1) data are interpolated along the center line and along the edges (Fig. 6b), both of which are defined by the traces shown in Figure 3; (2) additional interior lines are traced between the edges and the center line (Fig. 6c); and then (3) remaining locations are filled in using a spline-in-tension algorithm, and areas outside the edges of the channel are clipped (Fig 6d).

Fig. 6. Demonstration of the channel interpolation algorithm. (a) Transformation of data proximal to center line into channel coordinates. (b) Interpolation along center line and edges. (c) Interpolation along interim lines. (d) Spline interpolation of the remainder, and clipping outside of channel edges. Location of channel identified in Figures 3 and 5
The channel interpolation was conducted over a sufficiently fine resolution that, when the grid values are transformed into geographic coordinates and placed within the geographic grid, there are no gaps caused by the inevitable stretching associated with channel curvature. This is a critical factor because merging different channels onto the same geographic grid is accomplished by selecting the lowest topographic value that falls within a gridcell. In this way, the flanks of a trunk channel do not become a barrier of a tributary channel where the latter enters the former. If there were gaps in one or the other of the merging channels, spike artifacts would result.
4.2. Interpolation in geographic coordinates
The completed interpolation surface is generated by first placing the channel interpolation values on the geographic grid in the manner noted above, interpolating the remaining values with a spline-in-tension algorithm and then masking out regions that are outside the data coverage (Figs 2 and 5b). The before-and-after channel interpolation comparison (Fig. 5) clearly demonstrates the success of the channel interpolation algorithm in maintaining the continuity of the channels as they were interpreted (Fig. 3). We caution, however, that the interpretation itself is partly subjective and subject to uncertainties that are poorly defined. Nevertheless, it can be hypothesized that channelized morphology is an important factor in modeling glacier flow, and we can utilize the channel interpolation method for testing it.
The surface in Figure 5b thus constitutes our deterministic interpolation component of the conditional simulation algorithm (Fig. 2). Although we have employed a spline-in-tension algorithm, both within the channel interpolation and elsewhere, there are many possible algorithms that could be utilized. It could be argued that the kriging algorithm (Reference Deutsch and JournelDeutsch and Journel, 1992) is best because its goal is to determine the expected value at any unsampled location given the data that were sampled. Our objection to this approach is that the kriging interpolation tends to drift toward an a priori mean value, and this drift increases with distance from data constraints. How the interpolation performs will depend in large part on how the mean is determined. A global mean, for example, would be unsuitable for the Thwaites Glacier bed data: lowland areas would tend to be interpolated towards higher values, and highland areas would tend to be interpolated towards lower values. A more complex mean surface would therefore be required, but requires an arbitrary choice of the size of the region used to define the mean. Furthermore, the often abrupt boundary between highland and lowland provinces (Fig. 3) will greatly complicate the determination of a mean surface. We prefer the spline-in-tension methodology both because it removes such a subjective component of the interpolation and because it is not potentially compromised by a reversion to an a priori mean.
The grid spacing chosen for generating the deterministic surface, and for all grids to follow, is 250 m. This is a user-defined value, dependent on modeling applications. This choice has no impact on the procedures to follow, aside from computation times.
5. Unconditional Simulation
An unconditional simulation (Fig. 2, stochastic path) is derived from a statistical model, the parameters of which are estimated from available data. In this section, we describe the methodology for parameter estimation utilizing the von Kármán statistical model, which provides a characterization of height scales, length scales and fractal dimension (e.g. Reference Goff and JordanGoff and Jordan, 1988). Parameters are estimated using a weighted least-squares inversion algorithm, separately for highland and lowland provinces. These analyses result in parameter grids, which specify the laterally varying value of each parameter of the von Kármán model across the region of interest. The unconditional simulation is created using a convolution algorithm, which is capable of generating statistically heterogeneous fields. Additional procedures are introduced for refining the fractal dimension, with the goal of matching the variability in small-scale roughness exhibited by the data.
5.1. Statistical parameter estimation
5.1.1. Provincing
The statistical characterization is derived from the available data, which, as earlier noted, we separate by lowland and highland provinces (Fig. 3). The separation is accomplished using ArcGIS® utilities by selecting data from profiles that either intersect with the polygonal area defining the lowland areas, and are thus defined as lowland data, or do not intersect, and are therefore defined as highland data. Figure 7 illustrates the procedure for a profile that crosses the lowland/highland boundary several times. The single profile thus becomes two separate profiles, one for lowlands and the other for highlands, each with gaps where the other is present. We apply our statistical parameter estimation technique (described below) separately to each.

Fig. 7. Demonstration of provincing applied to a bed topography profile. A single profile is separated into lowland (shaded) and highland profiles with gaps. Location shown in Figure 3.
5.1.2. The von Kármán statistical model
Statistical characterization is accomplished using the von Kármán model (Reference Von Kármánvon Kármán, 1948), which can be expressed in spectral, covariance or semivariogram forms. Originally developed to describe turbulence, the von Kármán model has found utility in a wide variety of settings because it captures, with minimal parameterization, the essential elements of a random field. It has been applied successfully to such diverse fields as bathymetry (Reference Goff and JordanGoff and Jordan, 1988), sea-ice drafts (Reference GoffGoff, 1995) and crustal heterogeneity (Reference Goff and LevanderGoff and Levander, 1996).
Equations specifying the von Kármán model and the inverse method for estimating its parameters from one- and two-dimensional data are given in detail in Reference Goff and JordanGoff and Jordan (1988, Reference Goff and Jordan1989a,Reference Goff and Jordanb) and Reference GoffGoff (1995). For explanatory purposes, we present a schematic representation of the 1-D von Kármán spectrum in Figure 8a. At high wavenumbers, the model is represented by a power law which, when plotted in log–log scale, is a sloping line. This is the well-known fractal representation (Reference MandelbrotMandelbrot, 1982), where the fractal dimension is determined by the gradient of this line. However, the von Kármán spectrum is a bounded fractal model, in that the variance does not continue to increase without end as wavenumber decreases (or the horizontal scale increases). Variance is limited by a corner wavenumber, below which the spectrum is flat. This yields two important characteristics of the model: (1) it imposes a characteristic horizontal scale, which is proportional to the inverse of the corner wavenumber, and (2) it yields a bounded variance (or its square root, the root-mean-square (rms) height) that is not dependent on the length of the data considered provided that this length is larger than the characteristic scale. The von Kármán model in one dimension is thus defined by these three parameters: the rms height, H, the characteristics scale,λ 0, and the fractal dimension, D. These parameters describe, respectively, the heights and widths of the largest topographic features, and how smaller-scale features relate to the largest features.

Fig. 8. (a) Schematic representation of the von Kármán statistical model in the spectral domain. (b) Inversion of the von Kármán model parameters using the covariance function (the Fourier transform of the power spectrum). Solid curve is covariance derived from highland province profile shown in Figure 7. Dashed curve is best-fit model using a weighted, least-squares inversion (Reference Goff and JordanGoff and Jordan, 1988; Reference GoffGoff, 1995).
The von Kármán model can also be expressed in a two-dimensional form that accounts for anisotropy in the characteristic scale (Reference Goff and JordanGoff and Jordan, 1988). Anisotropy characterizes the extent to which features are lineated rather than equant. However, the latticework of AGASEA track lines over Thwaites Glacier is insufficient to adequately constrain this functionality. We restrict consideration, therefore, to the isotropic case, the parameters of which are identical to the 1-D model (with fractal dimension increased by 1). The gaps in the data are not amenable to computation of the power spectral density. Parameter estimation is therefore accomplished using the covariance function (Fig. 8b), which is the Fourier transform of the power spectrum. In this functionality, H is determined by the square root of the covariance at 0 lag, which is simply the variance;λ 0 is a measure of the width of the covariance; and D is determined by the curvature of the covariance near the origin: convex curvature indicates D < 1.5, and concave curvature indicates D > 1.5. At fractal dimension 1, the covariance intersects the origin with zero slope; this indicates that the profile is differentiable and therefore very smooth at small scales.
5.1.3. Weighted least-squares inversion
Prior to inversion, profiles are detrended using a low-order polynomial fit, typically order 4. Detrending isolates the random component of the field in order to estimate statistical parameters. The profile covariance function is then computed, and a 1-D form of the Reference Goff and JordanGoff and Jordan (1988) estimation algorithm, a weighted, least-squares inversion, is applied (Reference GoffGoff, 1995; Fig. 2). Figure 8b displays an example of a best-fit von Kármán covariance model, along with the three parameters and their estimated uncertainties. Data from the highlands profile in Figure 7 were utilized for this example.
Approximately 100–200 km-long profile lengths were used for the inversion; shorter profile lengths typically result in unacceptably high uncertainty values for λ 0 and D. Even so, the inversion is often unstable with respect to D due in part to the difficulty in inverting for curvature, and because D is bounded to be greater than 1.0 and less than 2.0; the inversion crashes when an iteration attempts to choose a value outside these bounds. Fractal dimensions near 1.0 are particularly difficult to estimate through this inversion. In these cases it is necessary to fix the value of D in order to obtain estimates of H and λ 0. For consistency in the parameter estimation, D was fixed in the inversion of all samples, to a value between 1.1 and 1.4, a ‘by eye’ fit to the curvature near the origin, and H and λ 0 were then estimated through the iterative algorithm. Fixing D is justified in this step because it is not strongly correlated to either H or λ 0. Furthermore, the subjectively fixed values are not retained, as we will more rigorously estimate the fractal dimension below, using a different procedure described below.
5.1.4. Reparameterization of large-scale roughness
The rms height is a better-resolved parameter than the characteristic scale, requiring fewer data to stably estimate. Reference Goff and JordanGoff and Jordan (1989b) determined that rms heights can be estimated to an error of 15% using data lengths as short as 3 times the characteristic length, whereas characteristic lengths can only be estimated to an error of 25% using track lengths of ~6 times the characteristic length. Furthermore, H can be estimated without inversion (though without error estimates) by computing the square root of the variance calculated from detrended profiles. To maximize our resolution of heterogeneity, we discard H values estimated through the inversion procedure, which were obtained from 100–200 km-long sections of data, and compute the rms height at each data location over a 50 km-long section of the detrended profile centered on each data point. We refer to this value as H 50. The choice of 50 km is justified by the fact that our estimates of characteristic length for these data rarely exceed 15 km, and so generally surpass the 3 λ 0 benchmark for estimating H suggested by Reference Goff and JordanGoff and Jordan (1989b).
5.1.5. Parameterization of small-scale roughness
The fractal dimension is important for the purpose of conditional simulation because, as noted earlier, it defines the scaling relationship between small and large features. Through the fractal dimension we have a mechanism for predicting the small-scale roughness at unsampled locations based on observations of large-scale roughness, which is characterized by the parameters H 50 and0. The estimation of D by inversion of the covariance is clearly unsatisfactory, both because of the instability of the estimate noted above and because the length of data required for the inversion (100–200 km) greatly restricts the resolution of inhomogeneity. However, if H 50 and λ 0, which largely define the upper termination of the fractal part of the spectrum (Fig. 8a), are considered known, then we should be able to estimate the fractal dimension if we can obtain an estimate of small-scale roughness. This will provide a point on the fractal portion of the spectrum at higher wavenumbers, and therefore determine the gradient of the spectrum. We use a measure of small-scale roughness defined by the rms height calculated from a 1 km high-pass filter of the data profiles. The filter value of 1 km for this step was chosen to highlight features with scales that are thought to be most critical for glacier modeling (Reference Durand, Gagliardini, Favier, Zwinger and LeMeurDurand and others, 2011). We refer to this value as H 1, and in Section 5.2 we establish a new method for estimating D from this measurement.
5.1.6. Parameter grids
Parameter grids (Fig. 2), which define how we statistically characterize the field over the region of interest, and which provide the inputs for the unconditional simulation algorithm, are generated using the following steps:
1. A grid is designed for each parameter and, initially, for each province (six grids in all). The cell size (250 m) and easting and northing boundaries are the same as the deterministic grid and eventual simulation grid.
2. Parameter values estimated from the above procedures are placed in the gridcells in which they are located, averaging values that fall within a single cell. For λ 0, the inverted value is assigned to every data location within the profile section used for inversion.
3. A cosine taper filter is applied to the grid, both to smooth out inconsistencies between x –oriented and y –oriented profiles, and to fill in gaps between the track lines. A 50 km filter is used for H 50 and H 1, and a 100 km filter is used for λ 0.
4. Lowland and highland masks are applied to the parameter grids for each province, and the two are then merged into a single grid for each parameter.
Parameter grids for H 50, λ 0 and H 1 over the Thwaites Glacier bed data region are shown in Figure 9a, b and c, respectively; the impact of provincing on the parameter estimations is clearly evident, in that parameter estimates change abruptly at province boundaries. These grids form the basis for unconditional simulation described in Section 5.2. Although we are replacing D with H 1 for characterizing small-scale roughness, D will still need to be determined in order to simulate a surface using the von Kármán model. This issue is addressed in the following subsection.

Fig. 9. Estimation of (a) H 50, (b)λ 0 and (c) H 1 over the simulation region.
5.2. Unconditional simulation and iterative determination of fractal dimension
5.2.1. Convolution algorithm for unconditional simulation
The Fourier transform-based algorithm for generating an unconditional simulation is conceptually straightforward (Reference Goff and JordanGoff and Jordan, 1988, Reference Goff and Jordan1989a; Reference Pardo-Igúzquiza and Chica-OlmoPardo-Igúzquiza and Chica-Olmo, 1993): an amplitude spectrum model is multiplied by a random phase spectrum uniformly distributed on [0,2π), and then a fast Fourier inverse transform is applied. This yields a random, Gaussian-distributed surface corresponding to the modeled spectral properties. This method is not suitable, however, in circumstances where the statistical properties are heterogeneous, because only one spectrum representation is used to generate the surface. Reference Goff and ArbicGoff and Arbic (2010) resolved this issue by performing the equivalent operation in the space domain; i.e. they convolve a filter, which is the Fourier transformation of the amplitude spectrum, with a Gaussian-distributed white noise of unit variance. Although computationally inefficient, this simple algorithm allows us to specify model parameters as a function of location on the simulation grid. There are no limits on the degree of heterogeneity within the grid, and continuity is assured by using the same random noise field for every convolution computation.
5.2.2. Iterative algorithm for estimation of fractal dimension
We now seek to adjust the value of the fractal dimension such that the small-scale roughness (H 1) of the unconditional simulation matches that of the observed field (Fig. 9c). This is a critical step to ensure that our simulated basal topography provides realistic boundary conditions for glacier flow simulations. To do so, we have developed the following new iterative algorithm (Fig. 2):
1. Generate an unconditional simulation, Z i U (x), using values for H 50(x) and λ 0(x) displayed in Figure 9a and b, respectively, and a fractal dimension Di (x), where i refers to the iteration number. For the first iteration, D 1(x) is set to be a constant of 2.2
2. Perform a 1 km high-pass filter on Zi U (x), and compute the rms height over 1 km × 1 km. areas about each gridpoint to estimate the small-scale roughness. Filter in the same manner as the data-based estimates (50 km cosine filter) for consistency; this grid is identified as Hi 1U (x)
3. Compute the difference grid ΔHi 1 (x) = Hi 1U (x) – H 1 (x)
4. Use ΔHi 1 (x) to make adjustments to the fractal dimension grid. Where ΔHi 1 (x) is positive, the unconditional simulation is too rough at small scales, and the fractal dimension needs to be reduced. The opposite is true where ΔHi 1 (x) is negative. Because this is an iterative procedure, the form this adjustment takes does not need to be precise; it just needs to move the fractal dimension in the correct direction, but not too far, so that the iteration converges. Through trial-and-error experimentation, we have found the following formulation works robustly:
(2)
The two terms in the adjustment work in different ways: the first term does better when the difference is positive and the fractal dimension needs to be adjusted downward, whereas the second, normalized term works better when the difference is negative and the fractal dimension needs to be increased. Values are also constrained to be larger than 2 and less than 3. Application to other fields will require adjustment of the scalar on the first adjustment term (set to 0.004 in Eqn (2)). A good rule of thumb is that an adjustment to the fractal dimension for any iteration should not exceed ~0.1–~0.2. The scalar can therefore be adjusted based on the maximum value of H 1 1 (x)
5. Update the iteration and return to step 1.
Figure 10a–c display the results of this procedure after the first iteration. A constant fractal dimension of 2.2 is used (Fig. 10a), leading to the unconditional simulation shown in Figure 10b. The difference in small-scale roughness, H 1 1 (x) is displayed in Figure 10c. We seek to have a difference map that is close to 0, so the considerable structure evident in the difference map means that the unconditional simulation is doing a poor job of emulating the observed regional variations in small-scale roughness. However, after four iterations of the adjustment algorithm, the picture has changed significantly (Fig. 10d–f). The fractal dimension grid (Fig. 10d) now displays considerable structure, whereas the difference in small-scale roughness, H 4 1 (x), is nearly uniform at a value of 0 (Fig. 10f). Thus, the unconditional simulation for this iteration (Fig. 10e) does an excellent job of matching the observed small-scale roughness in addition to satisfying the large-scale structure specified by H 50(x) and λ 0(x). This unconditional simulation therefore represents a satisfactory input for the conditional simulation algorithm.


Fig. 10. (a) Fractal dimension assumed for unconditional simulation of first iteration in fractal dimension estimation algorithm: a uniform value of 2.2. (b) Unconditional simulation for first iteration. (c) Difference in small-scale roughness, H 1 1 x ð Þ, between unconditional simulation and observations at first iteration. (d) Fractal dimension determined after third iteration of fractal dimension estimation algorithm, and used for fourth iteration of unconditional simulation in (e). (f) Difference in small-scale roughness, H 4 1 x ð Þ, between unconditional simulation and observations at fourth iteration.
6. Conditional Simulation
Our final procedure for the conditional simulation is to ‘drape’ the unconditional simulation of Figure 10e atop the deterministic surface shown in Figure 5b (Fig. 2). We use the algorithm outlined in Section 3, and the result is displayed in Figure 11. The conditional simulation looks realistic in comparison to the ‘conventional’ smooth interpolation (Fig. 5), but, more importantly, matches the statistical characteristics derived from the data (Fig. 9) and does not alter any of the data values. Yet, unlike the interpolation surface (Fig. 5), the data track lines are not discernible in the image. This indicates a successful merging of deterministic and stochastic components of the surface.
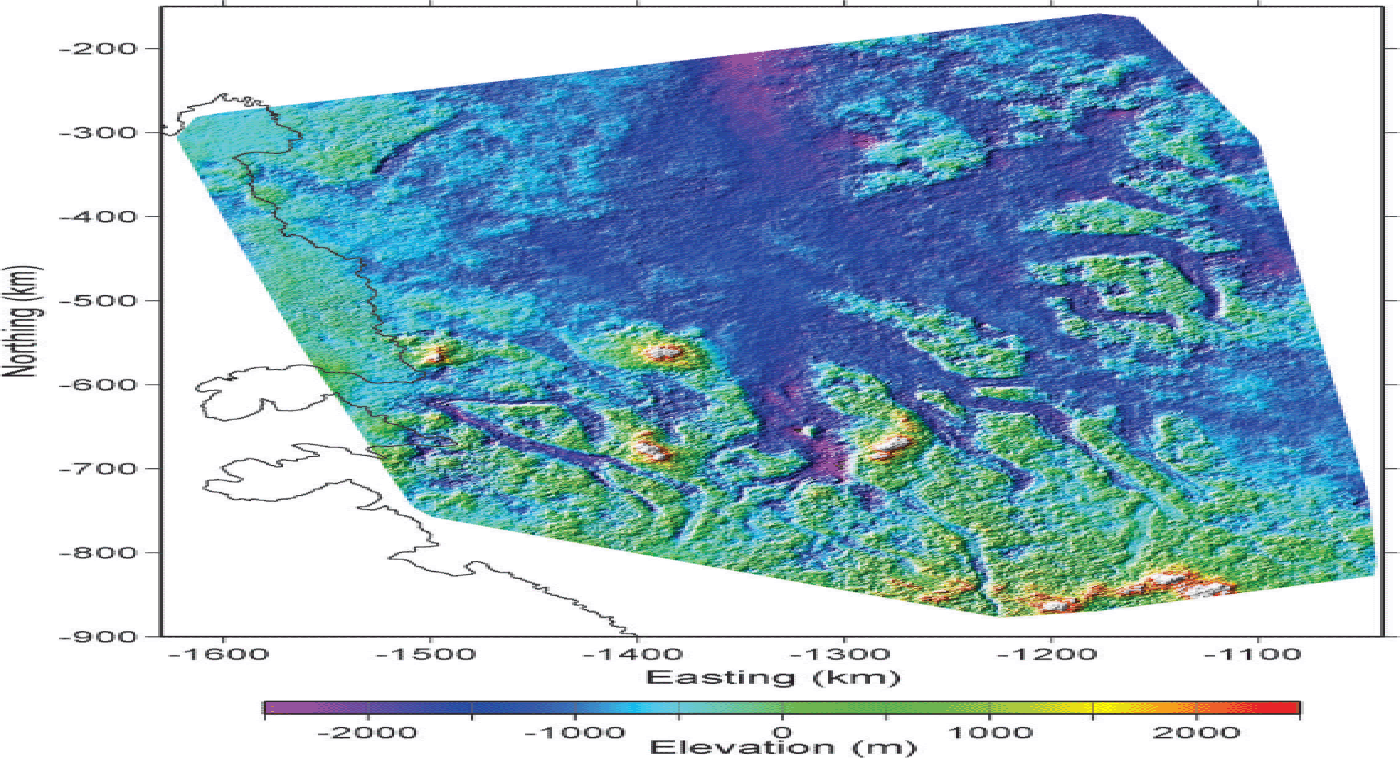
Fig. 11. Conditional simulation formed by merging the deterministic surface of Figure 5b with the unconditional simulation of Figure 10e. The solid line indicates the grounding line derived from Reference BindschadlerBindschadler and others (2011). Regions to the left of this curve are presumed to be floating glacier base rather than basal topography.
We also plot in Figure 11 the location of the ice-sheet grounding line determined from image analysis (Reference BindschadlerBindschadler and others, 2011). The basal topography to the left of this line is therefore likely to be representative of the underside of floating ice rather than bedrock topography. In any modeling application of this simulation such regions must be masked, but for our purposes this provides instructive observations. Comparison with Figure 10d indicates some very high fractal dimensions in the presumed ice shelf at the Thwaites Glacier outlet, indicating an abnormally high ratio of small-scale roughness to large-scale roughness in comparison to the rest of the field. Some of this type of topography can also be observed in the leftmost 50 km of the profile in Figure 4a. The high fractal dimensions estimated for this region are likely a natural consequence of the highly crevassed, floating ice in this region, leading to high roughness at short scales and comparatively little roughness at large scales beneath the ice shelf.
7. Conclusions And Discussion
We have demonstrated a methodology for generating a conditional simulation applied to the bed of Thwaites Glacier, combining established techniques with new methods for provincing the data in order to estimate statistical parameters, and using small-scale roughness in an iterative technique to estimate the fractal dimension. The resulting surface emulates the highly heterogeneous statistical properties of the data at both large and small scales, maintains continuity of interpreted channel forms and does not alter the conditions imposed by the data values. The methodology is not specific to the bed of Thwaites Glacier; it will be useful for any surface that is strongly heterogeneous in its statistical characteristics, whether channeled or not.
The conditional simulation provides a more realistic basis for conducting numerical modeling experiments of glacier flow than does a straightforward interpolation of the data: it has the correct ‘texture’ at small scales, which will help determine basal drag, and it has continuous channels that can guide ice streams. These are justification enough for the effort involved. However, the conditional simulation can also be used to examine uncertainty in ice flow models by generating a suite of such simulations that effectively sample the probability space for the field. This can be accomplished, in part, by generating multiple independent realizations of the unconditional simulation, which can be used to determine the importance of the details of the small-scale features in the topography. We can also investigate variations to the statistical characterization parameters within the bounds of their error limits, which will allow us to test the importance of the specific statistical model properties of the topography in controlling glacier flow. Additionally, the importance of channelized bed morphology on glacier flow can be investigated by running flow computations both with and without channel interpolation.
A fully realized simulation of this sort can also be used to test the sensitivity of glacier flow models on data-sampling geometry. Such an experiment would proceed by first assuming the conditional simulation represented ‘reality’ and that the modeled flow over this surface was the true flow. The surface could be sampled at a range of geometries (e.g. different track line spacings), and these ‘synthetic data’ would then be interpolated in any desired manner (including conditional simulation). Flow models could then run on the interpolated surface for comparison with the ‘true’ flow.
Acknowledgements
We thank the following for helpful discussion and interactions: Charles Jackson, Joe McGregor, Dustin Schroeder, Chad Greene and Gail Gutowski of the University of Texas Institute for Geophysics (UTIG), and Christina Hulbe and Scott Waibel of Portland State University. This work was supported by NASA grant NNX11AH89G and US National Science Foundation grant No. 0941678. This is UTIG contribution No. 2707.


