

Introduction
Since it was first recognized that glaciers move down their valleys under the influence of gravity, many attempts have been made to explain the mechanism of this flow. The mass of ice in a glacier is almost completely crystalline and viscous flow formulae cannot be used, at least not without modification. Knowledge of how an individual crystal deforms and its interaction with the surrounding crystals with different orientations can be developed from crystal fabric studies of both glacier ice and ice deformed in the laboratory; both offer promising methods of attack on some of these still troublesome problems. The fabric of a crystalline mass is found by the statistical study of the orientation of the individual crystals and their relationship to each other.
Glacier ice, being a true metamorphic rock, lends itself readily to study by the methods of structural petrology, and universal stage techniques for measuring the orientation of the optic axes are easily applied to this uniaxial mineral. Strong preferred orientation of the optic axes (crystallographic c-axes) of glacier ice is usually found, and questions are raised as to the mechanics of orientation and ice flow.
Fabric studies were made in the ablation zone of three widely separated temperate glaciers and two polar glaciers. The research began on Emmons Glacier, Mount Rainier, Washington, during the summer of 1950Reference Rigsby 1 and was continued during the summer of 1951 on the Malaspina Glacier, St. Elias Range, Alaska, and during the summer of 1952 on the Saskatchewan Glacier of the Columbia Ice Field, Banff National Park, Alberta, Canada.Reference Meier, Rigsby and Sharp 2 The Emmons and Saskatchewan Glaciers are typical valley glaciers and the Malaspina is a type specimen of a piedmont ice sheet. Investigations were begun on polar glaciers in 1954. on the Moltke Glacier and the Nunatarssuak Ice Ramp near Thule, Greenland, and were completed in 1955 as ice specimens were collected and studied from the tunnel in the Tuto Ice Ramp near Thule, Greenland. A total of more than 8,000 crystals were measured during this investigation.
The author started laboratory work on deformation and recrystallization of ice in the fall of 1953 at the Snow, Ice and Permafrost Research Establishment of the Corps of Engineers, U.S. Army, Wilmette, Illinois, with the deformation of single crystals. Later the investigations included bending single crystals and deformation of polycrystalline specimens of glacier ice and concluded with recrystallization studies of both laboratory deformed and glacier-deformed specimens of ice. The laboratory work was completed during the summer of 1956.
Structural and Crystal Relations in Glaciers
It is well known that the ice at the center of the surface of a valley glacier moves at a higher velocity than the ice near the sides, and it is quite certain that, similarly, the ice on the top moves faster than that at the bottom.Reference Gerrard, Perutz and Roch 3 The greatest differential per unit distance, and therefore the largest shear couple, is found near the sides of the glacier where the ice is “held” by the rock walls.Reference Meier 4 The strongest fabric (a more perfect alignment of axes) is also found here.
Glacier ice commonly shows a regular planar structure, usually consisting of alternate layers of relatively clear and bubbly ice, frequently
Methods and Equipment Used
Universal stage. A large, three-axis universal stage, machined out of brass and aluminium, was mounted to rotate between two 6-inch (15.2 cm.) polaroids. In the field, a cover plate of
Thin sections. Slabs of ice of known orientation and measuring about
Plotting of data. Fabric diagrams were made by plotting the optic axes on the lower hemisphere of a Schmidt equal-area projection in the conventional manner and were oriented so that they represented horizontal sections with north at the top. Although some thin sections were made from vertically cut slabs because of greater ease and accuracy in cutting, the diagrams have all been rotated to show the fabric in a horizontal plane. In studies of metamorphic rock fabrics, the optic axes of 400–500 quartz grains are frequently plotted on one diagram. Experience indicates that, in most cases, the fabrics in glaciers are so strong that 100 grains will easily reveal the pattern at any one location. One hundred or more grains were measured at each location on the Emmons Glacier, except where extremely large crystals required numerous sections. On the Malaspina, Saskatchewan, and the polar glaciers a minimum of 200 crystals per location was possible because the grains were smaller, allowing more measurements per thin section.
The Temperate Glaciers
Emmons Glacier. Fabric diagrams, made by plotting the orientation of optic axes of ice from eleven locations on Emmons Glacier, Mount Rainier, Washington, are shown and located in Figure 1 (also published in Reference Rigsbyreference 1). Each diagram is made in the horizontal plane, and all are oriented in accordance with the map, north at the top. Density concentrations as high as 26 per cent in 1 per cent of the area of the Schmidt net were recorded, and many of the diagrams have four strong maxima at the corners of a diamond-shaped quadrangle. When the poles to the foliation and debris layers were plotted on the fabric diagrams, they fell, for the most part, near the centers of the diamonds formed by the four maxima. Early in the investigation it was thought that this might indicate the possibility of other glide planes in ice; however, subsequent laboratory experiments indicate no such planes. Also patterns obtained after recrystallization of the deformed specimens show a tendency toward several maxima.

Fig. 1. Fabric diagrams and outline map of Emmons Glacier, Mount Rainier, Washington, showing locations where thin sections were taken.
Malaspina Glacier. The fan-shaped Malaspina Glacier lies on the southern Alaskan coastal plain at the base of the St. Elias Range and is one of the largest piedmont glaciers in North America. It is a sheet of ice, about 25 miles (40 km.) across in its narrowest direction, which covers about 850 square miles (2,200 km.2). It is fed primarily by the Seward GIacier draining from a great intermontane basin in the heart of the St. Elias Range which is enclosed by a series of lofty peaks and ridges including Mounts Vancouver, Cook, Augusta, St. Elias and Logan. The surface of the Malaspina varies in elevation from about 2,500 ft. (760 m.) at the Seward outlet, the point where the Seward Glacier empties into the Malaspina, to almost sea level near the southern edge.
Figure 2 shows the location of the camp and crystal studies stations. Seismic and gravity exploration was carried out by C. R. Allen and G. I. SmithReference Allen and Smith 6 and the ice was found to be approximately 2,000 ft. (600 m.) thick at the glacier camp near the center of the glacier. Southward for a few miles the ice remained about the same thickness, but nearer the edge the ice became thinner and the subglacial floor rose in a gentle slope from about 600 ft. (180 m.) below sea level to approximately sea level at the outer edge of the glacier. The ice also became somewhat thinner toward the Seward outlet; however, no seismic reflection shots were taken further than about 5 miles (8 km.) north of camp.

Fig. 2. Fabric diagrams and outline map of Malaspina Glacier, Alaska, showing locations where thin sections were taken
The foliation in Malaspina Glacier is extremely regular and well developed. Near the glacier camp it had an average strike of about N. 70° E. and dipped 68°–78° NNW. The dip became somewhat less toward the outer margin of the glacier, measuring 53° N. 6 miles (9.6 km.) south of camp and 40° N. 9 miles (14.4 km.) south-east of the camp. In the areas visited by the author, the foliation strike was approximately at right angles to a line drawn from any point on the margin of the Malaspina to the Seward outlet. This probably holds only for that part of the glacier fed by the Seward Glacier. These lines, giving a fan-shaped arrangement, are along the supposed flow direction. The more gentle dip of the foliation outward toward the margin indicates that it becomes shallower with depth until finally it becomes parallel to the floor near the bottom of the glacier as has been seen on valley glaciers. Tensional cracks (crevasses) observed fanning outward from the ice outlet and striking about 90° to the foliation, are probably caused by spreading of the ice piedmont.
Near the margin of the Malaspina many sharp folds in the ice are outlined by streaks of debris and dirty layers of ice, but the foliation cuts through these folds apparently parallel to their axial planes. The folds extend on toward the center of the glacier but are less apparent because of the lack of debris.
One such fold, which could best be seen from the air, lay about 2,000 ft. (600 m.) north of camp (Fig. 3, p. 597) . This fold, its axis striking between N. 65° E. and N. 70° E., showed on the surface as dirty bands, usually several tens of feet wide, alternating with bands of clean, somewhat hummocky, ice. Because the folded structure was expressed only by a thin superficial accumulation of silt and dirt, no information as to plunge or dips on the flanks could be obtained. This superficial accumulation is probably a residual concentration resulting from hundreds of feet of ablation; the ice below the surface appeared to be just as clean and free from debris as the ice beneath the dirt-free bands. Foliation in the ice did not change direction with the bands around the nose of the fold but passed through parallel to the line formed by the intersection of its axial plane and the glacier surface. The contact between the dirty ice and the clean ice around the nose of the fold was disturbed by many small offsets, all of which were parallel to the foliation, and in this sense the structure resembled shear folding.Reference Billings 7

Fig. 3. Fold near center of Malaspina Glacier as viewed from the air looking east-north-east. Expression of foliation can be seen in the linear features parallel the fold axis. Features normal to fold axis are crevasses. Photograph taken only about 400 ft (120 m.) above surface
Fabric diagrams from seven locations on Malaspina Glacier are shown with the foliation in Figure 2. Orientation of the c-axis in 200 to 250 crystals was measured at each location. These diagrams are also oriented horizontally with north at the top. Three to four maxima can be noted, but the pole to the foliation plane appears to be consistently closer to one of the maxima rather than near the middle of the pattern as seemed to be the case in the Emmons diagrams (see Fig. 1, opposite p. 598).
Two of the diagrams came from locations on opposite flanks and one on the nose of the fold near the glacier camp. It is clear that these diagrams, which are plotted in Figure 4 with the map of the fold, are more closely related to orientation of the foliation plane than to the orientation of the limbs of the fold. It will be noted that there is almost no difference in these three fabric patterns. Figure 2 shows the close similarity of all the Malaspina diagrams.

Fig. 4. Relation of diagrams to fold in Malaspina Glacier
The conclusion drawn is that the foliation in the Malaspina Glacier is caused by shearing movements along closely spaced planes in response to stresses developed in the ice moving outward from the source at the Seward outlet, and the relative movement between adjacent planes might be responsible for the folded appearance of the debris layering in the glacier.
Saskatchewan Glacier. During the summer of 1952 fabric studies were undertaken on the Saskatchewan Glacier in Banff National Park, Alberta. C. R. Allen made seismic soundings of the glacier and found the ice to be approximately 1,400 ft. (426 m.) thick about 5 miles (8 km.) up the glacier, with gradual thinning toward the snout. M. F. Meier made surveys and surface velocity measurements along with structural studies.Reference Meier, Rigsby and Sharp 8 , Reference Meier 9 He found the surface ice to be moving about one foot (30 cm.) a day near the center about 5 miles above the terminus. The daily movement was progressively less near the sides and toward the terminus. His measurements show the greatest differential movement per unit distance near the sides indicating again that the largest shearing stresses are near the sides.
Fabric diagrams from the eight locations on the Saskatchewan Glacier are shown in Figure 5 (also published in Reference Meier, Rigsby and Sharpreference 2). The Saskatchewan diagrams do not show preferred orientations as strong as those demonstrated in the Emmons and Malaspina glaciers, but there are two possible explanations worth mentioning here.

Fig. 5. Fabric diagrams and outline map of Saskatchewan Glacier, Alberta, Canada, showing location where thin sections were taken.
ReidReference Reid 10 postulates flow lines in glaciers which indicate that the deepest ice in the glacier originates nearest the head and that the ice at the surface just below the firn limit, has accumulated just above the firn limit and has always been near the surface. Furthermore, being in the center, it has never been subjected to strong shearing stresses; this may account for its lack of preferred optical orientation.
Two of the diagrams made near the snout (Locations 1 and 2) show the usual orientation of several maxima clustered about the pole of the foliation plane. Presumably the ice at the snout was buried deeply and subjected to much stronger shearing stresses. The remaining diagrams do not show preferred orientations as strong as those demonstrated on the first two glaciers, but possibly this can be explained by more complicated activity as evidenced on the surface by much small scale folding and faulting of the foliation. It appears that the stronger patterns are in the more extensively metamorphosed and presumably older ice. The foliation of this glacier also displayed much more granulation in certain layers than was found in either the Emmons or Malaspina Glaciers.
The Polar Glaciers
As few or no fabric data had been collected from polar glaciers, it was recognized that to be complete, data should be obtained from ice which has flowed at temperatures below the freezing point. This seemed especially true as laboratory deformational studies were all being conducted at below freezing temperatures owing to the pressure melting problems involved right at the melting point. An opportunity to collect such data came during the summer of 1954 when the Snow, Ice and Permafrost Research Establishment sent several field parties to the Thule area in Greenland for ice, snow, and glaciological studies.Reference Rigsby 11
The Nuna Ramp in the Nunatarssuak area, Greenland (Figs. 6 and Fig. 7), about 50 miles (80 km.) north-east of Thule, is a gradual incline to the ice sheet and was chosen for this research because there is very little crevassing, indicating simpler flow conditions within the ice. It was hoped that the strike and dip of the foliation would be easy to obtain at each location established for fabric study, but in many cases it was difficult to find, especially some distance away from land where only small shearing forces are set up.
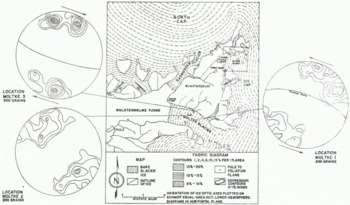
Fig. 6. Map and fabric diagrams, Moltke Glacier, Greenland. Nunatarssuak area (in box) is shown on a larger scale in Fig. 7

Fig. 7. Map and fabric diagrams, Nunn Ramp, Nunatarsmak area, Greenland
Three locations for study were also established on the Moltke Glacier using a helicopter and are shown in Figure 6. Two of these were near the sides in strong shear zones, and one in the center, all along a profile about 4 miles (6 km.) above the terminus.
The fabric diagrams obtained from 11 stations on the Nuna Ice Ramp can be seen in Figure 7. At Location 1, the density of the points which represent the optic axes in the single maximum, exceeds 30 per cent in 1 per cent of the area of the projection net. This station was only 875 ft. (270 m.) from the edge of the glacier in an area of well-developed foliation and undoubtedly in a zone which had been subjected to high shear stress. Deduced from the direction of movement, foliation, and other megascopic features, this ice would have come from near the bottom of the glacier. The c-axis in almost every crystal is essentially normal to the foliation plane, which makes the glide planes in the ice crystals almost parallel to the foliation plane. The grain size was small with approximately 200 crystals in one round thin section 3 in. (7.6 cm.) in diameter.
The further one progresses from the ice edge, the weaker the pattern becomes. This can be followed in the diagrams in the following sequence: Location 2, 0.5 miles (0.8 km.) from edge of the ice; Location 3, 0.9 miles (1.5 km.); Location 4, 1.3 miles (2 km.) ; Location 5, 1.6 miles (2.6 km.) ; Location 6, 2.3 miles (3.7 km.) ; Location 7, 3 miles (4.8 km.) ; and Location 8, 4 miles (6.4 km.) from ice edge. The pattern gets progressively weaker until Location 7 is reached, where the orientation appears to be random. The surface ice at this station, only about 0.5 miles below the firn line, probably has never been deeply buried or subjected to strong shear stresses. Location 8 was above the firn line and also has random orientation of crystals, but this was clearly superimposed ice caused by melt water from the last winter’s snow refreezing on the cold ice surface below the snow.
During the early part of the summer, superimposed ice was found at Location 6. This was the result of an increase in slope for a short distance, which gave more protection from the sun during part of the day. The orientation of this ‘superimposed ice (shown as Location 6a) is random as at Location 8. The deeper coarse-grained glacier ice at Location 6 was taken in August after the superimposed ice had melted away.
The ice at Location 11 was taken only 600 ft. (180 m.) south of the edge of First Nunatak in a strongly foliated area. The pattern shows the same strongly oriented crystals as in other areas of higher shear stress.
At Locations 1 through 6, the shear couple imposed on the ice in the later stages of deformation (deduced from foliation, direction of flow, and location) was probably one in which the ice to the east was being thrust over the ice to the west. The ice at Location t t was undoubtedly subjected to a shear couple such that the north side was held by the nunatak while the south side moved in a westerly direction.
The ice of the Nuna Ramp flows in a westerly direction into a north-south valley 500 to 600 ft. (150–180 m.) deep along the western side of the ramp. The ice then flows both up-valley to the north and down-valley to the south for a short distance. Two locations were established on the northward-flowing part of the glacier about
The fabric of the Moltke Glacier also tends towards several maxima (Fig. 6). The reason for several maxima clustered about the pole to the foliation, but not coincident with it, is not known but may be a recrystallization phenomenon. The shear couple imposed on the two locations nearest the sides of the Moltke Glacier was such that the ice toward the center moved more rapidly toward the ocean, while the rock sides tended to hold the ice at its edges. This couple is shown in Figures 6 and 7.
In 1955 a tunnel was driven about 500 ft. (150 m.) into the ice sheet near the TUTO Ramp about 13 miles (20 km.) from Thule, Greenland. The end of the tunnel was about 170 ft. (52 m.) below the surface and cores were taken at regular intervals along the sides and from the bottom. In the back part of the tunnel very strong fabrics were encountered. The strongest pattern yet found by the author was from one section of a three-inch core taken 485 ft. (150 m.) back into the tunnel. This section contained 325 crystals with a single maximum; 39 per cent of the axes were in 1 per cent of the areas of the diagram (Fig. 8). Almost 100 per cent of the axes were in about 10 per cent of the area. The center of this maximum was almost exactly perpendicular to the foliation plane which shows that the basal glide planes of each crystal were parallel to the foliation (the most divergent being no more than about 25° to 30°).

Fig. 8. Fabric diagram of Tuto Tunnel ice showing concentrations of optic axes up to 39 per cent in 1 per cent of the area. Diagram also shows that the pole to the foliation plane coincides very closely with the maximum concentration of optic axes. Thin section of this ice is shown in Fig. 16 (p. 600)
On the Moltke Glacier, in particular, it was observed in several instances that the crystals near the surface, which at that time of the year were at the melting temperature, were considerably larger than those only 2 or 3 ft. (0.6–0.9 m.) deeper in the glacier, where the ice was still below freezing or had risen to the melting point only very recently. This was especially noticeable in the almost bubble-free layers of the foliation. It appears that recrystallization of small grains into larger crystals (up to 7 cm. across) occurs very rapidly in the clear ice areas when the temperature reaches the melting point, perhaps in only a few weeks or months, which coincides with laboratory findings. The bubbles apparently inhibit the growth of crystals even at the melting temperature. Figure 9 (p. 598) is a picture of a thin section from Moltke Glacier Location 1 between crossed polaroid sheets, and illustrates the difference in grain size in the bubbly and bubble-free folia in the ice. The bubbles can be seen in the fine-grained region even between crossed polaroids. This section was taken within 6 in. (15 cm.) of the surface. Deeper in the ice the grain size was small and more uniform, similar to the fine-grained portion of Figure 9. Why the bubbly layers do not recrystallize as rapidly remains a mystery, but perhaps the many small bubbles interfere with the migration of crystal boundaries, or possibly the strains are relieved readily by migrating to a bubble-ice boundary so that there is no need to recrystallize. In general, the ice in the active shear zones was less than 1 cm. in diameter and even smaller in the most active areas. Grain growth apparently is extremely slow in ice several degrees below the freezing point.

Fig. 9. Thin section of ice between crossed polaroids from near surface of Moltke Glacier, Greenland. Note difference in grain size between the clear and bubbly laminae
Laboratory Ice Deformation
Single crystals. Experimental laboratory work on the deformation of single ice crystals was started in the fall of 1953 at the Snow, Ice and Permafrost Research Establishment. Apparatus was built to deform the crystals in a shear couple type of stress environment, keeping constant the distance between the sides which transmit the force. The ice-metal contact was saw-toothed in order to prevent slippage and the crystal frozen to the mount with a few drops of ice water. Thick glass was placed on each side of the ice in order to see and photograph what was happening to the crystal. The specimens in this experiment measured
When rectangular pieces of ice were used, the ice began to bend and pull away from the saw-toothed sides after only a small amount of deformation. This difficulty was mostly eliminated by cutting the crystals in the shape of a parallelogram having angles of 60° and 120° and deforming them in the direction which tends to make rectangles of the original parallelogratns.Reference Rigsby 12
The force for deforming the ice was transmitted to the mount by means of wire and weights. The amount of deformation was measured by a linear displacement potentiometer which activated a Brown recording potentiometer to give a chart of deformation versus time.
Uneven distribution of gliding, i.e. more movement on some glide planes than on others, always occurred and gave a final steplike appearance.Reference Rigsby 13 Sometimes most of the differential movement seemed to occur on only 3 or 4 planes while other specimens showed a much more even distribution of the active planes. It is believed that this variation in active planes from sample to sample caused the wide variations in shear strain rate. Some of these problems have already been discussed in a previous publication.Reference Rigsby 14
In the most favorable orientation for deformation where the glide planes were parallel to the direction of shear, stresses as low as 200 g./cm.2 gave shear strain rates of 2.35×10⁻⁶ sec.−1. Stresses of 2,000 g./cm.2 gave shear strain rates which varied between 1.2×10⁻⁴ and 8.7×10⁻⁵ sec.−1 and 3,300 g./cm.2 gave rates up to 1.8×10⁻⁴ sec.−1.
Ice crystals could be deformed plastically only by gliding on the basal plane and by bending in such a way that differential movement could be made along the glide planes, similar to bending a stack of papers. The bent crystals rapidly recrystallized in the sharpest part of the bend when the temperature was brought near the melting point (Fig. 15 p. 599).
Polycrystalline specimens. Apparatus built to deform polycrystalline specimens by a shearing couple similar to that used on the single crystals was designed (Fig. 10, p. 598) to keep a constant volume during deformation, and took a piece of ice 4 in. square by

Fig. 10. Deformation apparatus with polaroid sheets attached to back and front of glass. ice section 4×4 in. (10.2×10.2 cm) originally made up from
Three experiments were completed using an ice specimen made up of sixteen

Fig. 11. Thin section of a specimen after deformation in apparatus shown in Fig. 10.
The first specimen deformed in this way was photographed after completion of the deformation, then placed in a constant temperature kerosene bath at −0.3° C. In three days it was photographed again and many changes in the position of the crystal boundaries could be seen (Fig. 12, p. 597). Crystal growth after annealing at −0.3° C. for 3 days can be seen in the lower right-hand corner of Figure 12 and along the right-hand side near the upper corner. The left photograph was taken before annealing and the right one after annealing.

Fig. 12. Illustration of recrystallization after deformation. Photograph on left shows block as it was taken from apparatus (after polishing surface). Right-hand photograph shows same block after three days in kerosene bath at −0.3° C. Compare especially lower right-hand corner and right edge near upper right-hand corner for obvious boundary changes
The next experiments on polycrystalline ice were done using a fine-grained “snow ice” which, for all practical purposes, had random orientation of the c-axes. Snow was sifted into a container, which was then filled with water at freezing temperature and frozen into ice. The ice crystals took on the original random orientation of the snow. A smaller apparatus was built which took specimens (before deformation)
As the pattern proved to be weak with just one movement as far as the apparatus allowed, it was decided to shear it back and forth along the same plane by reversing the shearing couple. After 6 or 7 reversals the specimen was taken out and a thin section made. The 2×2 inch thin section (Fig. 13, p. 599) contained 346 crystals which by this time showed quite strong preferred orientation of the c-axes. Here two maxima were found, one perpendicular to each of the two shear directions in the specimen (approximately 90° to each other). This was the first strong fabric found by the writer in laboratory deformed ice. The two pictures in Figure 13 were taken of the same slide but with one rotated about 45° to the other in order to show the preferred orientation. Figure 14 shows the fabric diagram from this thin section.

Fig. 13. Thin section of laboratory deformed specimen of originally randomly oriented fine-grained ice. 45-rotation of stage with crossed polaroids illustrates preferred orientation of the crystals after deformation. Left photograph—minimum number of grains at extinction, right photograph—maximum number al extinction

Fig. 14. Fabric diagram of thin section in Figure 13
Recrystallization. As mentioned above, recrystallization of ice deformed in the laboratory occurred rapidly when the temperature was raised to the melting point or very near it. In bent crystals recrystallization progressed most rapidly at the sharpest part of the bend where the lattice had been strained the most and where one would expect to find the greatest internal stress on the crystal structure (Fig. 15, p. 599). One might say the atoms have been somewhat displaced from their regular locations and are in uncomfortable positions in the deformed crystals and recrystallization proceeds rapidly at higher temperatures in order to allow them to move into their proper relations to one another. Recrystallization after deformation is much retarded at lower temperatures and is extremely slow below about −5° C. Below about −10° C. recrystallization appears almost to have stopped.

Fig. 15. Recrystallization in two bent single crystals. Note recrystallization starting in sharpest part of lower bend in left-hand photograph. Right-hand photograph shows almost complete recrystallization (white area) of original single crystal. Recrystallization of these two specimens occurred at —5° C.
The ice from the tunnel in the ice sheet near Thule, Greenland, showed extremely strong fabric, the highest the author has found. A two-inch (5.1 cm.) length of the core, taken adjacent to the thin section showing the strongest pattern was “annealed” by placing it in a sealed jar, which in turn was placed in an ice-water mixture for over a month. The ice-water mixture was in a large vacuum flask in a box which was maintained between 0° C. and 0.5° C., and every week the ice-water was examined and more ice added if necessary.
In addition to an analysis of the thin section from the end of this core section, it was also examined by slightly etching the surface and the same fine-grained structure found in the thin section was seen throughout. After annealing this section of core for over a month, the specimen was removed and another thin section made. Sixteen large crystals now made up the entire section instead of over 300 as found before annealing. These sixteen crystals were oriented on the universal stage, but there were too few to reveal any kind of fabric pattern. The spread was much greater than even the most divergent of the crystal axes found in the original section from the same core of tunnel ice. The two upper photographs in Figure 16 (p. 600) show the thin section (in two positions about 45° apart) which gave the fabric diagram in Figure 8. The two lower photographs show the thin section from the adjacent bit of core after annealing for over a month at 0° C. The two positions of this section between crossed polaroids illustrate, to some extent, the apparent randomness of the crystal orientation of the 16 crystals.

Fig. 16. Two upper photographs show thin section of TUTO Tunnel ice in two positions to illustrate preferred orientation of optic axes. Fabric diagram of this section shown in Fig. 8. Two lower photographs show mmediately adjacent thin section after annealing for about one month at 0° C. Original fine-grained structure with strong preferred orientation has changed to coarse-grained structure apparently with random orientation
Thus, it is believed that one could not expect the same type of fabric in temperate glaciers, where the ice is at the melting point most of the year, as one finds in polar glaciers where the ice is below freezing the year around. Ice would be expected to recrystallize very rapidly under melting conditions when the crystals are strained as they must be at times in flowing glaciers. Instead, considering their temperatures, perhaps it is surprising that such strong fabrics are found in temperate glaciers. There must still be some controlling factor to the pattern during recrystallization, and this factor is probably the stress environment under which the ice is constantly recrystallizing.
Glacier Flow
It is necessary to recognize at least two significant processes promoting glacier movement other than “solid flow”. One of these, sliding on the base, leaves its evidence on the bedrock beneath in the form of grooves, striations and glacial polish. The second, and probably the less important, is the actual break and slipping of one mass of ice over another, i.e. faulting. Faulting may be important only in the upper 100–150 ft. (30–50 m.) of the glacier. Probably the most important type of fault displacement which promotes downhill movement is thrusting. This is especially obvious near the terminus of most glaciers. However, faulting in the crust is merely an expression of a more fundamental type of “flow” at depth, and the subject of “solid flow” is the principal concern here.
The following observations should be kept in mind when formulating a theory of ice flow:
-
There is usually a well-marked foliation in active glacier ice which appears to be parallel to the actual direction of movement within the ice. In most glaciers the foliation is very strongly developed near the sides and bottom. Chamberlin and SalisburyReference Chamberlin and Salisbury 15 attributed foliation to shearing in moving ice. Perutz and Seligman,Reference Perutz and Seligman 16 among others, have also related it to differential movement. The conclusion is drawn that the folia are metamorphic features developed by flow in the glacier, and that in general the greater the differential movement the better developed is the foliation
-
Lattice orientations in glacier ice usually show strong preferred directions. In polar glaciers, the c-axes stand perpendicular or nearly so to the “foliation” plane. In temperate glaciers, the several directions (3 or 4) of preferred orientations may be the result of recrystallization in a nearly stress-free environment at or near the surface of the glacier. These three or four preferred orientations still show a relationship to the foliation plane, although it is difficult to ascertain just what the control is. Schwarzacher and UntersteinerReference Schwarzacher and Untersteiner 17 suggest that several maxima in the fabric of glacier ice may be due to the presence of several shear directions in the glacier.
-
Crystal size increases with temperature and time in glaciers in the inactive or stagnant state, whereas the size decreases with increasing strain rates in the more active glaciers.
-
Laboratory experiments show that deformation of polycrystalline ice tends to decrease the grain size, but melting temperatures tend rapidly to recrystallize this ice which has been deformed, into larger crystals. During deformation of laboratory specimens, large crystals have been seen to recrystallize into many smaller ones, while fine-grained deformed ice (both laboratory-deformed ice and fine-grained glacier ice) has been annealed at the melting temperature into a few large crystals with different orientations from the original pattern.
-
Ice folia containing many small bubbles recrystallize after deformation much more slowly at the melting point than clear, bubble-free areas.
-
There is some evidence that actual granulation of coarser grained ice may occur in very active glaciers, especially near the surface, thereby reducing the grain size.
-
Ice glides very easily on the basal glide plane if stress is added in the proper direction, but it is easier to bend the glide planes than to make them slip in partially unconfined single crystals as noted in several experiments. The bent crystals recrystallize very easily under the proper temperature conditions.
-
Some sections of fine-grained ice from strongly foliated regions of polar glaciers, give the over-all appearance of some elongation of crystals parallel to the direction of movement. This direction tends to be perpendicular to the crystallographic c-axes as the grains are oriented with the basal glide plane nearly parallel to the foliation. However, in temperate glaciers, crystals do not tend to be longer in one crystallographic direction than the other, as far as can be observed in thin section. Because the whole aggregate of crystals in temperate glacier ice commonly is an interlocked network, which thin sections will not reveal,Reference Bader 18 it is possible that these large irregular crystals could be generally longer in one crystallographic direction than in another.
-
No evidence of mechanical twinning is seen in the thin sections of deformed or glacier ice.
-
Strain shadows are rarely seen in thin sections of temperate glacier ice, but are frequently seen in polar glacier ice and in laboratory-deformed specimens (see Fig. 12).
-
In a temperate glacier, ice is deformed and recrystallized at the melting temperature, which gives the maximum ionic or molecular mobility.
Conclusions
Ice appears to be very sensitive to shearing forces and the fact that the glide planes are found parallel to the foliation in polar glaciers indicates that crystals under stress assume a preferred orientation in order to yield most easily to that stress. The strength of the pattern appears to be more or less proportional to the strength of the shearing forces imposed on the ice. During recrystallization the orientation patterns due to deformation may be preserved, but the patterns from temperate glaciers indicate that recrystallization under melting conditions probably tends to change the strong orientation of crystals from a single maximum with optic axes normal to the foliation plane into three or four maxima, none of which may coincide exactly with the pole to the foliation plane. Laboratory experiments indicate that preferred orientation of crystals may be lost completely when ice is recrystallized under melting conditions in a stress-free environment, but more data are needed before final conclusions are drawn. It is very likely that ice now at the surface of temperate glaciers did not recrystallize in a completely stress-free environment.
Nevertheless, it seems safe to conclude that proper orientation of the crystal in order to glide on the basal plane is very important in the “flow” of polar glacier ice, and that in temperate glaciers, gliding plus recrystallization or continual boundary migration is important to the flow.
Acknowledgements
The work on the temperate glaciers was done at the California Institute of Technology as part of the requirements for the degree of Ph.D., and the laboratory work and field work on polar glaciers was done while the writer was employed by the Snow, Ice and Permafrost Research Establishment, U.S. Army Engineers, Wilmette, Illinois. Appreciation is expressed to Dr. R. P. Sharp, the writer’s supervisor at C.I.T., and to Dr. Henri Bader, Chief Scientist at S.J.P.R.E., for their help, suggestions, and encouragement. The writer is indebted to many assistants and others in the laboratory and field and gratefully acknowledges their help. Appreciation is also expressed to Edwin C. Buffington, U.S.N.E.L., for critically reading the manuscript. The cooperation and assistance of personnel connected with Mount Rainier and Banff National Parks is gratefully acknowledged. The work on the Malaspina and Saskatchewan Glaciers was financed in part by the Arctic Institute of North America, and the Malaspina work was supported in part by the Office of Naval Research contract N60nr-244-16. Appreciation is also expressed to Dr. Waldo K. Lyon and the U.S. Navy Electronics Laboratory for allowing time and facilities for the preparation of some of the material in this paper.


