

I. Introduction
In order to study the relationships between the crystallographic orientations of adjoining crystals, measurements were made of the orientations of all three a-axes and the c-axis of each crystal in a polycrystalline ice, since measurements not only of c-axis but also of a-axis orientations are necessary for a full determination of the lattice orientation. The ice samples used had different origins: ice from the Antarctic ice sheet, ice from polar and temperate glaciers, commercial ice, and home-made ice.
For the c-axis, the measurements disclosed preferred orientation fabrics such as single-maximum, multi-maximum, and girdle fabrics. With special reference to the multi-maximum fabric, that is, the so-called “diamond pattern”, a twinning explanation was proposed for the preferred orientations on the basis of the a-axis measurements.
A number of fabrics of c-axis preferred orientations have been reported since a compre-hensive study by Rigsby (1951) on glacier ice, and such orientations and their relations with the fabrics have been subjects of major interest in ice fabric studies. Hence, experimental and theoretical work has been extensively devoted to the clarification of the mechanism of fabric formation (Kamb, 1959[a], [b], 1972; Rigsby, 1960, 1968; Brace, 1960; MacDonald, 1960; Kumazawa, 1963; Watanabe and oura, 1968; Kizaki, 1969[a], [b], 1974; Jonsson, 1970; Tanaka, 1972; Budd, 1972; Budd and Matsuda, 1974; Matsuda and others, 1976). While theoretical approaches were mainly based on the thermodynamic equilibrium of ice crystals, the fabric formation has not yet been explained well enough, probably because crystalographic orientations of a polycrystalline ice have been measured so far only for the c-axis without taking the a-axis orientation into account.
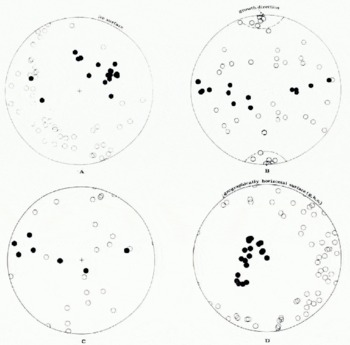
Fig. 1. Fabric diagram of orientations of both c-axes (solid symbols) and a-axes (open symbols), plotted on an equal-area Schmidt net. Polycrystalline ice samples are designated as follows. A: Thin ice made in a laboratory dish. B: Candle ice grown unilaterally from randomly oriented snow crystals in a laboratory. C: Commercial ice. D: “Byrd” station core ice in Antarctic ice sheet (1689 m depth). E: “Byrd” station core ice (2003 m depth). F: Cape Folger core ice in Antarctic ice sheet (259 m depth). G: Mendenhall Glacier ice, Alaska, collected on the surface, 2.5 km up-stream from the glacier terminus.
2. Preferred orientations of C- and a-axes
Crystallographic orientations of both the c- and a-axes were measured by a universal stage, using an etch-pit technique. The detailed procedure will be described in a paper in preparation.Footnote * Orientations of the c-axis and a-axes of all the crystals in a thin section were plotted on an equal-area projection net (Schmidt net) with solid symbols (c-axes) and open symbols (a-axes) (A, B, C, D, E, F, and G in Fig. 1).

Both a thin ice (A) made in a laboratory dish from a melt and a commercial ice (c) do not have strong preferred orientations of a- and c-axes. However, a candle ice (B) shows a girdle fabric of c-axis orientations. This candle ice was made in the laboratory from crushed small snow crystals, which were scattered on a water surface kept at the freezing temperature, and grew downward unilaterally. All the c-axes are roughly parallel to the freezing surface and one out of the three a-axes of each crystal concentrates in the growth direction (surrounded by a dashed circle). This may result from the difference of growth rates in that snow crystals with one of the three a-axes initially oriented in the growth direction grewfaster than those with three a-axes oriented obliquely.
A “Byrd” core ice (D) shows a typical single-maximum fabric in which c-axes concentrate on one small area, whereas a-axes do not. Although the ice with this fabric appears to have the polycrystalline structure closest to the structure of a single crystal of ice, it is recognized that most of the crystals are actually in very different crystallographic orientations from each other as far as the a-axis orientation is concerned. A “Byrd” core ice (E), a Cape Folger core ice (F), and a Mendenhall Glacier ice (G) show the typical multi-maximum fabric of c-axis orientations. This “diamond pattern” has been reported to exist in many glaciers and the Antarctic ice sheet as well (Kamb, 1959 [a], [b] ; Rigsby, 1960; Kizaki, 1962, 1969 [b]; Taylor, 1963; Reid, 1964 ; Higashi, 1967; Gow, 1970; jonsson, 1970; Endo, 1971 ; Budd, 1972; Hooke, 1973; Vallon and others, 1976 ; Matsuda and others, 1976, and a paper in preparationFootnote * ). It is expected from its occurrence that the ice of this fabric occupies the lower part near the bed of an accumulation area, and the major part of an ablation area. This implies that a strong pressure applied for a long time at near-melting temperature Contributes to the formation of this fabric. Ice crystals with this fabric which have the same c-axis orientations (indicated by the same symbols) have each of their a-axes (indicated by open but the same symbols as their c-axes) also nearly in the same orientations. Although all the crystals in the same c-axis orientation plotted in Figure I are apparently located separately in a two-dimensional thin section, they appear to represent the parts of a large single ice crystal connected in the third dimension.
It should be noted that, as far as the number of crystals in different crystallographic orientations is concerned, the polycrystalline ice closest to a single crystal is not that with the single-maximum c-axis fabric, but one with a multi-maximum c-axis fabric.
The multi-maximum fabric is expected to occupy the largest part of a glacier ice mass and is consequently of the greatest importance to investigate. Matsuda and others (1977) examined the crystal shape of a sample of Cape Folger core ice as a typical example of this fabric. They concluded that all crystals having the same crystallographic orientation may be interconnected outside the thin section to be a large single crystal of ice, and thus multi-maximum fabric ice is composed of a very small number of extremely large network-like ice crystals.
3. Twinning of ice
The measurement of both a- and c-axis orientation of a n ice crystal gives the full spatial lattice orientation, ma king it possible to shed light on relationships between adjoining crystals. A pair of adjoining crystals in any orientation of the hexagonal crystal system have twelve possible rotations by which the two lattices become congruent or enantiomorphous (International Union of Crystallography, 1959, p. 104). There is a relationship between the rotation angle τ, the angle γ between the c-axes of the adjoining crystals, and the angle αij related to the a-axis (shown in Figure 2) which can be derived using simple spherical trigonometry (Fig. 2):
where ![]() . The angles α
i
and α
j
must be measured so that
. The angles α
i
and α
j
must be measured so that ![]() . Thus, there can be six combinations of the value α
ij
needing to be taken into account for a given angle γ.
. Thus, there can be six combinations of the value α
ij
needing to be taken into account for a given angle γ.

Fig. 2. Crystal relationship of a adjoining crystals plotted on a Wulff net. c(c') c-axis, a(a') : a-axis, P: intersection between two basal planes of adjoining crystals, αi(αi'): angle between ai (aj') and P, T: rotation axis, τ: rotation angle, γ: angle between c and c'.
For all the measured pairs of adjoining ice crystals, the angles α i , α j ', and γ and its supplementary angle were obtained, from which the twelve rotation angles τ were calculated. After a careful inspection of the twinning law, the rotation angle closest to one of 60°, 90°, 120°, or 180° was chosen and plotted on a γ-α ij -τ diagram (Fig. 3).
The diagram shows that more than eighty percent of all the pairs of adjoining crystals have at least one of the rotation angles, 60°, 90°, 120°, and 180° with an accuracy of ± 2°, and that about a half of all the pairs have two or even three of the above rotation angles among their twelve rotation angles.
4. Angles between preferred c-axis orientations in a multi-maximum fabric
In Figure 3, the strongest concentration in γ can be seen around 40°, c. 50°, and 140°. It should be noticed that many of adjoining crystals in a multi-maximum fabric are in a very limited relation of this kind between τ and γ . Examination was then made of the data on this fabric reported in many other glaciers. Figure 4 shows the frequency of every angle between preferred c-axis orientations in this fabric. An outstanding peak can be seen when γ is between 40° and 50° (130° and 140°). A good agreement is found with the γ from the above-measured data of adjoining crystals, especially those related to each other by a 180°-rotation. This suggests that most of multi-maximum c-axis preferred orientations in each fabric may result from the same relation of a 180°-rotation between adjoining crystals. It is also suggested from this fact that the angles γ = 45° and 135° would be the special angles related to a boundary between adjoining crystals.

Fig. 3. Relation among γ αij, and τ obtained from Equation (I). A pair of adjoining crystals are represented by one point.

Fig. 4. Frequency histogram of the angle between peaks of preferred c-axis orientations of the multi-maximum fabrics found and reported in many glaciers and ice sheets over the world.
5. Oxygen-oxygen bond lines
A single crystal of ice has seven orientations of oxygen-oxygen lines (0-0 lines) linked by a hydrogen bond. If one 0-0 line coincides in orientation between adjoining crystals, the following equation can be derived using spherical trigonometry:
where ![]() . Since the tetra hedral angle (oxygen-oxygen-oxygen angle) in a crystal structure of ice is 109.5°, when
. Since the tetra hedral angle (oxygen-oxygen-oxygen angle) in a crystal structure of ice is 109.5°, when ![]() , these adjoining crystals cannot have such a coincident orientation of an 0-0 line lying on the OP plane (Fig. 2) which bisects the orientations of two c-axes. If two 0-0 lines coincide in orientation between adjoining crystals,
, these adjoining crystals cannot have such a coincident orientation of an 0-0 line lying on the OP plane (Fig. 2) which bisects the orientations of two c-axes. If two 0-0 lines coincide in orientation between adjoining crystals,
If four 0-0 lines coincide,
It is geometrically obvious that three, or more than four, coincident 0-0 lines cannot exist between adjoining crystals.

Fig. 5. Orientations of three a-axes, plotted on a Wulff net, of each crystal in the relation of (180 ± 2)° rotational symmetry with its adjoining crystal. Rotation axis is fixed at T. Solid lines show loci (cf. Equation (2)) of a-axes of the crystal which has one coincident orientation of an O-O line on PO plane (mirror plane) with its adjoining crystal. Open stars show the a-axis orientations of the crystal having two coincident 0-0 lines, solid stars representing those of the crystal having four coincident 0-0 lines.
The existence of a coincident orientation of an 0-0 line always brings adjoining crystals into the relation of a 180°-rotation (equivalent to a mirror reflection), so (α
i
= α
j
'= α
ij
. In this connection, the existence of the coincident orientation of an 0-0 line was examined for all the measured pairs of adjoining crystals which are in the relation of ![]() and α
i
≈ α
j
'.
and α
i
≈ α
j
'.
In Figure 5 (angle-true Wulffnet), the 180°-rotation axis is fixed at T and three a-axes are plotted so that the c-axis is on the TO plane at the position of a 180° rotation with respect to the rotation axis T. The curves of solid lines are the loci of a-axes, drawn on the basis of Equation (2). A good agreement can be seen between the measured and geometrically derived a-axis orientations. Thus, most of the adjoining crystals related by a 180° rotation have at least one coincident orientation of an 0-0 line on the OP plane, which is perpendicular to the rotation axis. All the foregoing facts suggest that the existence of a coincident 0-0 line may connect adjoining crystals very closely.
In Figure 5, notable concentrations can be seen in the a-axis orientations (open stars) of a crystal having two coincident 0-0 lines with its adjoining crystal (![]() and 67.5°). This concentration is especially noted for a Cape Folger core ice (F), which shows the most conspicuous multi-maximum “diamond” fabric. Meanwhile, at
and 67.5°). This concentration is especially noted for a Cape Folger core ice (F), which shows the most conspicuous multi-maximum “diamond” fabric. Meanwhile, at ![]() and 54.8°, where four coincident 0-0 lines exist, no peculiarity can be recognized except for the candle ice (B) grown from the melt. However, this angle is found in the plane assemblages of both the spatial and the radiating types of snow crystals (Lee, 1972 ; Uyeda, unpublished; Kobayashi and others, 1976). Such a difference, in crystallographic relations between a snow crystal, ice grown from the melt, and glacier ice may be attributed to the difference in the conditions of crystal growth, namely, crystal growth from the vapour, melt, or solid phase.
and 54.8°, where four coincident 0-0 lines exist, no peculiarity can be recognized except for the candle ice (B) grown from the melt. However, this angle is found in the plane assemblages of both the spatial and the radiating types of snow crystals (Lee, 1972 ; Uyeda, unpublished; Kobayashi and others, 1976). Such a difference, in crystallographic relations between a snow crystal, ice grown from the melt, and glacier ice may be attributed to the difference in the conditions of crystal growth, namely, crystal growth from the vapour, melt, or solid phase.

Fig. 6. Model of the boundary structure, projected onto (1010), of ![]() and 67.5° at which one crystal (oxygen atoms are indicated by solid symbols; 0-0 lines by solid lines) approaches its adjoining crystal (oxygen atoms by open symbols; 0-0 lines by dashed lines). Coincident positions of the oxygen atoms are indicated by dashed circles, coincident orientations of 0-0 lines being indicated by thick solid lines.
and 67.5° at which one crystal (oxygen atoms are indicated by solid symbols; 0-0 lines by solid lines) approaches its adjoining crystal (oxygen atoms by open symbols; 0-0 lines by dashed lines). Coincident positions of the oxygen atoms are indicated by dashed circles, coincident orientations of 0-0 lines being indicated by thick solid lines.
6. Boundary structure of a multi-maximum fabric
The values ![]() and 67. 5° may thus be singular angles in a polycrystalline glacier ice under a possibly thermodynamic sub-stable state. So, the boundary structure at these angles was examined. Figure 6 shows two lattice structures of ice which are superimposed so that their lattice orientations make this singular angle with each other. A regular period can be seen in the coincident orientations of an 0-0 line (indicated by thick lines) and also in the coincident positions of oxygen atoms (surrounded by dashed circles). Several planes on which their periodic coincidence occurs with high density are found. Their planes are of low plane indices as indicated in Figure 6 (indices of 180°-rotation axes are also indicated in Figure 6). This implies that the adjoining crystals in a multi-maximum fabric could approach one another very closely along either of these low-index planes.
and 67. 5° may thus be singular angles in a polycrystalline glacier ice under a possibly thermodynamic sub-stable state. So, the boundary structure at these angles was examined. Figure 6 shows two lattice structures of ice which are superimposed so that their lattice orientations make this singular angle with each other. A regular period can be seen in the coincident orientations of an 0-0 line (indicated by thick lines) and also in the coincident positions of oxygen atoms (surrounded by dashed circles). Several planes on which their periodic coincidence occurs with high density are found. Their planes are of low plane indices as indicated in Figure 6 (indices of 180°-rotation axes are also indicated in Figure 6). This implies that the adjoining crystals in a multi-maximum fabric could approach one another very closely along either of these low-index planes.

Fig. 7. Orientations of seven 0-0 lines (solid circles) of a single crystal of ice, the c-axis of which is at the centre of the Wulff net. Solid lines are loci of the orientation with which each of the seven 0-0 lines makes the tetrahedral angle, 109.5°. Dashed and shaded circles show the areas where several intersections of the loci concentrate.
7. Coincident 0-0 line fabric
Figure 7 shows the seven orientations of an 0-0 line of a single crystal of ice (solid circles). The solid lines are the loci of the orientations with which each of the seven 0-0 lines (solid circles) makes the tetrahedral angle of 109.5° (0-0-0 angle). If coincident orientations of an 0-0 line exist in both this single crystal (in Fig. 7) and its adjoining crystal, the c-axis orientation of the adjoining crystal must be somewhere on the locus. Accordingly, if the c-axes of adjoining crystals are concentrated in the directions where several intersections of loci are concentrated (surrounded by small dashed circles), their coincident 0-0 lines with the single crystal can be concentrated in the orientations of seven 0-0 lines of the single crystal (solid circles). The angles between small dashed circles are about (45 ± 5)°. This angle reveals a marked agreement with the measured angles between preferred c-axis orientations of the multi-maximum fabric, as shown in Figure 4.
For all the measured adjoining crystals in each polycrystalline ice of different origin, the coincident orientations of 0-0 lines were then examined. Their orientations were plotted on one and the same equal-area projection net (Fig. 8). It should be noted that these are highly concentrated in several orientations and that their spatial distributions are very close to the seven orientations of 0-0 lines of a single crystal of ice, as predicted above.
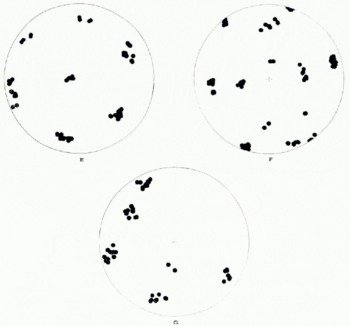
Fig. 8. Coincident 0-0 line fabrics plotted on an equal-area Schmidt net. E: “Byrd” station core ice (2003 m dept), F: Cape Folger core ice (259 in dept), G: Mendenhall Glacier ice.
It was also found that a multi-maximum c-axis fabric (Cape Folger core ice, Mendenhall Glacier ice, and “Byrd” core ice) has more adjoining crystals related by a 180° rotation than other c-axis fabrics such as a single-maximum fabric. These facts strongly suggest that a polycrystalline ice having a multi-maximum c-axis preferred orientation fabric (diamond pattern) has the closest crystallographic structure to the structure of a single crystal of ice.
8. Concluding remarks and discussion
For several types of polycrystalline ice of different origins, the spatial lattice orientation of a crystal was determined by measurements of both the a- and c-axes. Analyses of orientations of adjoining crystals clarified that a great majority of the adjoining crystals may be in a twinning relation. This may suggest a strong possibility that the structural relation between crystals plays a major role in the appearance and growth of nuclei which have specific orientations during recrystallization.
Experiments on recrystallization are now in progress in Sapporo by K. Kitakizaki using the three-point bending method of deforming a single ice crystal. Data being obtained are confirming the above possibility. Orientations of nuclei of recrystallized crystals have specific relations with the orientations of their mother crystals and/or their adjoining crystals, the rotations being of the 60°, 90°, 120°, or 180° rotation symmetry. The detailed analytical results and their correlation with the measured results of glacier ice will be published.Footnote *
Most fabrics observed in glaciers and ice sheets such as single-maximum, two-maximum, and small-girdle fabrics, have been experimentally produced in the laboratory, while the formation of these fabrics has been explained by the basal sliding mechanism (Brace, 1960; Budd, 1972; Kamb, 1972). However, a multi-maximum “diamond” fabric has neither been successfully produced in the laboratory, nor has it been possible to explain the formation mechanism solely by basal sliding. It is also unlikely that non-basal sliding, boundary sliding, and self-diffusion, which have been observed in plastic deformation of ice (Shumskiy, 1958; Nakaya, 1958; Rigsby, 1960; Wakahama, 1960, 1962, 1964, 1965; Gold, 1963; Higashi and others, 1968; Mae, 1968; Barnes and others, 1971 ; and others), can explain the multi-maximum preferred orientations.
In addition to the foregoing mechanisms, another important mechanism which is normally found in metal deformation, is mechanical twinning, although it has never been reported for ice; i.e. neither have direct observations been made, nor has a theory been proposed to date for mechanical twinning of ice. Both sliding and twinning deformations are essentially caused by shear, while a twinning deformation in metal needs a much higher shear stress than sliding deformation. It is also found in metal that a twinning deformation proceeds by process of twin nucleation and propagation of a twin boundary (twin growth). Twin nucleation requires a very high shear stress, which would be provided by a local stress concentration due to non-basal sliding. After twin nucleation breaks out, a much lower shear stress suffices for its propagation and growth, although it is still a higher stress than that for sliding deformation (Bell and Cahn, 1957). These observations obtained for twin deformation in metals give rise to the possibility that the multi-maximum “diamond” fabric of ice may be attributable to mechanical twinning. The multi-maximum fabric has the following characteristics: it is composed of crystals in very specific lattice orientations, which form a polycrystalline structure close to the structure of a single crystal of ice; many of the crystal boundaries are twin boundaries of a very specific lattice structure, as shown in Figure 5; the crystal size in this fabric is larger than in any other fabrics ; the degree of elongation of bubbles contained is very small and the bubbles are rather spherical; this fabric has been found in those parts which have undergone a very strong shear deformation at a temperature relatively close to the melting point. Matsuda and Wakahama* found that this fabric exists in a stable state at those parts of the glacier where an octahedral shear stress exceeds about 0.4 bar (other fabrics are stable under a lower shear stress). Plastic deformation of the ice with this fabric must be thus due to a deformation mechanism that preserves the above characteristics of this fabric despite a large plastic deformation. Hence, mechanical twinning may be a possible, even a likely mechanism to satisfy this condition. This is because absorption of a large amount of plastic strain energy produced by such a strong shear stress can be made by the propagation of twin boundaries without changing the relative structural relation between crystals, without changing a crystal boundary structure, and without ma king strong bubble elongation.
The more de tailed mechanism of fabric formation and its quantitative relations with stress and stress configuration are described by Matsuda and Wakahama.Footnote *
Acknowledgments
This study started from the analysis of the Cape Folger core ice drilled in 1969 by ANARE as part of its project led by Dr W. F. Budd of Antarctic Division, Australia. The authors would like first to express their sincere gratitude to him for providing an opportunity to pursue this study and for many suggestions and encouragement. They are also grateful to Professor A. Higashi, leader of the third Hokkaido University Alaska Glacier Expedition, as well as, to their colleagues of this expedition to Mendenhall Glacier for offering useful suggestions and making ice samples available. They are much indebted to Professor C. C. Langway, jr., New York State University, through whom the “Byrd” station ice cores were provided to the Institute of Low Temperature Science, Hokkaido University; their physico-chemical properties are now under analysis by a research group of the Institute (leader Professor D. Kuroiwa), part of the analytical results of which is included in the present paper. In conclusion, they must thank Professor K. Kizaki, Ryukyu University, for his personal inspiration, which has helped make this study possible.
Discussion
W. B. KAMB: Perhaps I should point out that I have been measuring a-axis orientations in temperate glacier ice for 15 years and have much unpublished data of this kind. In agreement with what you find, my data show strong a-axis fabrics in many cases.
J. W. GLEN: I realize that you are reporting results and may not be in a position to indicate yet the reason for them, but the formation of these fabrics during original growth seems unlikely in some of these cases. The appearance of very specific orientation relations in recrystallization and grain growth might be due to preferred growth in certain orientations, or to the relative inability to eliminate a boundary with lower energy, or structural relations between grains. Do you have any ideas on this at the present stage?
M. MATSUDA: At least in the appearance of nuclei which have specific orientations, their structural relation with their mother crystals and/or their adjoining crystals is to play a major role. For both experimentally recrystallized ice and glacier ice, clear regularity was found in the structural relations between adjoining crystals. Such a structural relation is of great importance for nucleation taking place during recrystallization. However, the formation of specific preferred orientation fabrics observed in bulk glacier ice which is undergoing constant plastic deformation, would be largely dependent on the deformation mechanism, which varies with stress and temperature.
Although relative inability to eliminate a boundary with lower energy may contribute to the formation of a conspicuous preferred orientation fabric, it is expected to play a rather minor role in the appearance of specific preferred orientations.


