

1. Introduction
The Baltic Sea is characterized as a brackish water basin, with only a narrow connection to the world ocean through the shallow Danish straits. Sea ice occurs annually; however, the interannual variability in ice cover is large (e.g. Reference Seinä and PeltolaSeina and Peltola, 1991). During mild winters, only coastal regions and the Bothnian Bay are ice-covered (Fig. 1), whereas during severe winters almost the whole sea is ice-covered. The ice season lasts for 5–7 months in the northernmost parts and decreases in duration towards the south (e.g. Reference Seinä and PeltolaSeinä and Peltola, 1991). The maximum ice extent occurs in mid-February to mid-March. The land-fast ice cover usually extends to the outer skerries, where the water depth is 5–15 m. Further offshore the ice cover is highly dynamic (e.g. Reference LeppärantaLeppäranta, 1981). Fast ice grows 20–100 cm thick, depending on the winter and location; the maximum observed level ice thickness is 122 cm (Reference Seinä and PeltolaSeinä and Peltola, 1991). The salinity of the surface water is 3–7 PSU (practical salinity units) on the Finnish coast, while the sea-ice salinity is generally < 2 PSU (e.g. Reference PalosuoPalosuo, 1963). Observations of the stable-oxygen-isotopic properties (δ 18O) in the northern Baltic Sea, especially the Gulf of Bothnia, are virtually non-existent. Reference Punning, Vaikmäe and MäekiviPunning and others (1991) presented δ 18O values of −6 to −8‰ for water salinities of 5–15‰. Observations show that the relationship between salinity and δ 18O is close to linear (Reference Fröhlich, Grabczak and RozanskiFröhlich and others, 1988; Reference Punning, Vaikmäe and MäekiviPunning and others, 1991), with some seasonal deviations mainly due to evaporation.

Fig. 1. Map of the northern Baltic Sea showing the location of the sampling sites in March 2000 and the ice conditions on 15 March (ice chart of the Finnish Institute of Marine Research Ice Service). In the labels for the sampling sites, GF, AS, BS and BB refer to the Gulf of Finland, the Archipelago Sea, the Bothnian Sea and the Bothnian Bay, respectively.
As Reference Weeks, Gow, Kosloff and Digby-ArgusWeeks and others (1990) noted, one might suppose that the characteristics of sea ice in a restricted and economically important water such as the Bothnian Bay would have been extensively over-studied, but this is not the case. This applies to the whole Baltic Sea as well. Studies on sea ice in the Baltic Sea to date have mainly focused on large-scale problems, such as ice dynamics and climatology (e.g. Reference LeppärantaLeppäranta, 1981; Reference Haapala and LeppärantaHaapala and Leppäranta, 1996, Reference Haapala and Leppäranta1997). However, a thorough understanding of the role of sea ice in the Baltic Sea, whether from an oceanographic, climatological or biological perspective, requires quantitative estimates of different ice-growth processes.
The crystal structure of sea ice in the Baltic Sea shows large variability (Reference PalosuoPalosuo, 1961, Reference Palosuo1963; Reference OmstedtOmstedt, 1985; Reference Fransson, Håkansson, Omstedt and StehnFransson and others, 1990; Reference Weeks, Gow, Kosloff and Digby-ArgusWeeks and others, 1990), although these studies have often been restricted to certain geographical areas. In pack ice, dynamic thickening is important (e.g. rafting and ridging plays an important role). Reference Weeks, Gow, Kosloff and Digby-ArgusWeeks and others (1990) found pack ice to be composed of up to 80% granular ice. In coastal areas the ice cover is more static, and often the ice sheet consists of two distinct layers: an upper granular layer (partly snow ice) and a lower columnar layer (see, e.g., Reference PalosuoPalosuo, 1963).
Snow-ice formation is a widely occurring process in Antarctic waters (e.g. Reference Lange, Schlosser, Ackley, Wadhams and DieckmannLange and others, 1990; Reference Eicken, Lange, Hubberten and WadhamsEicken and others, 1994; Reference Jeffries, Shaw, Morris, Veazey and KrouseJeffries and others, 1994, Reference Jeffries, Worby, Morris and Weeks1997; Reference Kawamura, Ohshima, Takizawa and UshioKawamura and others, 1997; Reference Eicken and JeffriesEicken, 1998; Reference Haas, Thomas and BareissHaas and others, 2001), and some observations on its importance have also been reported from the Baltic Sea (Reference PalosuoPalosuo, 1963; Reference KawamuraKawamura and others, 2001). Snow ice forms when the snow load on the ice depresses the ice surface below sea level (i.e. sea ice has a negative freeboard), so the sea water can potentially flood onto the ice and produce a layer composed of a mixture of snow and sea water (slush). This slush can freeze, and form snow ice on top of the existing sea-ice cover (e.g. Reference Haas, Thomas and BareissHaas and others, 2001). Superimposed ice is formed when snow meltwater refreezes (e.g. Reference Kawamura, Ohshima, Takizawa and UshioKawamura and others, 1997). Recently snow-ice formation has been recognized to have an impact on several factors (e.g. it is an effective way of sea-ice thickening since the freezing interface is closer to the atmosphere (the heat sink) than in ice growth at the ice–water interface (e.g. Reference Maksym and JeffriesMaksym and Jeffries, 2000)). Furthermore the flooding and subsequent snow-ice formation processes may be important for nutrient replenishment for sea-ice algae (Reference Fritsen, Lytle, Ackley and SullivanFritsen and others, 1994), and slush layers can be an important habitat for (ice) algae (Reference Haas, Thomas and BareissHaas and others, 2001).
Very little quantitative information is available on the amounts of snow ice and frazil ice that make up the granular layer in the Baltic Sea. Observations by Reference PalosuoPalosuo (1963) show large spatial and interannual variability in the amount of snow (white ice) incorporated into the ice cover. According to studies on land-fast sea ice in the Gulf of Finland, granular ice may contribute up to 42% of the total ice thickness (Reference KawamuraKawamura and others, 2001). Data on the stable-isotopic composition of Baltic Sea ice are limited to those obtained from one site on the coast of the Gulf of Finland (Reference KawamuraKawamura and others, 2001). These observations indicated a significant contribution from snow, the snow fraction (by mass) being up to 26% during the ice season.
The main motivation for the use of oxygen isotopes in sea-ice studies is that they provide information on the role of snow in sea-ice processes, such as flooding, snow-ice formation and meltwater transport (e.g. Reference Lange, Schlosser, Ackley, Wadhams and DieckmannLange and others, 1990; Reference Eicken, Krouse, Kadko and PerovichEicken and others, 2002). This study concerns detailed observations of sea-ice properties in the Baltic Sea during one particular ice season, winter 1999/2000. Results from observations made on land-fast sea ice along the Finnish coast are presented. The objective was to study the structural properties and stable-oxygen-isotopic composition (δ 18O), and to understand the key growth processes of land-fast sea ice along the whole coast. The contribution of snow to ice formation was of special interest, since earlier studies have shown that it is potentially important for the thickening of the sea-ice cover, but no quantitative estimates have been presented for the Baltic Sea previously, except for one site in the Gulf of Finland (Reference KawamuraKawamura and others, 2001).
2. Study area and Methods
Sea-ice samples were collected at 15 sites along the Finnish coast of the Baltic Sea (Fig. 1), at 60.2–65.7° N, 21.3–26.9° E, in March and April 2000. Winter 1999/2000 was relatively mild, with ice covering only the Bothnian Bay and some coastal areas further south (Fig. 1). The maximum ice extent was reached in late February, when 23% of the Baltic Sea was ice-covered, compared to a longer-term average of about 45%. The ice thickness was also less than average: the thickness of the sampled ice cores varied between 17 and 72 cm, with a mean thickness of 38 cm (Table 1). Snow thickness at the sites varied between 0 and 40 cm (Table 1).
Table 1. Description of sampling sites along the Finnish coast of the Baltic Sea. The snow depth is the measured snow depth (or range observed) on the ice at the sampling site

An ice core 13 cm in diameter was taken at each site for determination of salinity, crystal structure and stable-oxygen-isotopic properties (δ 18O). In addition, snow and surface water samples were collected whenever possible, and conductivity and temperature profiles of the water column were also measured frequently. Directly after retrieval, the cores were put in plastic tubing and kept in a freezer (< −20°C) prior to analysis.
In the cold room (at −15 to −20°C) at the Technical Research Centre of Finland, Espoo, and the University of Oulu, Finland, each core was split lengthwise to obtain a 1 cm thick section, which was cut into 10–20 cm long vertical sections. These were attached to glass plates, planed to about 1 mm thickness, and then examined between crossed polarizers to identify the crystal structure. Hereafter the remainder of the core was divided into sections, usually 1–10 cm long, along structural boundaries.
A 100–200 mL sample of each structural section was taken from the central part of the core and put into a zip-lock polyethylene bag. The pieces were melted at room temperature, and, immediately after melting, 40 mL bottles were filled completely and closed tightly. The water samples were shipped to the Institute of Geology, Tallinn, where δ 18O was determined using a Finnigan-MAT Delta-E mass spectrometer (Finnigan-MAT, Bremen, Germany). Results are measured against laboratory internal standard water, which has been calibrated on the V-SMOW/SLAP scale using the international reference materials V-SMOW (Vienna Standard Mean Ocean Water) and SLAP (Standard Light Antarctic Precipitation) from the International Atomic Energy Agency (IAEA), Vienna, Austria. Reproducibility of replicate analyses is generally better than ±0.1‰. Salinity was determined from the same melted samples using a Schott handylab LF1 (Schott Glas, Mainz, Germany) conductivity meter and UNESCO algorithms (Reference Fofonoff and MillardFofonoff and Millard, 1983) to an accuracy of 0.1 PSU.
3. Results and Discussion
3.1. Structure, stratigraphy and oxygen-isotopic characteristics
A granular upper layer and a columnar lower layer are characteristic structural features of most of the cores. The granular ice layer often consisted of fine-grained layers (mm-sized crystals, denoted g in Figs 2–4) and a type of ice termed transition ice (Fig. 5, with cm-sized crystals, denoted g/c in Figs 2–4), which is an intermediate state resulting from oscillations between the granular- and columnar-ice growth modes (see Reference Weeks, Gow, Kosloff and Digby-ArgusWeeks and others, 1990). Figure 5 shows the structure of transition ice. The total ice thickness varied between 17 and 72 cm, and the snow depth between 0 and 40 cm, both showing a significant increase in thickness towards the north (Fig. 6b).

Fig. 2. Structural properties and vertical profiles of salinity and δ 18O for ice cores from the Bothnian Bay. The ice cores were divided into granular ice (g), a mixture of granular and columnar ice (g/c), termed transition ice, and columnar ice (c). The vertical scale depends on the individual ice-core length.

Fig. 3. Same as Figure 2, but for ice in the Bothnian Sea.

Fig. 4. Same as Figure 2, but for ice in the Archipelago Sea and the Gulf of Finland.

Fig. 5. A vertical thin section of transition ice, an intermediate granular–columnar ice type (see Reference Eicken and LangeEicken and Lange, 1989), photographed between crossed polarizers. Section is from depth 5–14 cm at site BS-3. The scale on the left is in centimeters.

Fig. 6. (a) Relationship of δ 18O in snow, under-ice water and columnar ice (average value for columnar ice in each core) with latitude; least-squares linear regression lines included, with R 2 = 0.63, 0.82 and 0.65 for snow, water and columnar ice, respectively. (b) Relationship of ice and snow thickness with latitude; least-squares regression lines included, with R 2 = 0.94 and 0.83 for ice and snow thickness, respectively.
There were large variations in the amount of the different ice types: columnar ice constituted 0–84% of the ice sheet, the average being 40.2%, whereas granular layers (g and g/c) constituted 16–100% (mean 59.8%). Ice termed transition ice, defined as intermediate columnar granular ice by Reference Eicken and LangeEicken and Lange (1989), constituted on average 28.2% of the total ice thickness. The average values were computed according to the absolute method described in Reference JeffriesJeffries (1997). The absolute method sums the total amount (in meters) of a particular ice type measured in each core and then divides that total by the total length of the cores (in meters) to give an absolute percentage for that ice type. All average values given hereafter are computed according to this method.
The relative contribution of different ice types showed no significant regional variability (Figs 2–4), the clearest exception being the significant contribution of transition ice in the Bothnian Bay (Fig. 2). The contribution of granular and columnar ice showed large variability, and no clear differences between the different basins were observed.
Major exceptions to the characteristic two-layer ice structure were observed at sites BS-4 and BB-1. At BS-4 and BB-1 the bottommost layer was composed of fine-grained granular ice. This layer could be due to the generation of frazil ice in nearby open water, which had been driven below the fast ice at these sites. At BS-4 the fast-ice edge was relatively close, and new ice formation was observed some days before the sampling, making this assumption plausible. Another possibility is refreezing of surface meltwaters when they come into contact with seawater at sub-zero temperatures. However, the under-ice water salinities did not indicate this as a plausible explanation, and the δ 18O values were close to that of columnar ice, indicating a sea-water origin for these layers. This basal granular layer, however, did not contribute significantly to the total ice thickness at either BS-4 or BB-1, although it indicates that the generation of frazil ice in open leads at the fast-ice edge can also contribute to the sea-ice thickness.
At site BB-2, the whole core consisted of granular ice, fine-grained on top, and large irregular crystals (10–20 mm) in the bottom layer, which could be regarded as transition ice (g/c in Fig. 2). Similar thick layers of large irregular crystals were observed at sites BB-3 and BB-4 (see Fig. 2). For comparison, in the Antarctic, transition ice has been associated with nearby leads and a rough hydrodynamic regime (see Reference Eicken and LangeEicken and Lange, 1989, table 1, defined as intermediate c/g). The δ 18O values of transition-ice layers did not differ significantly from those in columnar-ice layers within individual sea-ice cores (paired t test, P = 0.17), indicating a sea-water origin for transition ice. On the other hand, the average δ 18O for fine-grained granular layers had significantly more negative values than transition or columnar ice in individual sea-ice cores (paired t test, P < 0.05). The salinity of fine-grained granular layers was significantly higher than in either columnar or transition ice (paired t test, P < 0.05), whereas transition ice and columnar ice had similar salinities (paired t test, P = 0.40) in individual sea-ice cores. Both the oxygen isotopic properties and salinity therefore indicate that the origin of transition ice (g/c ice in Figs 2–4) is from downward growth at the ice–water interface (see also Reference Eicken and LangeEicken and Lange, 1989). Possible mechanisms would be: (1) incorporation of frazil ice into the growing ice sheet; (2) enhanced growth rates due to changes in atmospheric conditions; and (3) changes in the hydrodynamic regime at the ice–water interface (Reference Eicken and LangeEicken and Lange, 1989). All mechanisms seem plausible, and further studies are needed to decipher the origin of this ice type in the Baltic Sea, since its contribution, especially in the Bothnian Bay, is very significant. However, the presence of transition ice could indicate that the fast-ice edge, with open leads, was close by at some stages of ice growth, and affected the hydrodynamic regime beneath the ice cover at those sites. A relatively small amount of transition ice (denoted g/c in Figs 3 and 4) was found in the Bothnian Sea, Archipelago Sea and Gulf of Finland. This is probably because land-fast ice was found only in rather sheltered locations, in the archipelago, in skerries, bays or embayments where the growth conditions are more static.
A characteristic feature of the δ 18O profiles is that the most negative values are encountered in the topmost granular layers. The δ 18O values generally increase downwards in the ice, ranging from −16.2‰ to −5.9‰ (Figs 2–4). In snow, δ 18O ranged between −17.4‰ and −8.3‰ (mean −12.2‰); the range is somewhat smaller than for snow in the Weddell Sea (Reference Eicken, Lange, Hubberten and WadhamsEicken and others, 1994). There is a trend of increasing δ 18O values in both columnar ice and snow going southwards (Fig. 6a), which correlates with increasing surface water salinities (e.g. Reference Haapala and AleniusHaapala and Alenius, 1994) and the north–south gradient in air temperature. Surface water δ 18O values follow a north–south trend similar to that for snow and columnar ice (Fig. 6a).
The least negative values in columnar layers are often encountered in the bottommost parts where the fractionation factor would be greatest due to slower growth rates when the ice gets thicker. On the other hand, the influence of under-ice spreading of riverine waters during the winter would tend to decrease the δ 18O in surface waters; consequently δ 18O in the columnar layers would decrease as the ice season progresses. Decreasing δ 18O values toward the bottom of the ice cover, below the highly negative surface layers, are observed only at BB-2 and AS-1 (Figs 2 and 4); the most distinct decrease is at BB-2, where the crystal structure is very different to that at the other sites. Also the salinity profile at site BB-2 indicates an increasing fresh-water contribution during the ice season (Fig. 2). However, the ice salinity is also affected by lower growth rates, i.e. the lower the growth rate the more salt is expelled from the ice. The under-ice water salinity profile, however, showed no distinct fresh-water layer beneath the ice at BB-2.
3.2. Identification of snow ice, frazil ice and transition ice
To differentiate between snow ice and frazil ice in sea ice requires stable-isotope data since the granular crystal texture of these ice types is very similar (Reference Lange, Schlosser, Ackley, Wadhams and DieckmannLange and others, 1990). Several different isotopic criteria were used by Reference Jeffries, Worby, Morris and WeeksJeffries and others (1997) to identify snow-ice layers; some of them have been adopted and modified to the Baltic Sea conditions. The use of average values of the whole study area in the Baltic Sea would tend to either over- or underestimate the contribution of snow and snow ice, since there is rather large spatial variability in the isotopic composition of both sea water (e.g. Reference Punning, Vaikmäe and MäekiviPunning and others, 1991) and precipitation in the study region (see IAEA, Isotope Hydrology Information System, the ISOHIS Database, accessible at: http://isohis.iaea.org). Conditions can differ significantly between different sampling sites, as seen in Figure 6a, so use of the properties of snow, ice and under-ice water at individual sites is more reliable than use of the average values over the whole study area, as in Antarctica by, among others, Reference Jeffries, Worby, Morris and WeeksJeffries and others (1997).
Many of our observation sites are potentially influenced by under-ice spreading of riverine waters, and δ 18O values of the surface waters could then change or fluctuate during winter. However, under-ice salinity profiles indicated that none of the sampling sites had a distinct under-ice freshwater plume/layer during sampling. The northernmost sites (e.g. BB-6 and BB-5) have surface water salinities as low as 0.1 PSU year-round, so δ 18O values are not subject to drastic changes during winter. Observations at freeze-up and late winter (under-ice waters) in the Bothnian Bay indicate that surface water δ 18O values in the study area fluctuate about 1‰ between the start of freezing and the end of winter (Fig. 7). Values tend to be higher at freeze-up time, and decrease slowly during winter. However, this occurs only in areas where the river input has an effect (see Reference Alasaarela and MyllymaaAlasaarela and Myllymaa, 1978). Assuming that the linear relationship between salinity and δ 18O is a result of a two-component mixture, one component with high salinity (the water entering the Baltic Sea from the North Sea) and one with zero salinity (river inflow and precipitation), the δ 18O value for the freshwater component in the study area in the Bothnian Bay is about −12.3‰, estimated from the regression equations in Figure 7 (Reference Fröhlich, Grabczak and RozanskiFröhlich and others, 1988). The largest variability in δ 18O values in Figure 7 is in waters with a salinity close to zero, i.e. in the vicinity of the river mouths. The large scatter is mainly attributed to differences in the location of the drainage basins. There are larger differences between different rivers than between seasonal values within the rivers in the study area, based on our limited dataset. Also Reference Fröhlich, Grabczak and RozanskiFröhlich and others (1988) noted that the water in the Baltic is not strictly a simple two-component mixture with two end-members, the zero-salinity input and the high-salinity input from the North Sea, but that there are regional variations in the zero-salinity input.
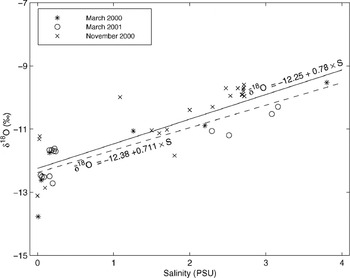
Fig. 7. Relationship of δ 18O with salinity in surface waters in the Bothnian Bay sampled in March 2000 (under-ice water), November 2000 (surface water during freeze-up) and March 2001 (under-ice water). Least-squares linear regression lines and equations included for whole dataset (solid line) and for under-ice samples (dashed line).
One potential influence of river waters spreading on sea water could be to produce frazil ice, when more saline water below the freezing point of fresh water would cool down the river water and produce ice from double diffusion processes (see, e.g., Reference McClimans, Steen and KjeldgaardMcClimans and others, 1979). Evidence for such ice formation has yet to be presented for the Baltic Sea, and is probably constrained to the very mouth areas of rivers. Ice produced in this manner would have a lower isotopic signature than ice of ambient sea-water origin and could potentially be assumed to be snow ice. This would give a faulty estimate for the snow contribution. A prerequisite for this would then be that river water, close to or at freezing temperatures, would be present at the sampling sites in the early stages of freezing. As noted above, no evidence for river water as distinct layers below the ice was observed at the time of sampling or during a survey prior to freeze-up in 2000, which also rules out the possibility of such ice formation in the early stages of ice growth. Earlier studies indicate that distinct river-water plumes form only under a prolonged ice cover (Reference Alasaarela and MyllymaaAlasaarela and Myllymaa, 1978). Frazil production due to double diffusion processes is probably present in close proximity to river mouths. However, observations of such ice-formation mechanisms are yet to be presented for the northern Baltic Sea.
The isotopic approach requires that the isotopic fractionation during ice formation is taken into account (Reference Jeffries, Worby, Morris and WeeksJeffries and others, 1997). Since we do not know the fractionation during ice formation, especially during snow-ice formation, we apply three different isotopic criteria to distinguish snow-ice layers from other ice types. The division between frazil ice and snow-ice layers by visual inspection is difficult, if not impossible. However, since the transition ice (denoted g/c in Figs 2–4) was shown to have a sea-water origin (see section 3.1), those layers are not considered to have any snow contribution. Only layers denoted as g in Figures 2–4, i.e. fine-grained granular-ice layers, are considered to potentially have a snow contribution. Three isotopic criteria, described below, are used to determine ice layers as snow ice or frazil ice.
Criterion 1 assumes that any granular-ice layer (denoted g in Figures 2–4) with δ
18O values less than ![]() , the sea-water δ
18O value at each site, has a snow contribution (cf. criterion 1, Reference Jeffries, Worby, Morris and WeeksJeffries and others, 1997). This criterion assumes no fractionation during snow-ice formation and can be regarded as a minimum estimate for the snow-ice contribution.
, the sea-water δ
18O value at each site, has a snow contribution (cf. criterion 1, Reference Jeffries, Worby, Morris and WeeksJeffries and others, 1997). This criterion assumes no fractionation during snow-ice formation and can be regarded as a minimum estimate for the snow-ice contribution.
Criterion 2 takes into account that some fractionation will occur during snow-ice formation, and fine-grained granular layers with δ
18O values below ![]() (cf. criterion 2, Reference Jeffries, Worby, Morris and WeeksJeffries and others, 1997). The observed value for isotopic fractionation during columnar-ice growth in the Gulf of Finland has been around 2‰ (Reference KawamuraKawamura and others, 2001; derived as the difference between δ
18O value of sea water and bottommost ice sections analyzed). The maximum fractionation during fresh-water ice formation, at zero growth rate, is assumed to be close to 3‰ (e.g. Reference O’NeilO’Neil, 1968; Reference Lehmann and SiegenthalerLehmann and Siegenthaler, 1991). However, for a 4‰ NaCl solution, Reference Craig and HomCraig and Hom (1968) found a fractionation factor of 2.65‰. Furthermore, ice grown in natural conditions will not necessarily be formed in isotopic equilibrium, which depends on freezing rate and water mixing at the ice–water interface (Reference Lehmann and SiegenthalerLehmann and Siegenthaler, 1991). For fractionation between sea water and sea ice, a value of 2.70% seems to apply during the slowest growth rates realized under natural conditions (Reference Craig and HomCraig and Hom, 1968; Reference Melling and MooreMelling and Moore, 1995; Reference Eicken and JeffriesEicken, 1998). Since the fractionation processes during snow-ice formation have not been studied in great detail, we assume that fractionation is not as close to equilibrium as during columnar-ice formation, because snow-ice layers usually grow faster, and the fractionation will be less than that for columnar ice. Therefore we choose a value for fractionation that is between the observed value for Baltic Sea ice and zero fractionation. This represents an intermediate estimate for the contribution of snow ice.
(cf. criterion 2, Reference Jeffries, Worby, Morris and WeeksJeffries and others, 1997). The observed value for isotopic fractionation during columnar-ice growth in the Gulf of Finland has been around 2‰ (Reference KawamuraKawamura and others, 2001; derived as the difference between δ
18O value of sea water and bottommost ice sections analyzed). The maximum fractionation during fresh-water ice formation, at zero growth rate, is assumed to be close to 3‰ (e.g. Reference O’NeilO’Neil, 1968; Reference Lehmann and SiegenthalerLehmann and Siegenthaler, 1991). However, for a 4‰ NaCl solution, Reference Craig and HomCraig and Hom (1968) found a fractionation factor of 2.65‰. Furthermore, ice grown in natural conditions will not necessarily be formed in isotopic equilibrium, which depends on freezing rate and water mixing at the ice–water interface (Reference Lehmann and SiegenthalerLehmann and Siegenthaler, 1991). For fractionation between sea water and sea ice, a value of 2.70% seems to apply during the slowest growth rates realized under natural conditions (Reference Craig and HomCraig and Hom, 1968; Reference Melling and MooreMelling and Moore, 1995; Reference Eicken and JeffriesEicken, 1998). Since the fractionation processes during snow-ice formation have not been studied in great detail, we assume that fractionation is not as close to equilibrium as during columnar-ice formation, because snow-ice layers usually grow faster, and the fractionation will be less than that for columnar ice. Therefore we choose a value for fractionation that is between the observed value for Baltic Sea ice and zero fractionation. This represents an intermediate estimate for the contribution of snow ice.
Criterion 3 gives a plausible upper limit for the contribution of snow ice. Any granular-ice layer (denoted g in Figs 2–4) with δ 18O values less than δ 18 O, the average δ 18O value for columnar ice at each site, has a snow contribution (cf. criterion 3, Reference Jeffries, Worby, Morris and WeeksJeffries and others, 1997). However, this assumption probably underestimates the amount of frazil ice, because isotopic fractionation during congelation (columnar-ice) growth is higher than during frazil-ice formation. Criterion 3 provides a plausible maximum estimate for the thickness contribution of snow-ice layers, and a minimum estimate for the amount of frazil ice. This assumption was also used by Reference KawamuraKawamura and others (2001) to estimate the snow contribution in sea ice in the Gulf of Finland.
Of the above isotopic criteria those using values compared to the sea-water value at each site, i.e. criteria 1 and 2, would tend to underestimate, rather than overestimate, the amount of snow ice. This is because if the δ 18O of sea water at the sites decreased during winter, as would be the case if the observational sites were influenced by runoff from land, one would use lower δ 18O values of sea water as reference than would have been incorporated into the sea-ice cover earlier in the season.
The results for the thickness contribution of snow ice and granular ice using the different criteria described above are given in Table 2. Based on the above criteria, 23.3–31.6% of the total ice thickness is composed of snow ice (i.e. a mixture of sea water and snow), and 31.6% can be regarded as the best (i.e. intermediate) estimate. The results using criteria 2 and 3 give identical results, because all transition ice layers are excluded from the identification process. Criterion 2 already incorporates all fine-grained layers, indicating that no frazil ice is present. In individual cores, the snow-ice thickness contribution ranged between 6% and 73% (criterion 2). The contribution of granular ice (frazil and transition ice) is of the same order as the contribution of snow ice, with transition ice having a substantial contribution in the Bothnian Bay, and frazil ice having a negligible contribution except for criterion 1 (8%).
Table 2. Contribution of granular-ice (frazil ice and transition ice) and snow-ice layers (%) to the total ice thickness averaged over all sites

3.3. Snow fractions
Structural analyses alone do not accurately quantify the amount of snow ice and the amount of snow incorporated into the ice sheet. For such information, δ 18O data have been used to distinguish between different ice types or to determine the contribution of snow to the sea-ice cover in Antarctic regions (e.g. Reference Gow and EpsteinGow and Epstein, 1972; Reference Lange, Schlosser, Ackley, Wadhams and DieckmannLange and others, 1990; Reference Eicken, Lange, Hubberten and WadhamsEicken and others, 1994; Reference Jeffries, Shaw, Morris, Veazey and KrouseJeffries and others, 1994; Reference JeffriesJeffries, 1997; Reference Kawamura, Ohshima, Takizawa and UshioKawamura and others, 1997). In order to quantitatively estimate the fraction of snow in granular-ice layers and sea-ice cores, they all assumed that only granular-ice layers had a contribution from snow. A simplified model developed by Reference Jeffries, Shaw, Morris, Veazey and KrouseJeffries and others (1994) from the original model by Reference Lange, Schlosser, Ackley, Wadhams and DieckmannLange and others (1990) is:
where f
s is the snow fraction (by mass) and f
sw the seawater fraction (by mass) of the granular-ice section in question and δ
s is the δ
18O value for snow at each site (−8.3 to −17.4‰ (Fig. 6)). For the δ
sw value, we use the sea-water value at each site, with 1 added ![]() , which allows for some isotopic fractionation during the formation of snow ice (see Reference Jeffries, Worby, Morris and WeeksJeffries and others, 1997), and δ is the δ
18O value for the granular-ice section for which the snow fraction is being determined.
, which allows for some isotopic fractionation during the formation of snow ice (see Reference Jeffries, Worby, Morris and WeeksJeffries and others, 1997), and δ is the δ
18O value for the granular-ice section for which the snow fraction is being determined.
The total snow fraction (by mass) of the entire ice thickness in each core, F m, was obtained according to:
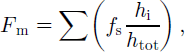
where f s is the snow fraction and h i is the thickness of individual snow-ice layers in the core for which F m is being determined. h tot is the total length of the ice core. Several snow-ice layers were encountered in the cores, because the topmost fine-grained layer was usually divided into several sections along stratigraphic boundaries.
Snow-fraction (F m) values resulting from applying Equations (1–3) to granular-ice layers, which have been identified as snow-ice layers using criteria 1 and 2 (see section 3.2), are shown in Table 3. On average, 20.7% of the ice in the study region consisted of snow using the intermediate criterion. Applying the above equation to snow-ice layers identified by criterion 3 gives the same values as criterion 2. The minimum estimate (criterion 1) gives an average snow fraction of 18.3%.
Table 3. The snow fraction, F m (%), at the different sites derived with the isotopic mass-balance model (Equations (1) and (2)) applied to snow-ice layers as identified by criteria 1 and 2 (see text)

f s values for individual snow-ice layers ranged from 3% to 213%, with an average of 54% for those layers with values < 100%. Those above 100% were corrected to a value of 100% when the F m values were computed, even though a value of 100% or more indicates that the whole layer consisted of snow only, which is not usually plausible unless superimposed ice is formed from melting snow. Only at one site, AS-1, is this a plausible explanation for f s values > 100%. In the rest of the cases, the δ s value at that site was higher than the δ 18O values for the corresponding granular-ice layers. This implies that temporal variability in δ 18O values for the snow should be taken into account in order to improve the estimate for the δ s value for snow included in the ice cover. However, using the average δ 18O values for snow at all sites, or for each basin, in Equations (1) and (2), instead of the individual value for each site, does not improve or change the results very much. This indicates that the temporal variability of the snow properties is the most important parameter to consider when improving the estimates presented here. There can be large seasonal fluctuations in the isotopic signature of precipitation in the Baltic Sea area (Reference Punning, Vaikmäe and MäekiviPunning and others, 1991). However, there are virtually no data on the δ 18O of snow or precipitation in the Gulf of Bothnia or along the coasts of Finland (see, e.g., Reference Fröhlich, Grabczak and RozanskiFröhlich and others, 1988; Reference Punning, Vaikmäe and MäekiviPunning and others, 1991), which regrettably undermines an effort to present more exact figures here. Therefore our maximum estimate (20.7%) should be considered as a plausible upper limit for the snow contribution to the sea-ice mass balance in the study region.
Applying the methods used in this study to the data presented by Reference KawamuraKawamura and others (2001), the estimates for the snow fractions in the Gulf of Finland in winter 1999 decrease to 20% at maximum (compared to 26% in Reference KawamuraKawamura and others (2001)). The method used by Reference KawamuraKawamura and others (2001), described as criterion 3 in this study, tends to overestimate the snow contribution in the snow-ice layers (Reference Jeffries, Worby, Morris and WeeksJeffries and others, 1997). Furthermore Reference KawamuraKawamura and others (2001) used a δ sw value assuming that the fractionation during snow-ice formation is as high as during columnar-ice growth, which is probably not the case since snow-ice growth is usually faster than growth at the ice–water interface. Therefore the fractionation is not as close to equilibrium during snow-ice formation.
The temporal variability of the snow properties (δ 18O and density) should also be better taken into account, and in the Baltic Sea area there is a need for more systematic measurements of the isotopic composition of sea water, river inflow and precipitation (including snow) (see Reference Fröhlich, Grabczak and RozanskiFröhlich and others, 1988), especially in the Gulf of Bothnia where data are virtually non-existent. These observations would be valuable in sea-ice studies, as well as in more detailed studies of the water balance in the region (Reference Fröhlich, Grabczak and RozanskiFröhlich and others, 1988). There is also a need for more detailed information about isotopic fractionation during consolidation of mixtures of snow and sea water, in order to be able to present more accurate estimates of the snow contribution to sea-ice mass balance, not only in the Baltic Sea area, but also in areas where isotopic methods have been widely used (e.g. in Antarctic sea ice).
4. Conclusions
The δ 18O profiles of sea-ice cores typically follow the structural properties, with the most negative values in the granular surface layers, which is typical of both Antarctic sea ice (e.g. Reference Lange, Schlosser, Ackley, Wadhams and DieckmannLange and others, 1990; Reference Jeffries, Shaw, Morris, Veazey and KrouseJeffries and others, 1994) and land-fast sea ice in the Gulf of Finland (Reference KawamuraKawamura and others, 2001).
Even the minimum estimate for the snow-ice contribution to the total ice thickness is significant (23.9%); the intermediate estimate of 31.6% should be considered an upper estimate. The results are in agreement with observations from land-fast sea ice in the Gulf of Finland (Reference KawamuraKawamura and others, 2001), with values of 14–42%. Our observations are in reasonable agreement with Reference PalosuoPalosuo (1963), who studied the snow-ice thickness using a gauge-stick; he observed values up to about 50% at sites along the Finnish coast. There was, however, large interannual variability in the contribution of snow ice (see Reference PalosuoPalosuo, 1963). Values similar to or somewhat lower than those reported here for the contribution of snow ice have been reported by Reference Jeffries, Worby, Morris and WeeksJeffries and others (1997), which are among the highest values reported from Antarctic sea ice. Generally the values reported from Antarctica are somewhat lower.
The contribution of frazil ice is negligible, at maximum only 8% (criterion 1), which indicates that dynamic ice formation is not important in the coastal regions in the northern Baltic Sea. However, an ice type termed transition ice, with large irregular crystals up to several centimeters in size, contributed significantly, with an average contribution of 28% in the whole study area and a significant contribution in the Bothnian Bay. The isotopic properties and salinities indicate that this ice type originates from growth at the ice–water interface; however, the exact formation processes for this ice type need further study. The processes proposed by Reference Eicken and LangeEicken and Lange (1989) for Antarctic waters all seem applicable to the Baltic Sea as well.
The estimated snow fraction in the ice cores, on average 18.3–20.7% (by mass), is significant when compared to observations in other regions. However, both estimates are slightly high, as some snow-ice layers contributed 100% of snow, which is not plausible (except in cases with super-imposed-ice formation). In the seasonally ice-covered Sea of Okhotsk, the snow fraction was estimated to be about 8% (Reference Ukita, Kawamura, Tanaka, Toyota and WakatsuchiUkita and others, 2000). The maximum reported snow fraction in Antarctic sea ice is 14–16% (Reference Jeffries, Worby, Morris and WeeksJeffries and others, 1997). Whereas Reference KawamuraKawamura and others (2001) reported values of 2–26% during the ice season at one site in the Gulf of Finland, the highest values, from the late season, compare favorably with our observations. The methods used by Reference KawamuraKawamura and others (2001) provided a plausible upper limit for the snow contribution, and their maximum estimate decreases to 20% using the methods applied in this study.
In order to improve the estimate of the snow fraction, the temporal variability in isotopic properties of snow should be better taken into account. This is revealed by the fact that f s values for some individual snow-ice layers exceeded 100%, which indicates that the isotopic properties of the snow incorporated into the ice cover were different than for the sampled snow. However, it was beyond the scope of this study to make systematic long-term observations of the isotopic composition of precipitation, even though earlier observations would have been useful for the purpose of this study. We also infer that other workers conducting similar studies should critically check their results, since the snow collected does not necessarily represent the snow that has been incorporated into the sea-ice cover, and could therefore alter the results obtained.
In summary, we have shown that snow contributes significantly to the mass balance of land-fast sea ice in the entire northern Baltic Sea. On average, the snow-ice thickness is about one-third to one-quarter of the total ice thickness, and the snow fraction is about one-fifth of the total ice mass. This is higher than generally reported for Antarctic sea ice and the seasonally ice-covered Sea of Okhotsk, and confirms that the findings by Reference KawamuraKawamura and others (2001) seem to be applicable to the land-fast sea-ice cover in the entire northern Baltic Sea. The question arises as to the applicability of our results to the Baltic Sea as a whole, since a large portion of the ice cover is composed of pack ice (e.g. in the Bothnian Bay about two-thirds by area). Therefore the logical next step would be to study the pack ice in more detail. Also the use of long-term studies, on seasonal or longer time-scales, would shed more light on the interannual and seasonal variability of these processes and improve the estimates presented here.
Acknowledgements
The authors would like to thank J. Ehn and K. Meiners for help in the field. A. Blanco, K. Kanto, E. Kärkäs and J. Uusikivi assisted in the cold rooms. J. Vainio and P. Eriksson provided the ice chart. H. Eicken, M. O. Jeffries and J. C. Moore are thanked for constructive comments on earlier versions of the manuscript. The comments of T. Gow and and anonymous reviewer as well as the help of M. Lange (Scientific Editor) led to improvements in the manuscript. Funding for this study was provided by the Academy of Finland, through the “Graduate School for Snow and Ice Research” and the project “Coastal sea ice and oceanography in the Baltic Sea in winter”.


