


1. INTRODUCTION
Accurate measurement of glacier surface motion which is mainly driven by internal ice deformation and basal slip is crucial to investigate glacier dynamics (Berthier and others, Reference Berthier2005; Sun and others, Reference Sun, Jiang, Liu, Sun and Wang2017). In general, the temporal variations of glacier surface velocity on timescales of hours to a day in summer season are mainly caused by the motion mechanisms of changes in basal slip (Willis, Reference Willis1995). This short-interval (daily or sub-daily) variation of glacier surface motion has been measured over polythermal or temperate glaciers in the Alps (Iken and Bindschadler, Reference Iken and Bindschadler1986; Sugiyama and Gudmundsson, Reference Sugiyama and Gudmundsson2004; Nienow and others, Reference Nienow2005; Riesen and others, Reference Riesen, Strozzi, Bauder, Wiesmann and Funk2011) and the High Arctic (Iken, Reference Iken1972; Bingham and others, Reference Bingham, Nienow and Sharp2003; Copland and others, Reference Copland, Sharp and Nienow2003). For the Tibetan Plateau (TP) which is the largest glaciated zone of the mid-latitude and low-latitude regions, hourly and daily fluctuations in glacier flow are poorly known due to lack of observations with high-temporal resolution, although a few observations of seasonal glacier velocity variations have been conducted in recent years (Luckman and others, Reference Luckman, Quincey and Bevan2007; Quincey and others, Reference Quincey, Luckman and Benn2009; Liu and others, Reference Liu, Qin, Du, Sun and Hou2010; Kraaijenbrink and others, Reference Kraaijenbrink2016).
Differential GPS (D-GPS) is a highly accurate and commonly used method for monitoring short-term variations of glacier surface velocity (Bingham and others, Reference Bingham, Nienow and Sharp2003; Vieli and others, Reference Vieli, Jania, Blatter and Funk2004). However, this technique can only be employed at a few locations, because it is very difficult and costly to install a continuous GPS receiver over the surfaces of high-altitude and remote-place mountainous glaciers. Satellite differential SAR interferometry (D-InSAR) and offset tracking methods have proven to be powerful remote sensing technologies for measuring large-coverage glacier surface velocity (Strozzi and others, Reference Strozzi, Luckman, Murray, Wegmuller and Werner2002; Luckman and others, Reference Luckman, Quincey and Bevan2007; Quincey and others, Reference Quincey, Luckman and Benn2009; Heid and Kääb, Reference Heid and Kääb2012; Dehecq and others, Reference Dehecq, Gourmelen and Trouve2015). Yet the observation of high-temporal resolution (hours to a day) glacier surface motion remains a big challenge in the TP for the two techniques due to their inherent limitations. Specifically, the temporal resolution of glacier surface velocity measured with the D-InSAR method is determined by the satellite revisit period. To date, daily and sub-daily time series of SAR data are unavailable from space-borne sensors. Furthermore, the capacity of offset tracking method in monitoring surface ice motion is seriously limited by the spatial resolution of the satellite images used (Frezzotti and others, Reference Frezzotti, Capra and Vittuari1998; Kääb, Reference Kääb2002). For the small surface velocities of about several millimeters per hour over the TP glaciers, the hourly or sub-daily variation in surface flow speed is difficult to detect with the existing satellite data due to relatively large pixel size (several meters).
Terrestrial radar instruments can obtain time series radar datasets with a very short interval (up to a few minutes) (Monserrat and others, Reference Monserrat, Crosetto and Luzi2014). Therefore, the terrestrial radar interferometry technique, which generally overcomes the drawback of low-temporal resolution in satellite InSAR, is an effective method for monitoring temporal variations of surface ice motion on timescales of hours to a day. In general, the potential of terrestrial radar interferometry for accurately measuring glacier surface motion has been validated by previous studies (Luzi and others, Reference Luzi2007; Noferini and others, Reference Noferini, Mecatti, Macaluso, Pieraccini and Atzeni2009; Voytenko and others, Reference Voytenko2015). Allstadt and others (Reference Allstadt, Shean, Campbell, Fahnestock and Malone2015) detected large seasonal variations of glacier surface velocity from July to November 2012, by applying a portable radar interferometer at Nisqually Glacier, located in the Cascade Range, USA. However, no diurnal variability in glacier surface motion was found by Allstadt and others (Reference Allstadt, Shean, Campbell, Fahnestock and Malone2015). Riesen and others (Reference Riesen, Strozzi, Bauder, Wiesmann and Funk2011) successfully measured daily variations in glacier surface displacements over Gornergletscher, Switzerland in June 2008, which are caused primarily by the adjacent lake drainage.
In this paper, we present high temporal resolution measurements of glacier surface motion over the terminus area of Laohugou No. 12 (LHG12) Glacier in the western Qilian mountains to improve our knowledge of short-interval variations in glacier surface velocity on the TP. The terrestrial radar observation campaign was carried out during 8–12 July in 2015 to measure continuous ice surface motions with a time interval of about 6 min. Time series of glacier surface displacements were derived from radar interferometric analysis, and the diurnal fluctuation pattern of glacier motion and the effect of air temperature on glacier surface velocity were analyzed. Moreover, the terrestrial radar measurements of glacier surface motions were validated with the results obtained by the D-GPS method. Finally, we discuss the dominant motion mechanism of the measured short-interval variations in glacier surface velocity.
2. STUDY AREA
LHG12 Glacier, the longest and largest valley glacier in the Qilian mountains, northeastern TP, stretches ~10.1 km and covers a total area of more than 21.91 km2 (Zhang and others, Reference Zhang, Liu, Shangguan, Li and Zhao2012; Chen and others, Reference Chen2018). The glacier ranges in elevation from 4260 to 5481 m and the equilibrium line altitude is 4830 m (Du and others, Reference Du, Qin, Liu and Wang2008). The mean ice thicknesses of east and west branches are 190 and 150 m, respectively (Wang and others, Reference Wang2016). This glacier is generally identified as a cold glacier due to the continental and arid climate, which is dominated by the Siberian anticyclone and westerlies (Du and others, Reference Du, Qin, Liu and Wang2008; Chen and others, Reference Chen, Qin and Wu2014). The size of LHG12 Glacier gradually decreased between 1957 and 2007, and a higher rate of glacier area loss has taken place since 1994 due to accelerated warming since the mid-1980s (Zhang and others, Reference Zhang, Liu, Shangguan, Li and Zhao2012). In-situ observations of glacier mass balance, glacier surface motion and terminus location have been conducted since 2005 (Sun and others, Reference Sun2011).
Wang and others (Reference Wang2018) modeled basal ice velocities of <4.0 m a−1 at LHG12 Glacier, which contributed little to surface velocities. However, a large discrepancy of glacier surface velocity between summer months (~40.0 mm d−1) and winter months (~10.0 mm d−1) was detected with the GPS technique at several stakes located over the glacier tongue in 2008–09 (Liu and others, Reference Liu, Qin, Du, Sun and Hou2010). According to the review of intra-annual variations in glacier motion (Willis, Reference Willis1995), basal slip might be the dominant motion mechanism of this large seasonal variation of glacier flow velocity over the terminus region. Therefore, short-interval measurements of glacier motion speed in summer season are significant over this glacier to provide more information for identifying the effect of basal slip on glacier surface velocity.
3. DATA AND METHODS
3.1. Fieldwork description
In this study, we used the IBIS-L (Image By Interferometric Survey) instrument, a ground-based SAR (GB-SAR) imaging system made by IDS (Ingegneria Dei Sistemi) company in Italy (Bozzano and others, Reference Bozzano, Cipriani, Mazzanti and Prestininzi2011), to monitor ice motion of the LHG12 Glacier's tongue (as shown in Fig. 1). Basically, a GB-SAR system has two types of data acquisition modes: the continuous and the discontinuous (Monserrat and others, Reference Monserrat, Crosetto and Luzi2014). The IBIS-L SAR system can allow the continuous data acquisition mode to collect time series SAR images at every 6.05 min, thus enabling us to investigate the diurnal changes in the glacier surface velocities. Theoretically, the IBIS-L SAR system can detect surface displacement in the radar line-of-sight (LOS) direction with 0.1 mm accuracy, as the phase information of Ku band radar signal is processed by the SAR interferometric technique (Rödelsperger and others, Reference Rödelsperger, Läufer, Gerstenecker and Becker2010). The in situ observations of GB-SAR started at 13:30 of 8 July 2015 and lasted for ~4 d. We used the entire two meters linear rail track of the IBIS-L instrument, in order to acquire SAR data with the best spatial resolution. Moreover, we configured the maximum observation range of 1000 m, according to the surface topography of the glacier terminus region. The main parameters of the GB-SAR observation are summarized in Table 1.
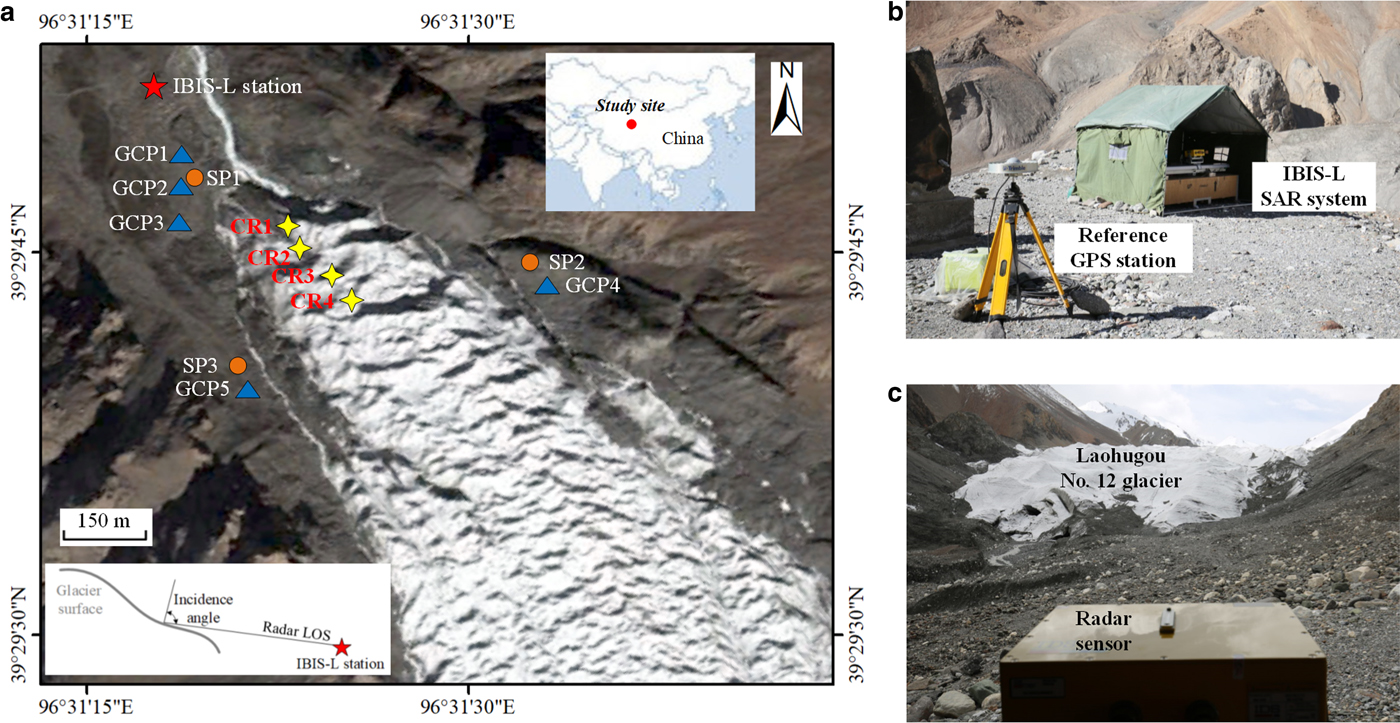
Fig. 1. (a) Geographic map of the terminus area of LHG12 Glacier (white) and its surroundings. The locations of IBIS-L GB-SAR station, GCPs, CRs and SPs are indicated by red five-pointed star, blue triangles, yellow four-pointed stars and orange circles, respectively. Inset: Diagram of the vertical plane of GB-SAR measurement. (b) Photographic records of the IBIS-L GB-SAR station and the reference GPS station. (c) The view of the terminus area of LHG12 Glacier from the IBIS-L radar sensor.
Table 1. Main parameters of the IBIS-L GB-SAR observation

Despite the designed accuracy of 0.1 mm in deformation estimates, the IBIS-L SAR instrument is difficult to achieve this very high-precision for all pixels in the acquired image especially over glacier areas (Monserrat and others, Reference Monserrat, Crosetto and Luzi2014). In general, the observation accuracy of a pixel is affected by its radar backscattered amplitude (Leva and others, Reference Leva, Nico, Tarchi, Fortuny-Guasch and Sieber2003; Takahashi and others, Reference Takahashi, Matsumoto and Sato2013). Therefore, we installed four corner reflectors (CRs) made by aluminum alloy on the surface of the glacier tongue region (see Figs 2a, b) to obtain reliable and accurate time series of surface ice motions along the glacier center-line. Simultaneously, air temperature of 10 min intervals was observed by using a sensor of Testo 175 H1, Germany (accuracy: ±0.4 °C) to analyze its relation to glacier surface movements. In addition, the locations of four CRs and five big rocks (ground control points, GCPs) beside the glacier outline were measured by GPS RTK (real-time kinematic) technique to convert surface velocity field from radar coordinate into WGS84 coordinate.
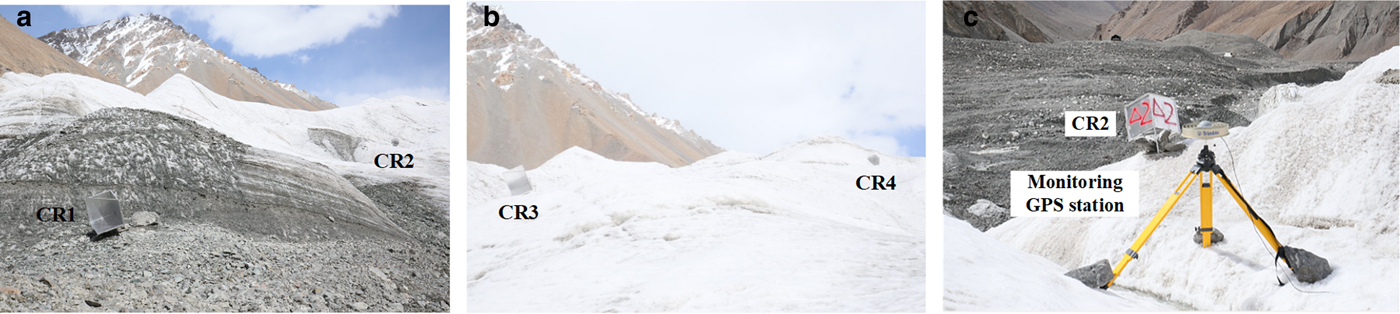
Fig. 2. Photographic records of the four CRs installed in our fieldworks (a, b), and the locations of CR2 and monitoring GPS station (c).
In order to validate the temporal variations of surface ice motions observed with the GB InSAR technique, we applied the D-GPS method to accurately observe hourly glacier surface displacements. The reference and monitoring stations were installed near the IBIS-L SAR instruments (Fig. 1b) and the CR2 (Fig. 2c), respectively. Two Trimble NET R9 GPS receivers, equipped with Trimble choke ring antennas to reduce multi-path noise, were employed to collect the original GPS data at every second. Acquired D-GPS datasets were processed by Bernese software (Dach and others, Reference Dach, Lutz, Walser and Fridez2015) to accurately estimate the hourly average locations of the monitoring station relative to the reference station. Trimble GPS receiver of the monitoring station stopped working at noon on 11 July due to battery failure. Thus, we only compare the surface ice motion of the CR2 observed from GB InSAR with that simultaneously detected by the D-GPS method.
3.2. GB-SAR data processing
3.2.1 Cumulatively SAR interferometric processing
The acquired continuous IBIS-L SAR images were processed with the SAR interferometric technique to accurately measure surface flow velocity of the LHG12 Glacier. Generally, temporal decorrelation induced by the changes of glacier surface features between SAR acquisitions is the major limitation for the application of SAR interferometry in monitoring glacier surface velocity (Bechor and Zebker, Reference Bechor and Zebker2006; Luckman and others, Reference Luckman, Quincey and Bevan2007). Here, the GB-SAR datasets were continuously acquired to mitigate the temporal decorrelation. Moreover, pixels affected by strong temporal decorrelation due to snow/ice rapid-melting were excluded in the interferometric processes by using a coherence threshold of 0.8. Importantly, instead of generating interferograms all related to a common master SAR image (e.g. first acquisition), we calculated cumulative interferograms by combining each pair of InSAR data obtained with the minimum time interval (6.05 min) (Noferini and others, Reference Noferini, Pieraccini, Mecatti, Macaluso and Atzeni2005). This cumulative processing can effectively keep high coherence between SAR images, since the decorrelation rate is generally associated with time (Prats and others, Reference Prats, Scheiber, Reigber, Andres and Horn2009).
Phase unwrapping was not employed in the following processing, because the magnitude of glacier surface motion and atmospheric delay variation in the short time-period of 6.05 min are much less than the measuring ambiguity of IBIS-L SAR interferometry. Orbital and topographic phase are not contained in the interferogram due to the zero-baseline configuration (Monserrat and others, Reference Monserrat, Crosetto and Luzi2014), the remaining phase components result from displacement and atmospheric delay variation. At the LHG12 Glacier, the observed glacier surface velocity is only ~40.0 mm d−1 (1.67 mm h−1) in summer (Liu and others, Reference Liu, Qin, Du, Sun and Hou2010). Assuming that the maximum speed in the daytime is four times the daily average velocity observed by Liu and others (Reference Liu, Qin, Du, Sun and Hou2010), the maximum displacement (~0.2 mm) in 6.05 min is still <1.0 mm. Moreover, the variation of atmospheric delay between two SAR acquisitions is always <2.0 mm (see Fig. 3a). The measuring ambiguity (9.0 mm in this study) is half of the radar wavelength, therefore the measurements are not ambiguous and the phase unwrapping is neglected in the processing.

Fig. 3. (a) Time-series GB In-SAR observations of the selected five GCPs. The range distances (RD) of GCP1, GCP2, GCP3, GCP4 and GCP5 are 150, 155, 163, 550 and 535 m, respectively. (b) Comparison between the original InSAR measurements and the results after atmospheric phase correction at three SPs.
In addition, the derived glacier surface motions were transformed from the SAR image coordinate into WGS84 coordinate by using the GPS observations of the CRs and GCPs.
3.2.2 Atmospheric phase correction
In this study, the biases related to atmospheric effects were corrected by using several GCPs located at the relatively stable bedrocks near the glacier terminus area. Based on the coherence-based criterion proposed by Berardino and others (Reference Berardino, Fornaro, Lanari and Sansosti2002), we selected five GCPs (their locations are shown in Fig. 1a) with the coherence of more than 0.9. These GCPs are assumed to be motionless during the GB-SAR data acquisitions. The observed displacements of GCPs are mainly caused by atmospheric effects (Antonello and others, Reference Antonello2004). As suggested by Luzi and others (Reference Luzi2004) and Noferini and others (Reference Noferini, Pieraccini, Mecatti, Macaluso and Atzeni2005), we employed the time series InSAR observations of five GCPs (as illustrated in Fig. 3a) to estimate a function of the LOS range for each interferogram and then correct atmospheric effects of each pixel. Furthermore, three stable points (SPs) at the ice-free regions (as exhibited in Fig. 1a) were selected to validate the effectiveness of the applied method of atmospheric phase removal. It is shown in Figure 3b that original InSAR observations of the SPs range from −5.0 to +10.0 mm. After the process of atmospheric phase correction, the remained movements of these SPs decline to between −2.0 and +2.0 mm. This indicates that the bias related to atmospheric delay variation has been effectively corrected.
3.3. Error analysis
For glacier surface motion observed by a Ku band GB-SAR system, errors arise from phase noises which are mainly related to decorrelation and atmospheric effects. In order to present a detailed analysis of the errors of GB InSAR measurements, Riesen and others (Reference Riesen, Strozzi, Bauder, Wiesmann and Funk2011) employed the in situ GPS and tachymeter observations on nine reference markers. However, here we only conducted in situ observation at one site by applying the D-GPS technique. Furthermore, the GPS receiver stopped working at noon on 11 July due to battery failure. Considering the lack of in situ observations, we estimated the error by using measurements in ice-free regions. Like the method adopted by Zhou and others (Reference Zhou2011) and Sun and others (Reference Sun, Jiang, Liu, Sun and Wang2017), we assumed that the off-glacier area is stable. Therefore, based on the theoretical framework of uncertainty calculation suggested by Rolstad and others (Reference Rolstad, Haug and Denby2009), statistical error (σ) of the GB InSAR measurements is calculated with the following equation:
 $$\sigma = \sqrt {m^2 + {\left( {\displaystyle{{STDV} \over {\sqrt N}}} \right)}^2} $$
where m and STDV are the mean value and Std dev. of measured movements over off-glacier areas, respectively. N is the number of independent measurements and can be calculated with
 $$N = \displaystyle{{N_{{\rm total}} \times PS} \over {2D}}$$
where N total is the total number of measurements, PS is the pixel size, and D is the distance of spatial autocorrelation (here 28 m), estimated by using the semivariogram.
4. RESULTS
4.1. Cumulative glacier surface displacements
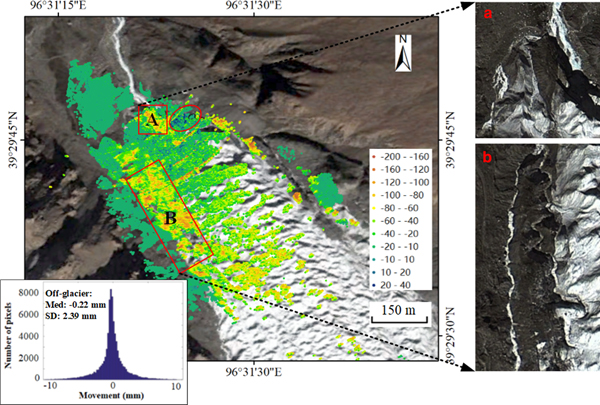
Figure 4 illustrates the detailed glacier surface displacements during 8–12 July in 2015 over the terminus area of LHG12 Glacier generated by the GB-SAR interferometry. Negative (positive) values indicate motion toward (away from) the IBIS-L station. In general, most of the study area experienced a slight surface movement toward the station with <40 mm of displacements. The larger glacier surface motions (up to ~200 mm) were detected near the gullies shaped by snow/ice meltwater (two red rectangles in Fig. 4). However, a small region near the glacier boundary (red ellipsoid in Fig. 4) was found to be move away from the IBIS-L station. According to the measurements with ground penetrating radar, this area is identified as an ice cave (Wu and others, Reference Wu, Liu and Zhang2009). Thus, the observations of glacier surface motions possibly indicate subsidence or ice melting on the top of this ice cave, which is generally in accordance with the collapsing event recorded with photos during this fieldwork (Fig. 5). In addition, based on Eqns (1) and (2), we estimated that the error of cumulative glacier displacements is 0.26 mm.

Fig. 4. Cumulative surface displacements (unit: mm) observed with the IBIS-L GB-SAR system over the terminus area of LHG12 Glacier. The background and pictures on the right (labeled as A and B) are the satellite optical images acquired from Google Earth. The inset histogram shows the distribution of cumulative displacements over the off-glacier regions, and Med is the median value and SD is the Std dev..
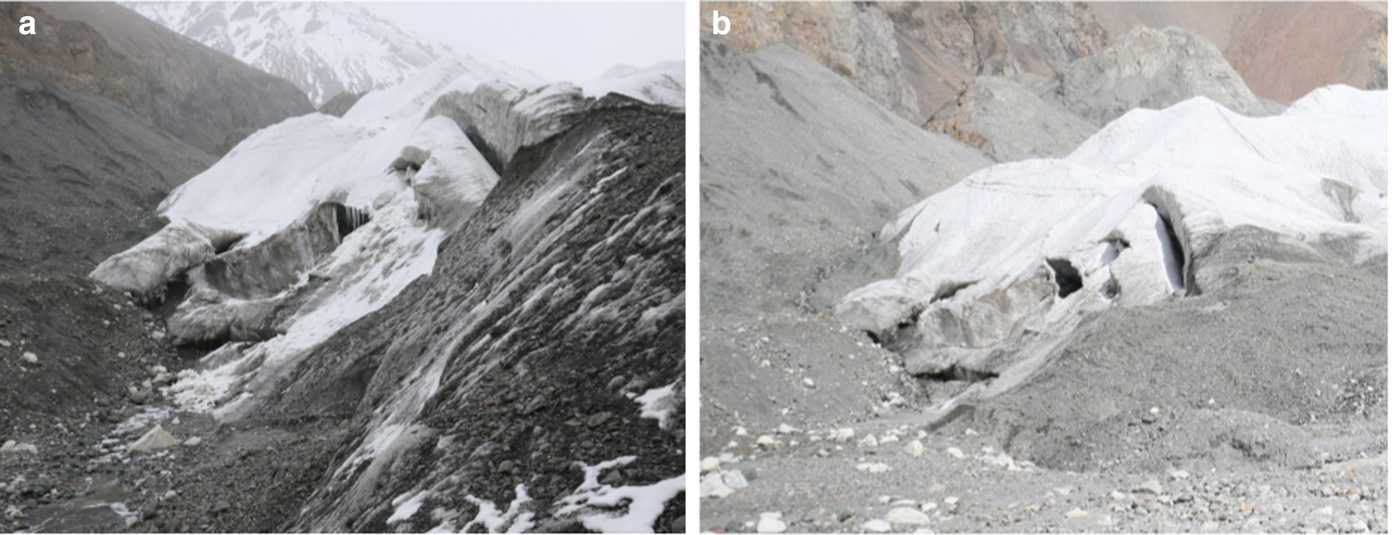
Fig. 5. Collapsing ice cave at the terminus area of LHG12 Glacier recorded during the field investigation.
4.2. Diurnal fluctuations of glacier surface motion
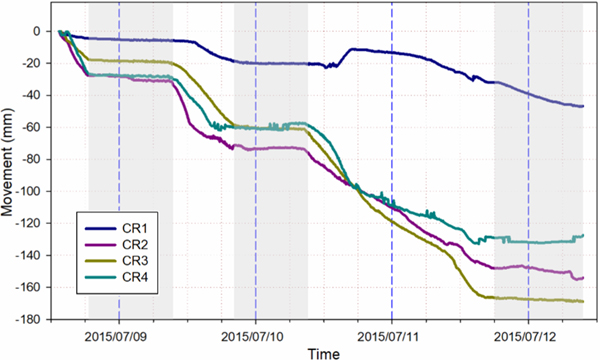
Displacement time series of the four CR points were employed to analyze the temporal changes of surface ice movements on the glacier tongue. Figure 6 illustrates a continuous motion toward the SAR station at the four CRs, except for the movements at the CR1 during 14:00–17:00 on 10 July that moved away from the SAR station. The opposite movements at the CR1 may be caused by ice melting or a slight backward tilt of this CR. Thus, the CR1 is excluded from the following discussion. In general, the other three CRs (CR2, CR3 and CR4) experienced a similar temporal variation of displacements. These CRs continuously flowed toward the IBIS-L station in the day-time hours. However, the displacements of these CRs were generally small at night, except for the 10–11 July.
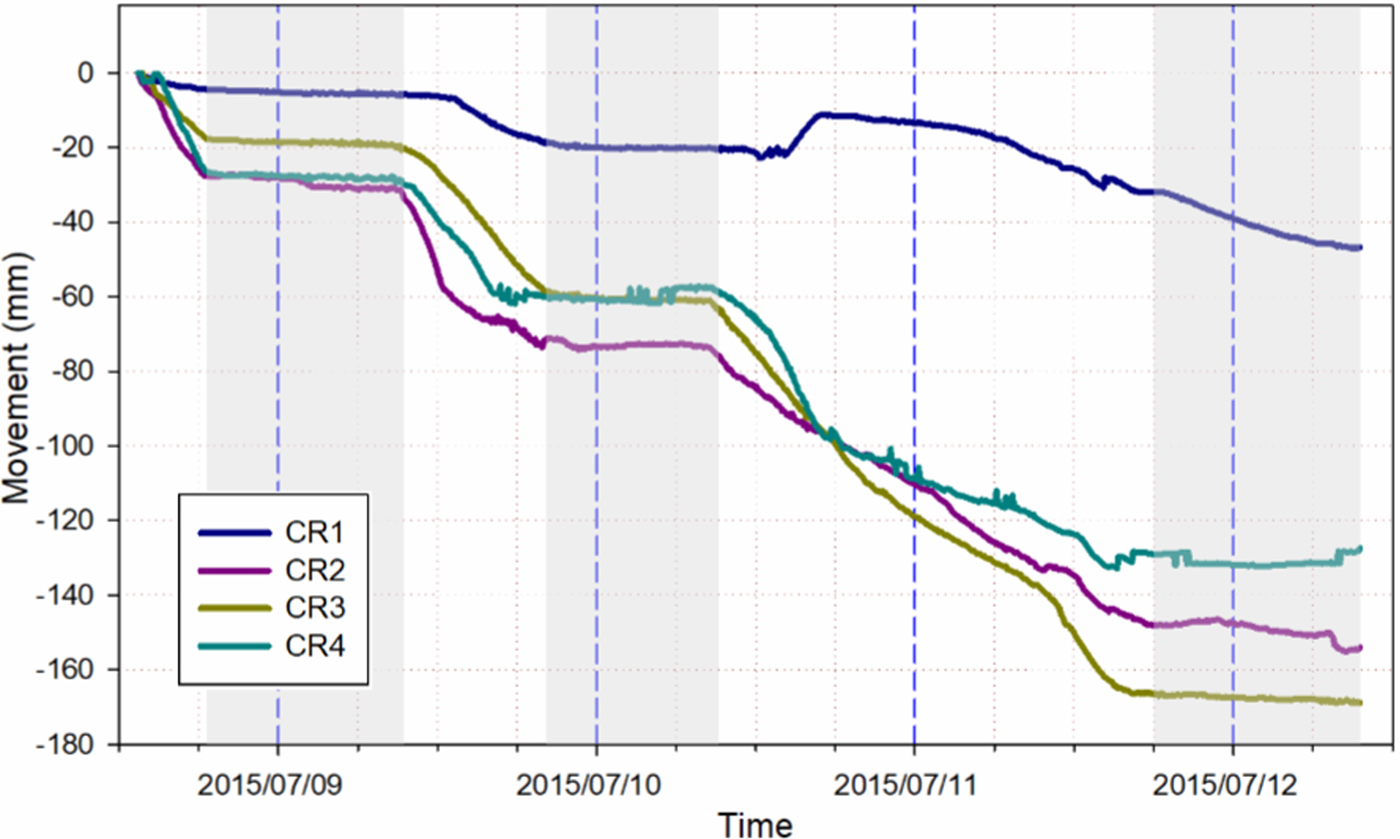
Fig. 6. Movement time series observed with IBIS-L GB-SAR system at four CRs of CR1, CR2, CR3 and CR4 (blue, pink, yellow and cyan, respectively). The gray backgrounds indicate the time periods of quite small variation of movements. The blue dashed lines indicate midnight.
In order to further investigate the temporal features of glacier motion, we calculated the velocity of the three CRs from the displacement time series. As shown in Figure 7, the results clearly reveal diurnal fluctuations of glacier surface velocity, which is generally in agreement with the changes in air temperature. The CRs flowed with a velocity of more than 3.0 mm h−1 (maximum velocity is up to ~8.0 mm h−1) in the day-times of our filed investigations, whereas the speeds in night-times were <1.0 mm h−1. The observed definite differences of day-night velocity agree generally with the diurnal cycles of ice movement over polythermal or temperate glaciers in the Alps (Sugiyama and Gudmundsson, Reference Sugiyama and Gudmundsson2004) and the High Arctic (Meier and others, Reference Meier1994), which have been found to be associated with changes in basal slip, rather than variations in internal ice deformation rates. Basically, glacier surface geometry and driving stress, which are the main factors of internal ice deformation, do not obviously change over such fast time-scales (Vieli and others, Reference Vieli, Jania, Blatter and Funk2004).
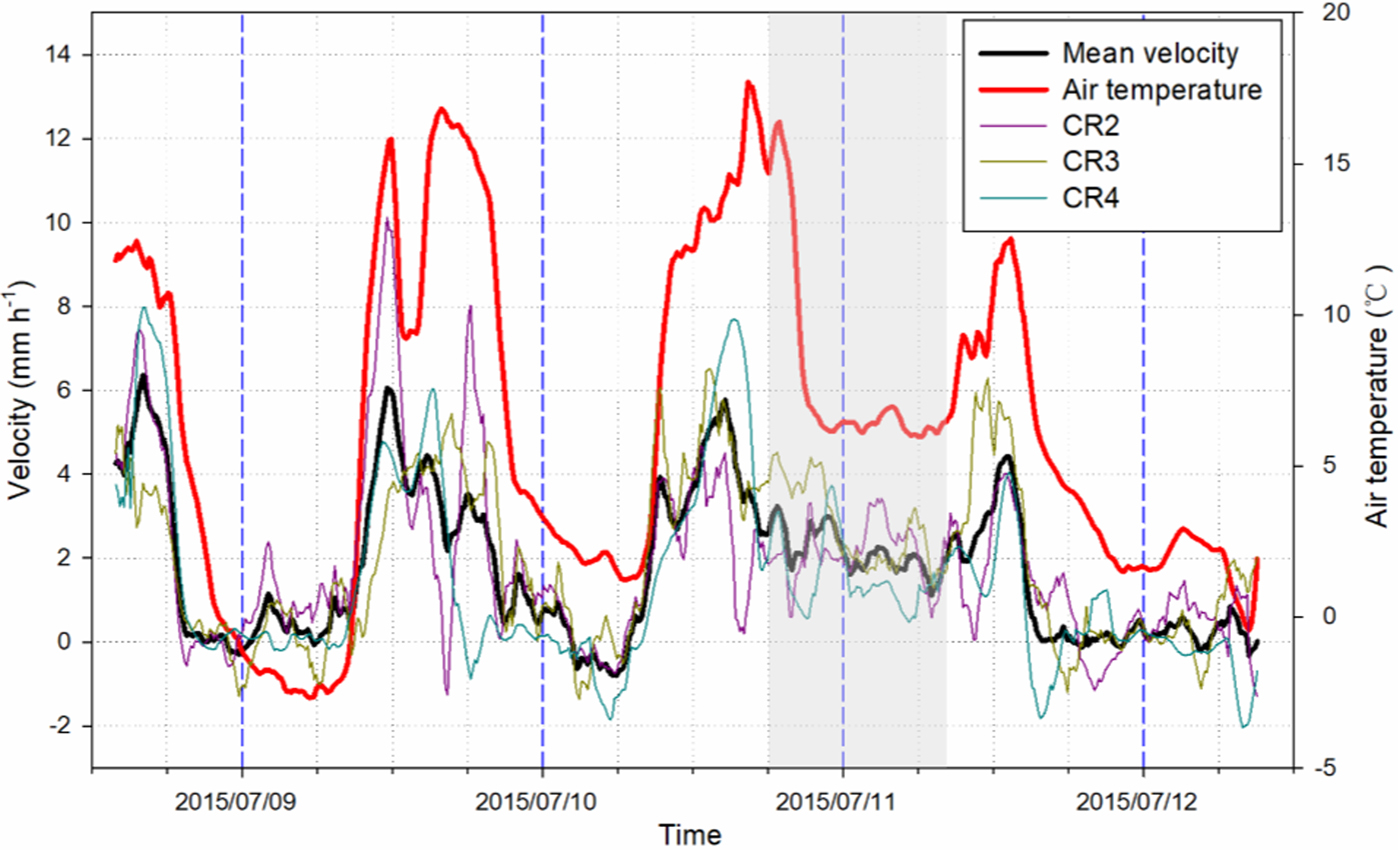
Fig. 7. Time series of glacier surface velocity observed at three CRs of CR2, CR3 and CR4 (pink, yellow and cyan, respectively). Positive value indicates the motion toward IBIS-L station. Mean motion speeds of these CRs are shown as black line. The red line indicates time series of air temperature. The night-time hours with relatively higher flow speed are exhibited as gray background. The blue dashed lines indicate midnight.
5. DISCUSSION
5.1. Comparison to GPS measured surface ice displacements
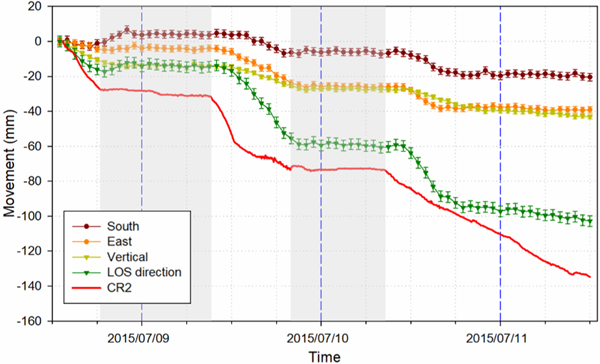
A GPS receiver installed beside CR2 (Fig. 2c) was used to validate the results of GB InSAR. Horizontal and vertical glacier surface motions observed with the D-GPS method were transferred to the radar LOS direction. Specifically, we employed the coordinates of the IBIS-L station and the average location of monitoring GPS station to calculate the orientation angles of LOS. By using these angles, we transferred the GPS measured ice movements to the LOS direction. Positive directions of the three-dimensional coordinate system are south, east and upward to compare the results measured by GPS and GB InSAR. Figure 8 exhibits that the temporal variations of glacier surface motions measured using the GB InSAR technique are similar with those of the D-GPS method. Continuous surface ice movements were simultaneously detected by the two methods in the day-time hours and the time period between the evening of 10 July and the morning of 11 July. During the other two night-times (labeled as gray background in Fig. 8), both the results obtained by the GB InSAR and D-GPS methods show a much small glacier surface motion.

Fig. 8. Comparison of the time series of glacier surface movements observed by the GB InSAR method and the D-GPS method. The contributions of southern, eastern and vertical components on the surface ice motions in LOS direction are exhibited as dark red, orange and light green lines, respectively. The movements of CR2 and monitoring GPS station in LOS direction are shown with red and green lines. The gray backgrounds indicate the time periods of quite small variation of surface movements. The blue dashed lines indicate midnight.
Cumulative displacements observed with the D-GPS method (102.7 mm) are relatively smaller than those measured with the GB InSAR method (134.8 mm). In particular, ice flow velocities observed with D-GPS are lower than InSAR measurements after the evening of 10 July, and a pause in glacier flow is observed in the D-GPS measurements but not in the InSAR data. These differences may be due in part to location of the GPS receiver and CR2. As illustrated in Figure 2c, the CR was installed over a slope, whereas the GPS receiver was set up at a relatively flat location. Furthermore, settling of the D-GPS monitoring station in the first few hours after installation on the ice surface may be the cause for the relatively lower surface ice motions observed with the D-GPS method. During the time period of 18:00–22:00 on 8 July 2015, the steady movements toward northern direction were detected (as shown in Fig. 8), which may be caused by a slight tilt of the GPS receiver's tripod.
5.2. Influences of air temperatures on glacier surface velocity
Day/night differences in glacier surface velocity were detected at all three CRs. Although the flow speeds of these CRs in night-times were generally <1.0 mm h−1, surface velocities between the evening of 10 July and the morning of 11 July increased to ~2.0 mm h−1. This discrepancy of night-time surface flow velocity may be caused by the difference in air temperature. As shown in Figure 7, air temperatures in night-times were higher than 7.0 °C, when the surface velocities of these CRs were ~2 mm h−1. However, during the other night-time hours, these CRs experienced a much lower motion speed due to the air temperature of lower than 5.0 °C. In particular, the speeds at these CRs are close to zero when night air temperature drops to below 3.0 °C.
For a more detailed analysis about the effect of air temperature on ice motion of LHG12 Glacier, we investigated the correlation between air temperature and glacier surface velocity. As shown in Figure 9, the observed ice flow velocities at CR2, CR3 and CR4 are correlated with air temperature (correlation coefficient (R) ranges from 0.61 to 0.81). Moreover, the maximum value of R (0.82) was detected for the relationship between the mean motion velocity of these CRs and air temperature (Fig. 9d). In general, a faster glacier surface flow speed is detected at the times with a higher air temperature. The reasonable interpretation of this strongly positive correlation is that high air temperature possibly causes intense snow/ice melting that can provide a large amount of meltwater to the glacier bottom as lubricating fluid, and thus accelerate basal slip (Kamb and others, Reference Kamb1994; Hewitt, Reference Hewitt2013). Note, no precipitation occurred during the 4 d of field investigation, though this can also cause rapid increases in glacier surface velocities (Benoit and others, Reference Benoit2015).

Fig. 9. Correlation between air temperature and the observed glacier surface velocities of CR2 (a), CR3 (b) and CR4 (c), and the mean flow velocity of these CRs (d). R and P are the correlation coefficient and p-value.
5.3. Dominant glacier motion mechanisms
Diurnal fluctuations in glacier surface velocity are mainly caused by changes in basal slip (Willis, Reference Willis1995). Hourly or sub-daily variation in glacier motion occur in summer when large differences between daytime and nighttime temperatures result in differences in snow/ice meltwater production. For the LHG12 Glacier, we found a distinct diurnal cycle in air temperatures during the field observation period (Fig. 7), and a corresponding decrease in velocity on nights when air temperature dropped to near-freezing. Higher nighttime temperatures on the night of 11–12 July coincide with higher rates of glacier motion at LHG12 Glacier. The observation of meltwater emerging from the glacier terminus during daytime (Fig. 10) supports the meltwater/basal slip hypothesis, though no observation of meltwater was made during the night.
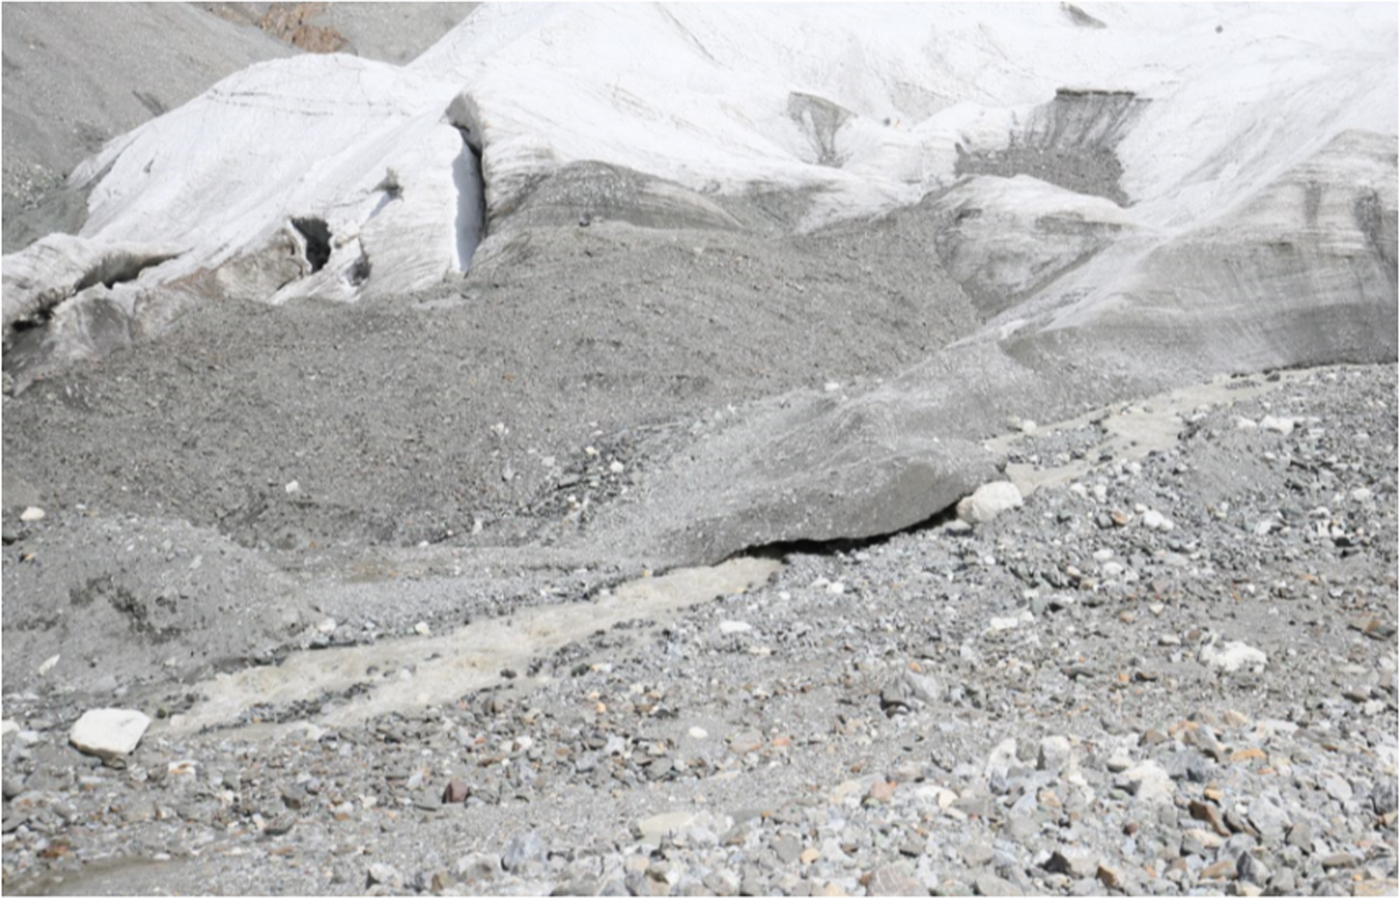
Fig. 10. Meltwater flow at the toe of LHG12 Glacier recorded during the 4-d field investigations.
Basal slip is also known to cause seasonal variations in glacier surface velocity (Willis, Reference Willis1995). During 2008–09, Liu and others (Reference Liu, Qin, Du, Sun and Hou2010) found that ice motion rates in summer months were four times larger than those in winter months over the terminus region of LHG12 Glacier. Therefore, the temporal features of diurnal fluctuations and seasonal variations in glacier surface velocity indicate that basal slip is the dominant ice motion mechanism in this glacier terminus region (Willis, Reference Willis1995). However, two-dimensional flow modeling results (Wang and others, Reference Wang2018) suggest that the contribution of basal slip to surface flow velocity is low over the terminus. The possible reason for this difference is that basal slip over the glacier terminus area is not captured by the ice flow model (Wang and others, Reference Wang2018). Observations presented in this study could therefore be used to improve and test ice flow models.
In previous studies, LHG12 Glacier is generally identified as a cold glacier due to the continental and arid climate (Du and others, Reference Du, Qin, Liu and Wang2008; Chen and others, Reference Chen, Qin and Wu2014). However, intra-annual changes of glacier surface velocity, which are mainly related to variations in basal slip, cannot be detected over cold glaciers. Basically, the bottom of a cold glacier is frozen to the bed throughout the year (Echelmeyer and Wang, Reference Echelmeyer and Wang1987). Thus, the surface flow speed of a cold glacier is mainly associated with internal ice deformations, rather than basal slip (Waller, Reference Waller2001). However, Iken (Reference Iken1972) provided the first evidence that basal motion was able to occur beneath mostly-cold polythermal Arctic glaciers during the melt season. During the past decades, intra-annual variations of glacier surface velocity have been detected over polythermal or temperature glaciers in the Alps (Sugiyama and Gudmundsson, Reference Sugiyama and Gudmundsson2004; Nienow and others, Reference Nienow2005) and the High Arctic (Bingham and others, Reference Bingham, Nienow and Sharp2003; Whitehead and others, Reference Whitehead, Moorman and Wainstein2014). Here, the observed diurnal fluctuations and seasonal variations of glacier surface velocity caused by changes in basal slip possibly indicate that the lower part of LHG12 Glacier is polythermal. Furthermore, the polythermal glacier deduced from glacier velocity changes is consistent with the polythermal structure of ice temperature presented by Wang and others (Reference Wang2018).
6. CONCLUSIONS
In this study, we employ the GB-SAR interferometry technique to measure short-interval (~6 min) variations in glacier surface velocity during 8–12 July in 2015 over the terminus area of LHG12 Glacier, western Qilian mountains, China. We find that most of the terminus experienced a slow movement (<40 mm), and relatively larger displacements (up to ~200 mm) occurred near the gullies shaped by snow/ice meltwater. The GB InSAR observed surface displacement time series agree with those derived using the D-GPS method. Significantly, the results clearly reveal diurnal fluctuations of glacier surface velocity. Moreover, a strongly positive correlation (R = 0.82, P < 0.001) between air temperatures and glacier surface velocities indicates that the observed glacier velocity diurnal variations are probably related to the discrepancies in air temperature between day-times and night-times. High air temperature in day-time hours possibly generates a large amount of snow/ice meltwater that can lubricate the glacier bottom and thus accelerate basal slip (Kamb and others, Reference Kamb1994; Hewitt, Reference Hewitt2013), whereas snow/ice meltwater is probably limited in night-time hours due to low air temperature. The short duration of our field measurements precludes drawing firm conclusions about the direct relation between surface melt and flow speed on the LHG12 Glacier. Longer-term high temporal resolution velocity measurements combined with subglacial hydrology are needed to determine the contribution of basal slip on the diurnal flow of high-elevation polythermal glaciers.
The observed diurnal fluctuations of glacier surface velocity associated with basal slip further indicate that LHG12 Glacier is polythermal in its lower part, which is supported by the evidence of polythermal glaciers in other glaciated regions of the TP, e.g. West Kunlun (Yasuda and Furuya, Reference Yasuda and Furuya2013). It is worth noting that the diurnal cycles of glacier surface velocity are not always detected over polythermal or temperate glaciers. Some temperate glaciers in the Alps such as Lauteraargletscher (Sugiyama and Gudmundsson, Reference Sugiyama and Gudmundsson2004) and Haut Glacier d'Arolla (Nienow and others, Reference Nienow2005) are also found to experience diurnal fluctuations of surface flow speed. However, Allstadt and others (Reference Allstadt, Shean, Campbell, Fahnestock and Malone2015) observed no diurnal variability in glacier surface motion at the Nisqually Glacier, USA. Furthermore, the detected strong correlation between air temperature and glacier surface velocity is likely specific to LHG12 Glacier and cannot necessarily be generalized to any glacier. Basal slip is determined by both meltwater input and the character of the subglacial drainage system: slip is generally limited over glaciers with a well-channelized subglacial drainage system (Nienow and others, Reference Nienow2005), which suggests that the sub-glacial drainage is distributed at LHG12 Glacier.
ACKNOWLEDGEMENTS
This study was financially supported by the National Key Research and Development program (2017YFA0603103 and 2018YFC1406102), the NSFC (41431070, 41704023 and 41590854), the China postdoctoral science foundation (2017M622452), and the key research program of frontier sciences, CAS (QYZDB-SSW-DQC027 and QYZDJ-SSW-DQC042). We thank the three anonymous reviewers, Joseph Shea (Scientific Editor) and Hester Jiskoot (Chief Editor) who improved this manuscript. Thanks to the postgraduate student of Binbin Gao and the staff of Qilian mountains station operated by Chinese Academy of Sciences provided field assistance.


 Open access